


and the winner is
In our chart book from two weeks ago we posted this chart:
BTC/USDT, daily chart September 12th 2019, “what if”:
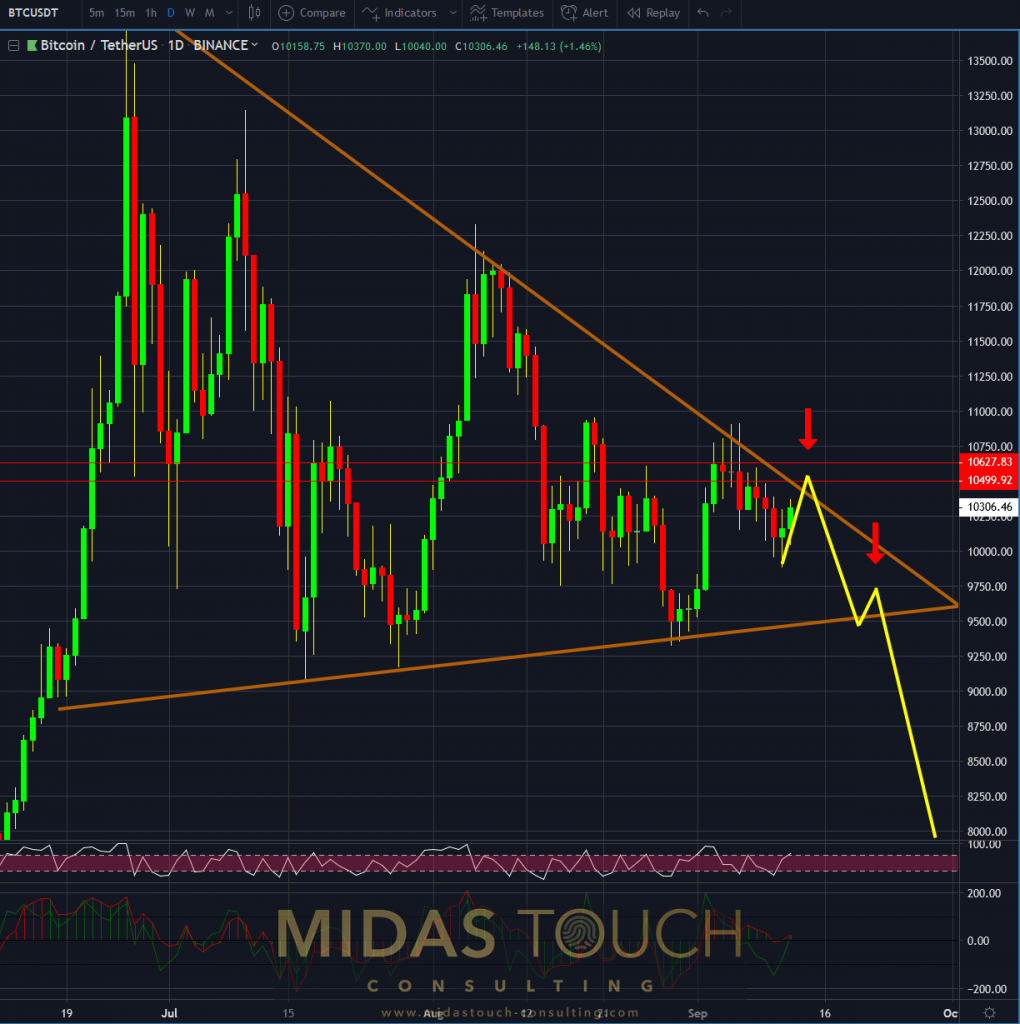
Bitcoin in TetherUS, daily chart as of September 12th 2019 b
We mentioned “a high likelihood of a volatile move. Massive support will be broken. Since the 10k price level represents a psychological anchor in the media, we might see swift price behavior and a large volume of stops being taken out.”
This is what actually happened:
BTC/USDT, and the winner is, daily chart September 28th 2019, “we told you so”:

Bitcoin in TetherUS, daily chart as of September 28th 2019
We were not that far off, for a two week out early call. The importance here is preparedness. Only with a confident clear cut vision of “what to do” and “when to do it” it is possible to step in with size before the freight train. Also different turning points need different entry timing. In this case being first and stepping in on size is the way to go. BTC/USDT traded on the 24th of September with highs at US$9,794.99 and lows at US$7,800. A breakdown in excess of twenty percent.
We posted live in our telegram channel two entries for the time frames 15 and 60 minutes with entries at US$7,807.20, and two entries for daily and weekly time frame with fills at US$7,832.30. We closed out the smaller time frames with runner profits of 7.50% and 8.53%. Daily and weekly time frame plays hit their financing targets respectively. (see quad exit strategy)
With so much banked profits it is easy to sit through the uncertain future of price movement with the rest of ones exposed money.
BTC/USDT, and the winner is, daily chart September 29th 2019, “early bird catches the worm”:
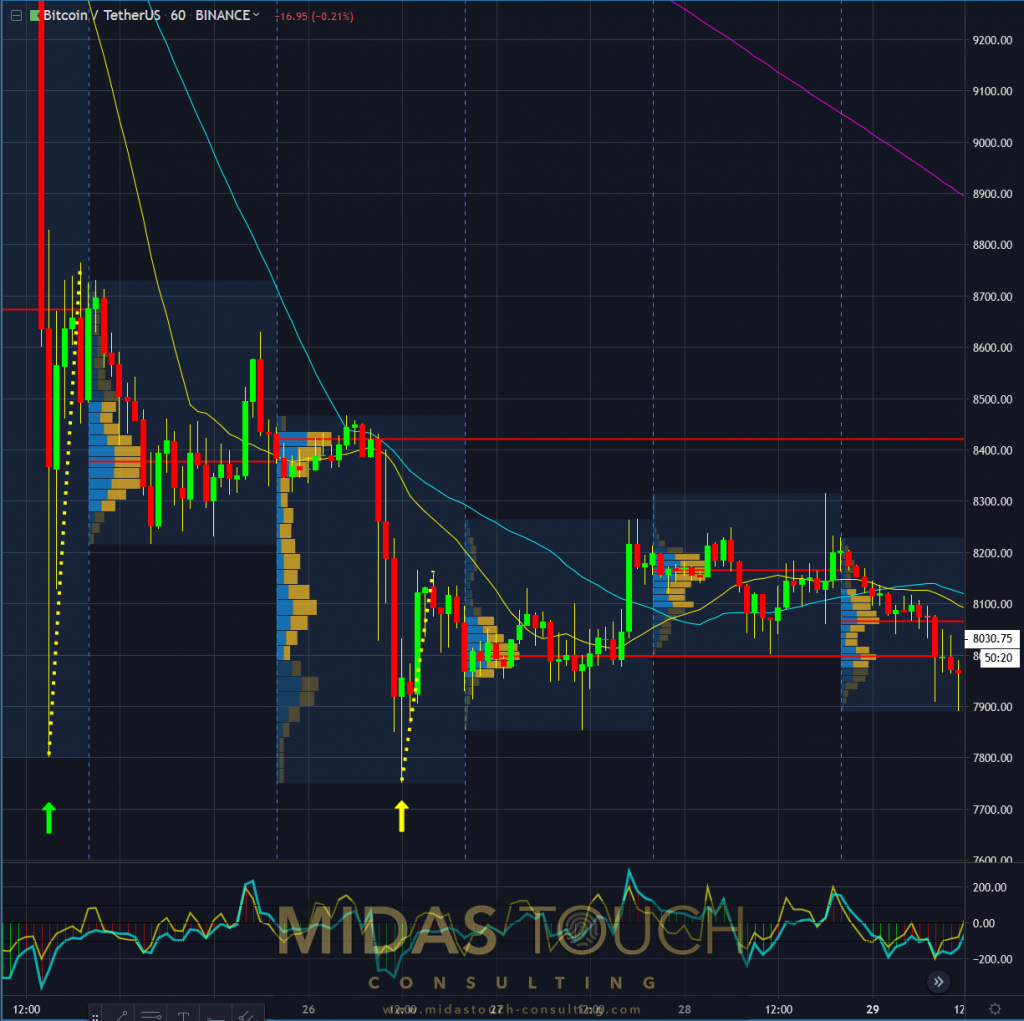
Bitcoin in TetherUS, 60 minute chart as of September 29th 2019
The sixty minute chart above shows why aggressive entries are warranted for in this steep decline scenario. We entered at the green arrow on the 24th of September. The yellow dotted line illustrating immediate profit potential in the above 8% possibility. A double bottom entry two days later marked with the yellow up arrow does not provide this immediate high return potential (see shorter dotted yellow line).
There are many ways to skin a cat, but in the markets one always is in best shape to pick the lowest risk method! In this specific case a probability for a “V” shaped turning point is high (literally with no second low risk entry point at all). And the great news are, that even if it results into a sideways consolidation, without certainty of a successful turning point, the early entry is the weapon of choice. Entering later in time, more often than not, results in sitting duck in a high risk position.
All charts timely posted in our telegram channel.
If you like to get regular updates on our gold model, precious metals and cryptocurrencies you can subscribe to our free newsletter.

