


The Midas Touch Gold Model™ Update
As usual at this time of the year, we would like to provide an update on the current status of the Midas Touch Gold Model™ and present our short- to medium-term outlook for the gold market. Our dear friends from Incrementum will publish this update in their upcoming In Gold We Trust report 2024. May 6th, 2024: The Midas Touch Gold Model™ Update.
The Midas Touch Gold Model™ analyzes the gold market from various perspectives with a rational and holistic approach. It stands out for its versatility and quantitative measurability. Despite the abundance of data, the model succeeds in presenting a comprehensive and in-depth analysis concisely in a table format and reaching clear conclusions.
The Midas Touch Gold Model™ switched from bullish to neutral on April 15th, 2024, allowing it to promptly identify the trend reversal in the gold market following the new all-time high at USD 2,431. Typically, the ongoing pullback should soon or later lead the gold price back to the breakout level in the range of approximately USD 2,075 to USD 2,150. Following such a healthy consolidation, the bull market is expected to gain momentum, with price targets surpassing USD 3,000. At that point, mining stocks are poised to finally catchup and then surge ahead.
Gold – The big picture
My simple stock market formula is: Stock market trend = Liquidity + Psychology. The most crucial factor is liquidity. When the world is awash in money, then the stock markets rise. – André Kostolany
Gold in US-Dollars, monthly chart as of May 4th, 2024. Source: Tradingview
A year ago, at this very spot, we forecasted a pullback in the gold market and defined two price targets for the correction at around USD 1,900 and USD 1,850 respectively. Ultimately, the anticipated pullback, starting from USD 2,070, extended until early October. Only after the paper jugglers at the Comex leveraged the trade-free “Golden Week” in Shanghai for a price suppression down to USD 1,810 did the gold market undergo a complete cleansing with this final panic sell-off.
Subsequently, there was a swift recovery, culminating on December 4th in a sharp price spike to a new all-time high of USD 2,149. This essentially marked the end of the three-and-a-half-year correction, with the strong resistance around USD 2,075 being at least partially breached. Nevertheless, it took another two and a half months before the foreseeable and long-awaited breakout rally actually materialized. The steep rise since early October had to be digested primarily over time and with a tenacious and tricky consolidation.
New all-time high at USD 2,431
Just in time for the next major upswing, the last weak hands were shaken off with a small bear trap and another pullback below the psychological mark of USD 2,000 on February 13th. From the low at USD 1,985, the bulls promptly re-entered the market. Only two weeks later, the gold price decisively achieved the important weekly closing price above USD 2,080. Encouraged by this bullish signal and the strong physical demand for the Chinese New Year, the bulls completely took control and pushed gold prices to a new all-time high of USD 2,431 by April 12th, without hardly any pullbacks. Thus, from its low point at USD 1,985 on October 6th, gold rallied sharply by USD 446 (+22.5%) within just two months. From the panic low at USD 1,810, there was an even more sensational increase of USD 621 (+34.3%) at its peak.
The truly flexible man in the market is the man who can be foolish at times, bullish at times, bearish at times, borrow money at times, be short at times, the person who can learn to be an expert on gold stocks in one period and some other style of stock in some other period. These men are exceedingly super-super rare. But they exist. And these are the men to watch, the men to learn from, they are the men who really make money on Wall Street. – Gerald M. Loeb, The Wizard of Wall Street
Although there hasn’t been excessive euphoria among gold bugs so far, the rally has significantly stalled in the last three weeks. Quick profit-taking in the form of two significant downward moves led to a hangover and an initial correction low at USD 2,277. While gold, at around USD 2,300, still stands significantly above its level at the beginning of the year (USD 2,063), signs are increasing for a short- to medium-term trend reversal and thus likely an extended correction. Given the strong price gains, overbought conditions, and unfavorable seasonality from now on, a pullback to the breakout level in the range of USD 2,075 to USD 2,150 would be healthy and entirely normal.
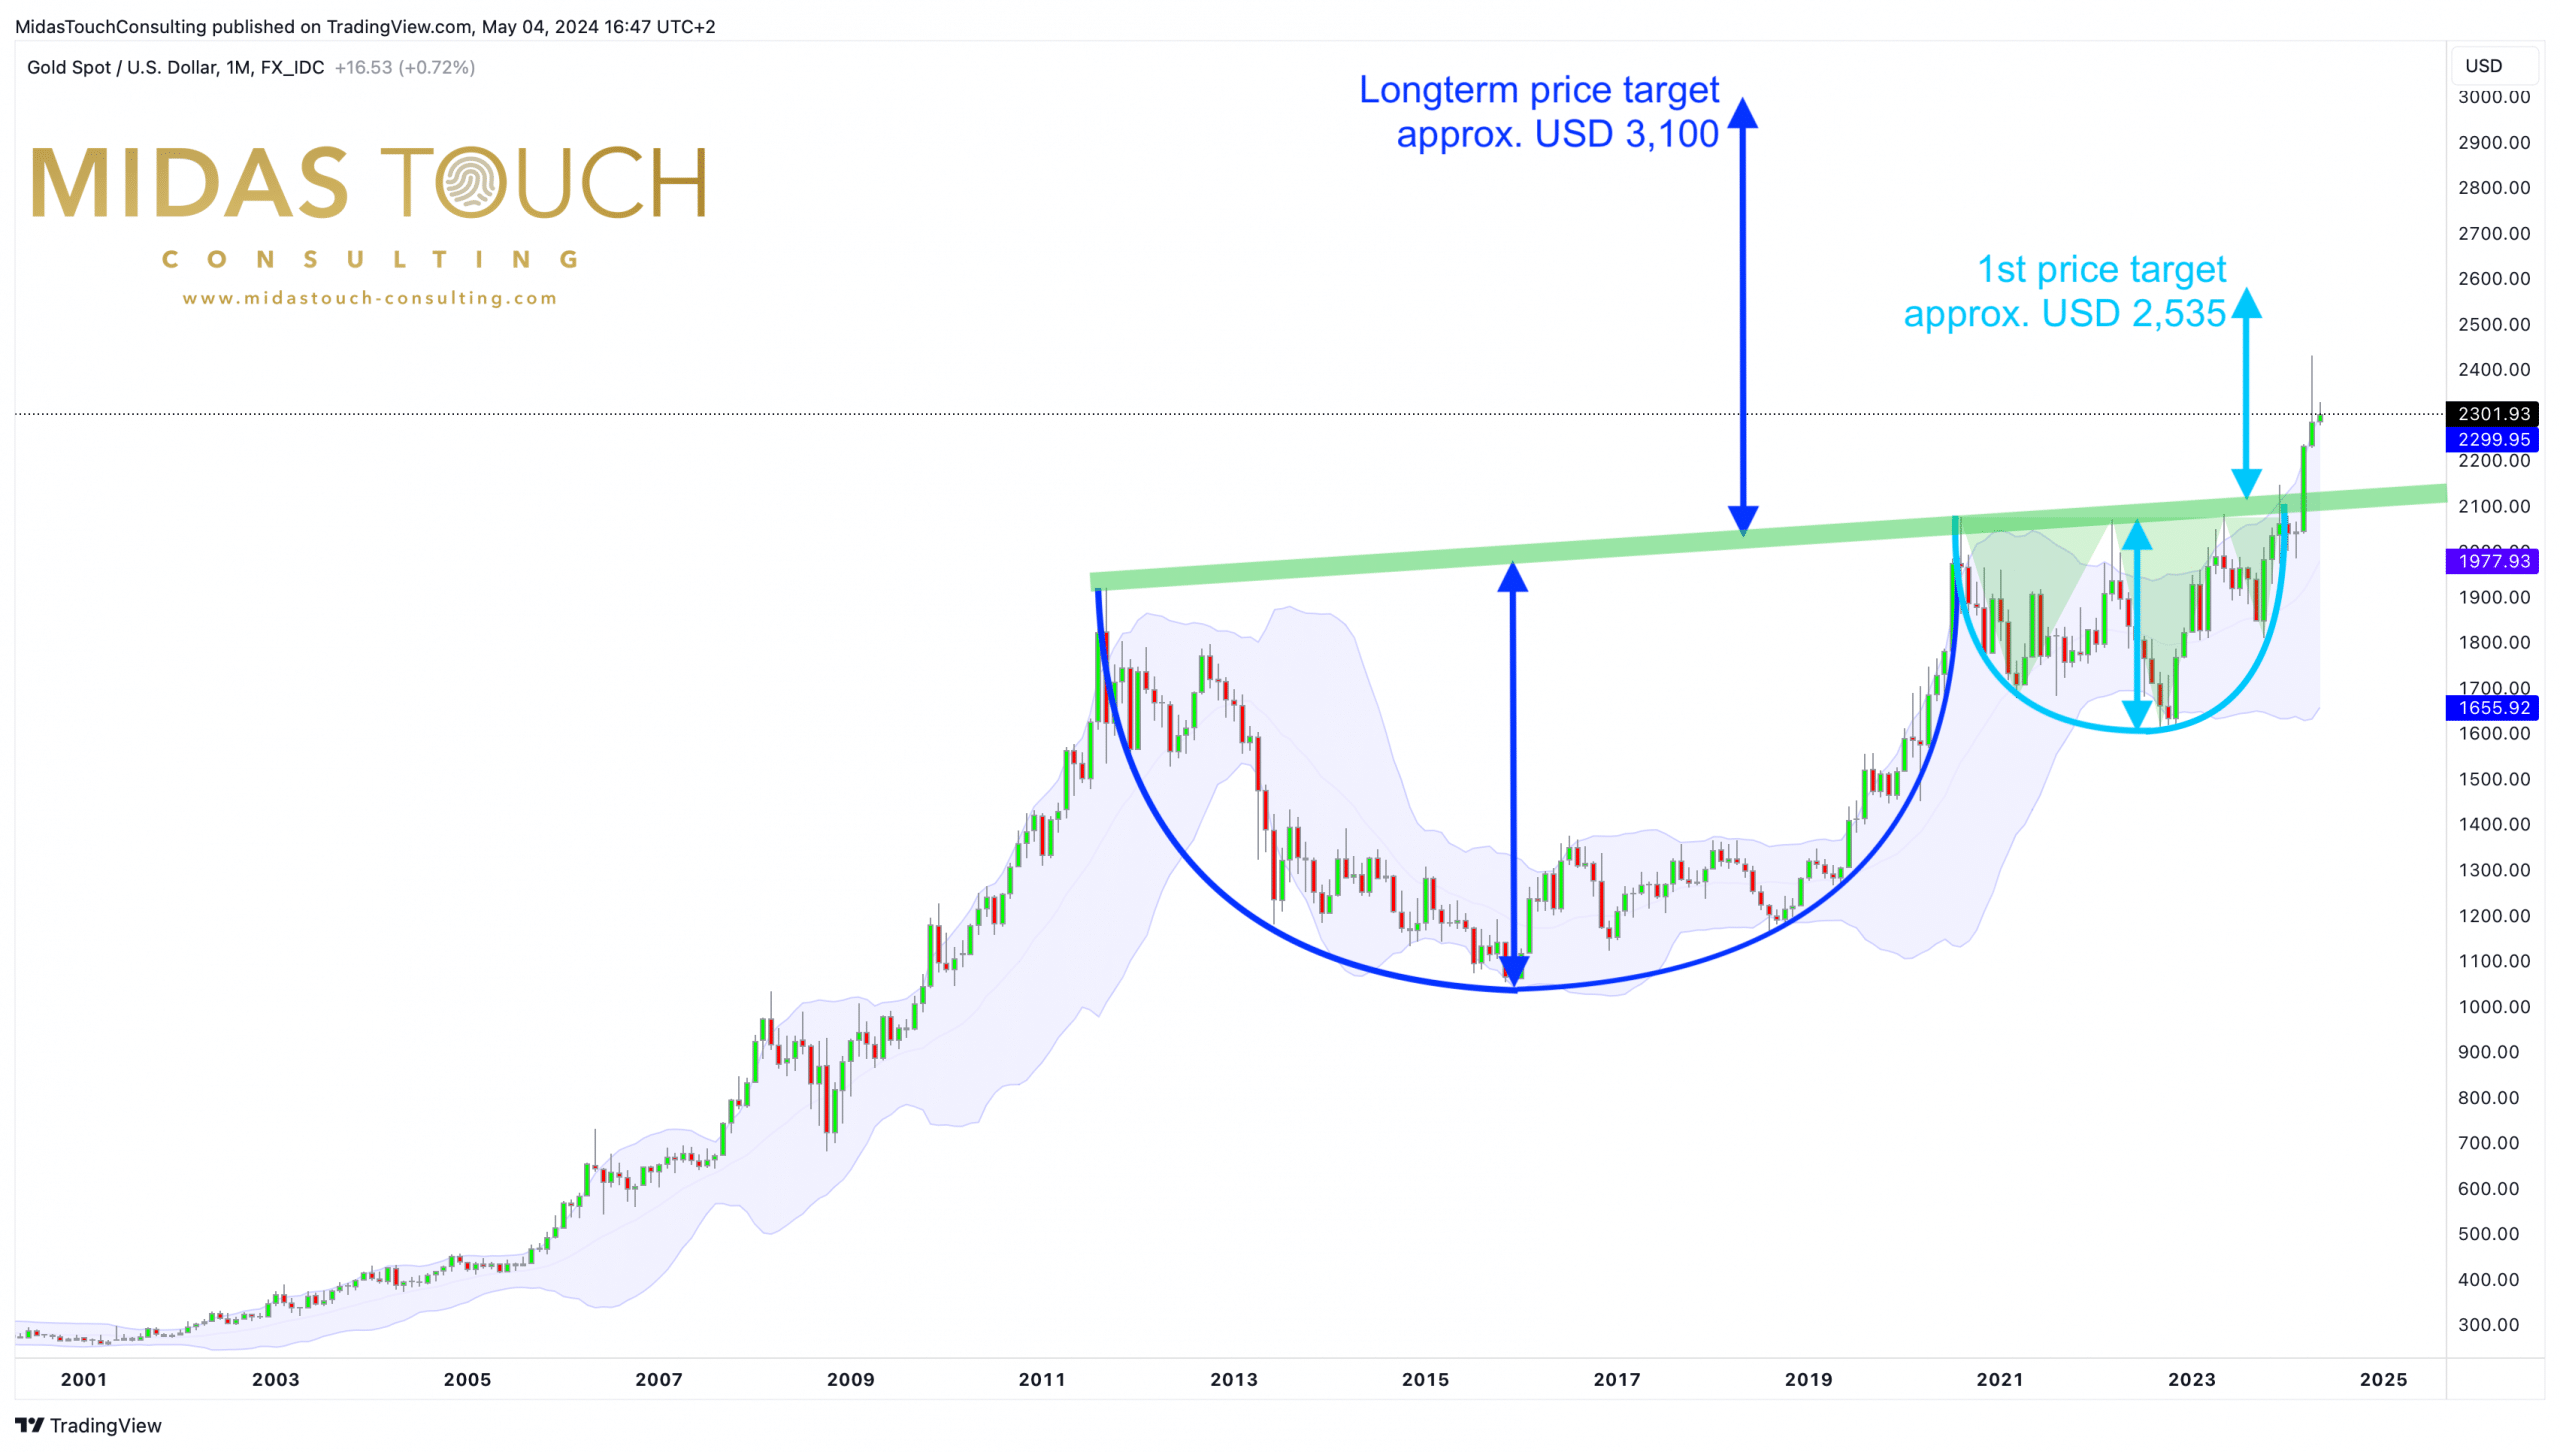
The cup-and-handle formation points to a long-term price target at around USD 3,100
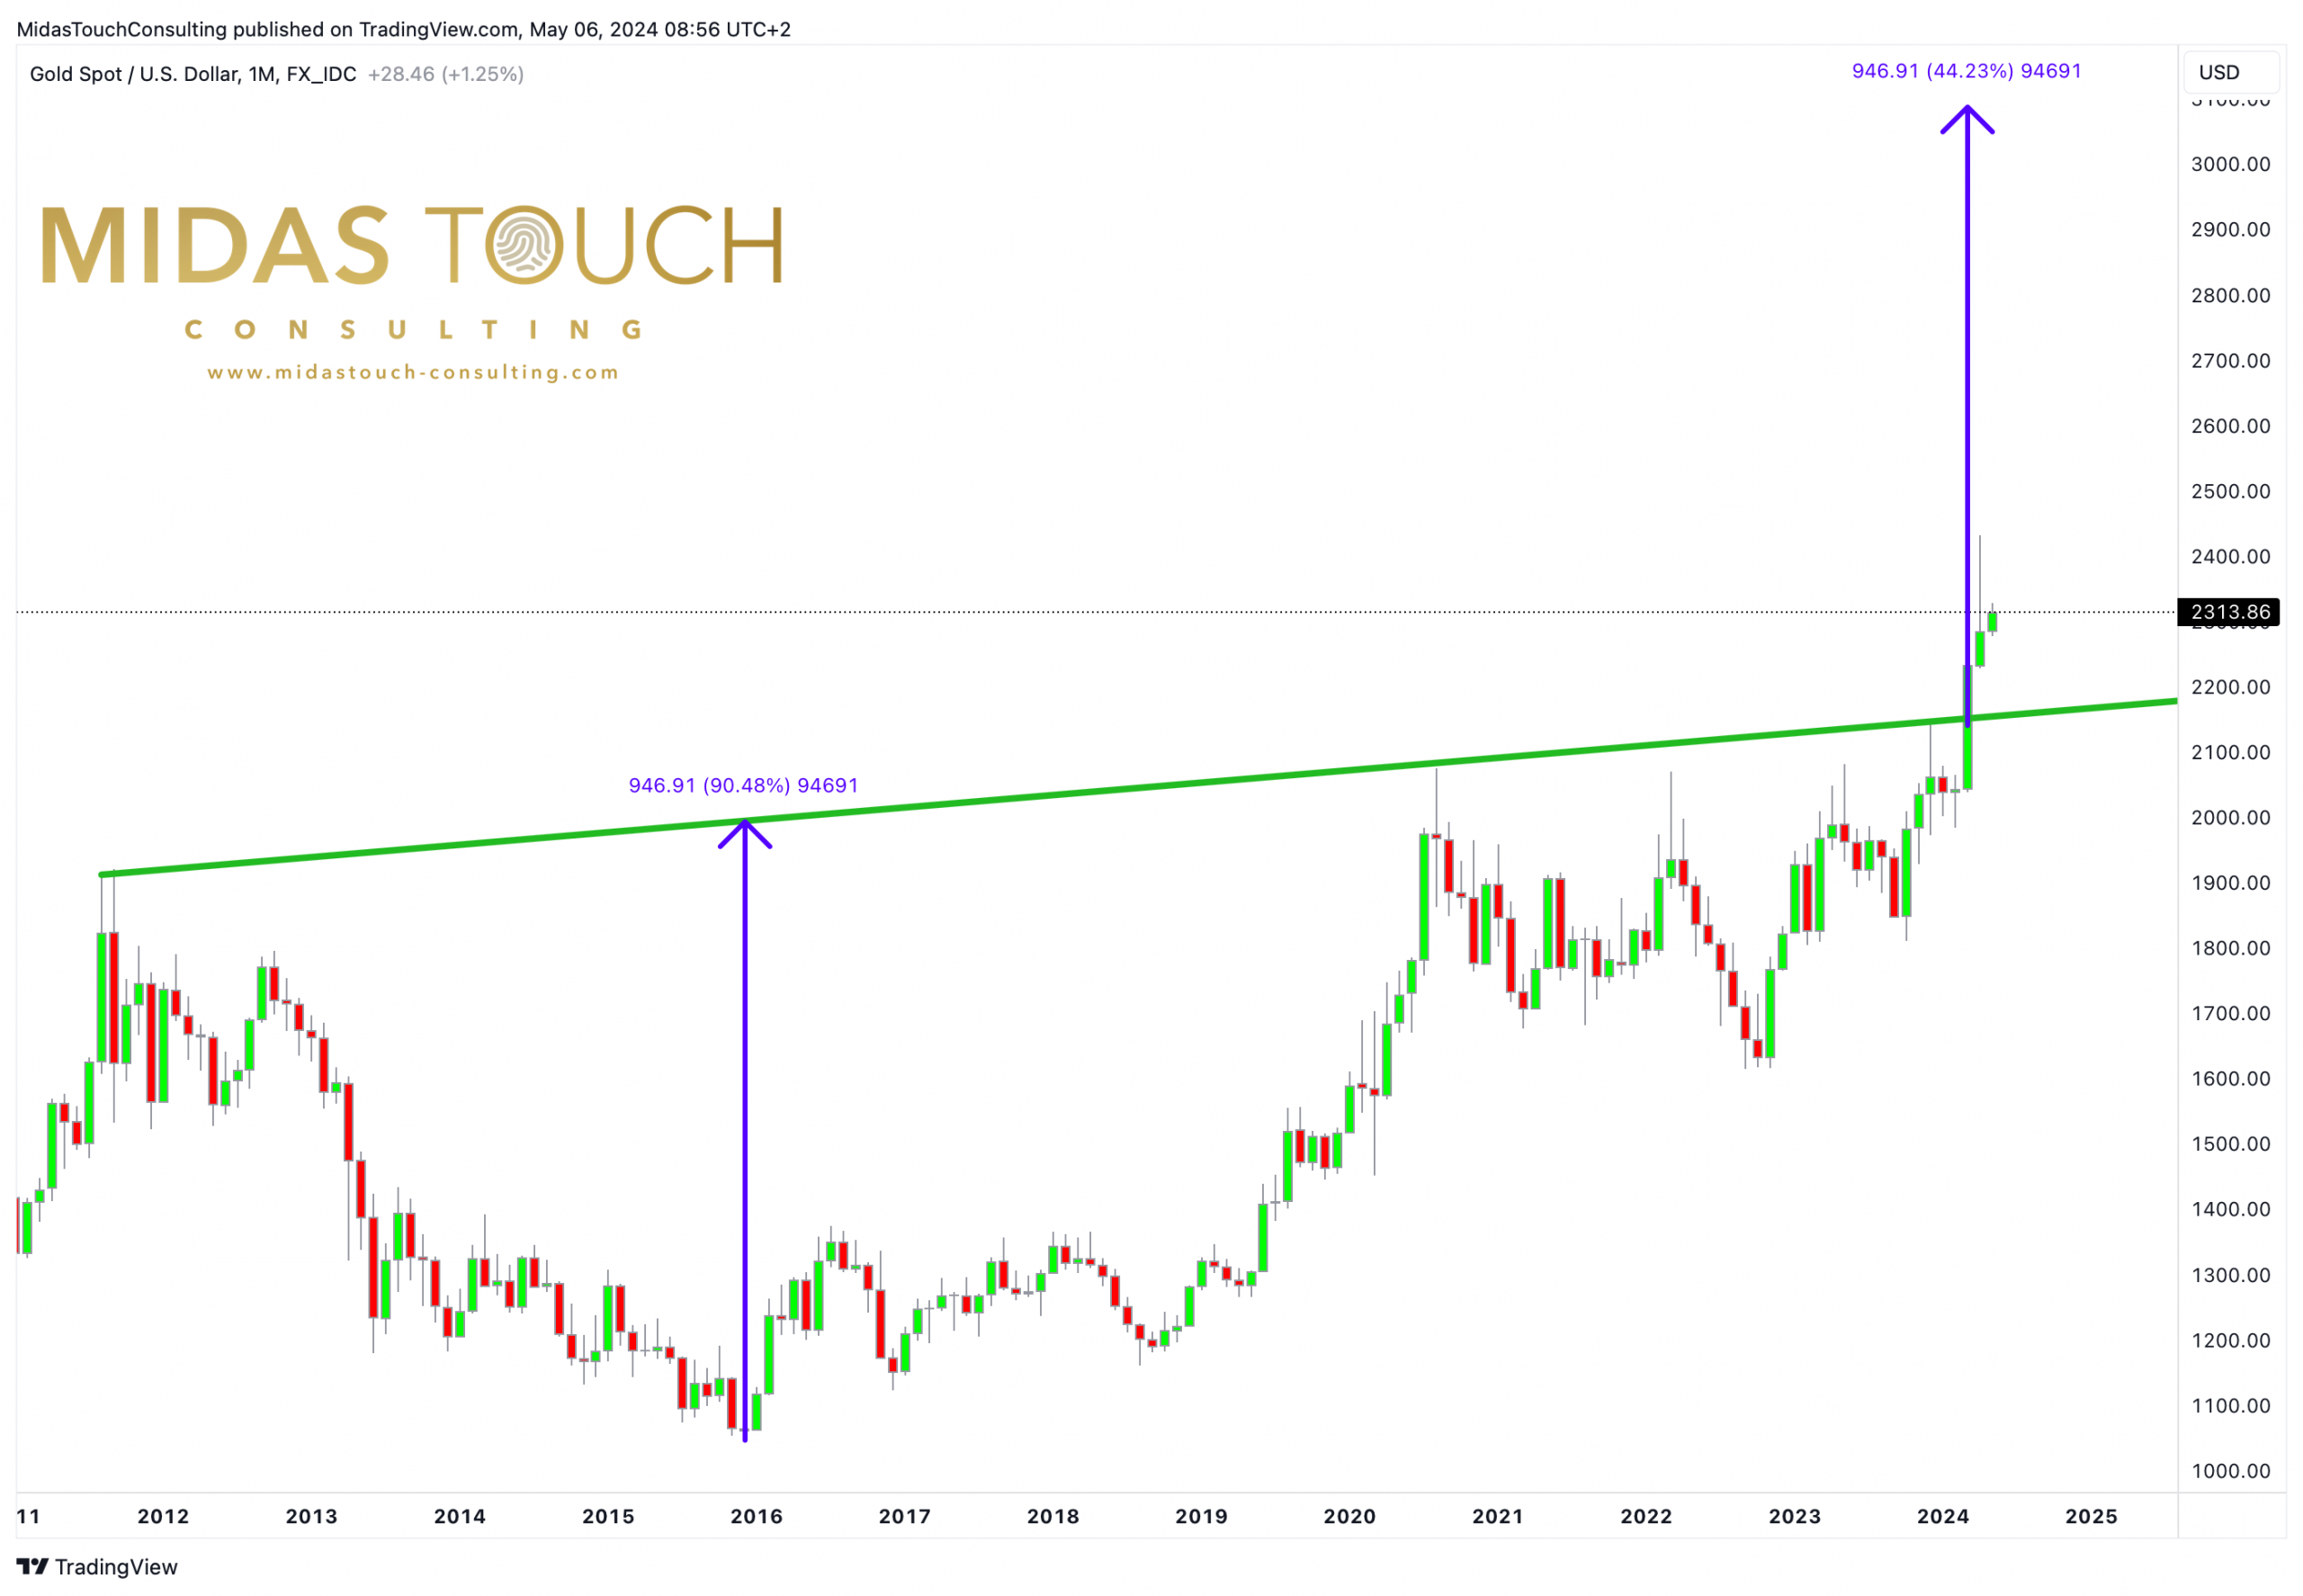 Gold in US-Dollars, cup-and-handle monthly chart as of May 6th, 2024. Source: Tradingview
Overall, a look at the monthly chart makes it clear that the major correction or consolidation, which began with the all-time high at USD 1,920 in late summer 2011, has finally ended after thirteen and a half years! With the breakout above USD 2,075, the frequently mentioned cup-and-handle formation was perfectly completed and resolved to the upside. While cup-and-handle chart patterns are extremely rare, they are also among the most reliable bullish continuation patterns. Therefore, a new chapter has now been opened in the gold market, directly related to the bull market from 2001 to 2011 and its continuation!
Our first price target at around USD 2,535, derived from the inverted head and shoulders formation within the handle, has so far been missed by nearly USD 100. Nevertheless, the formation has served its purpose and is likely more or less fulfilled by now. From the depth of the cup, an overarching long-term price target can also be derived in the range of around USD 3,100. After completing the ongoing correction, we expect the gold price to reach both price targets over the next one to two years.
Midas Touch Gold Model™
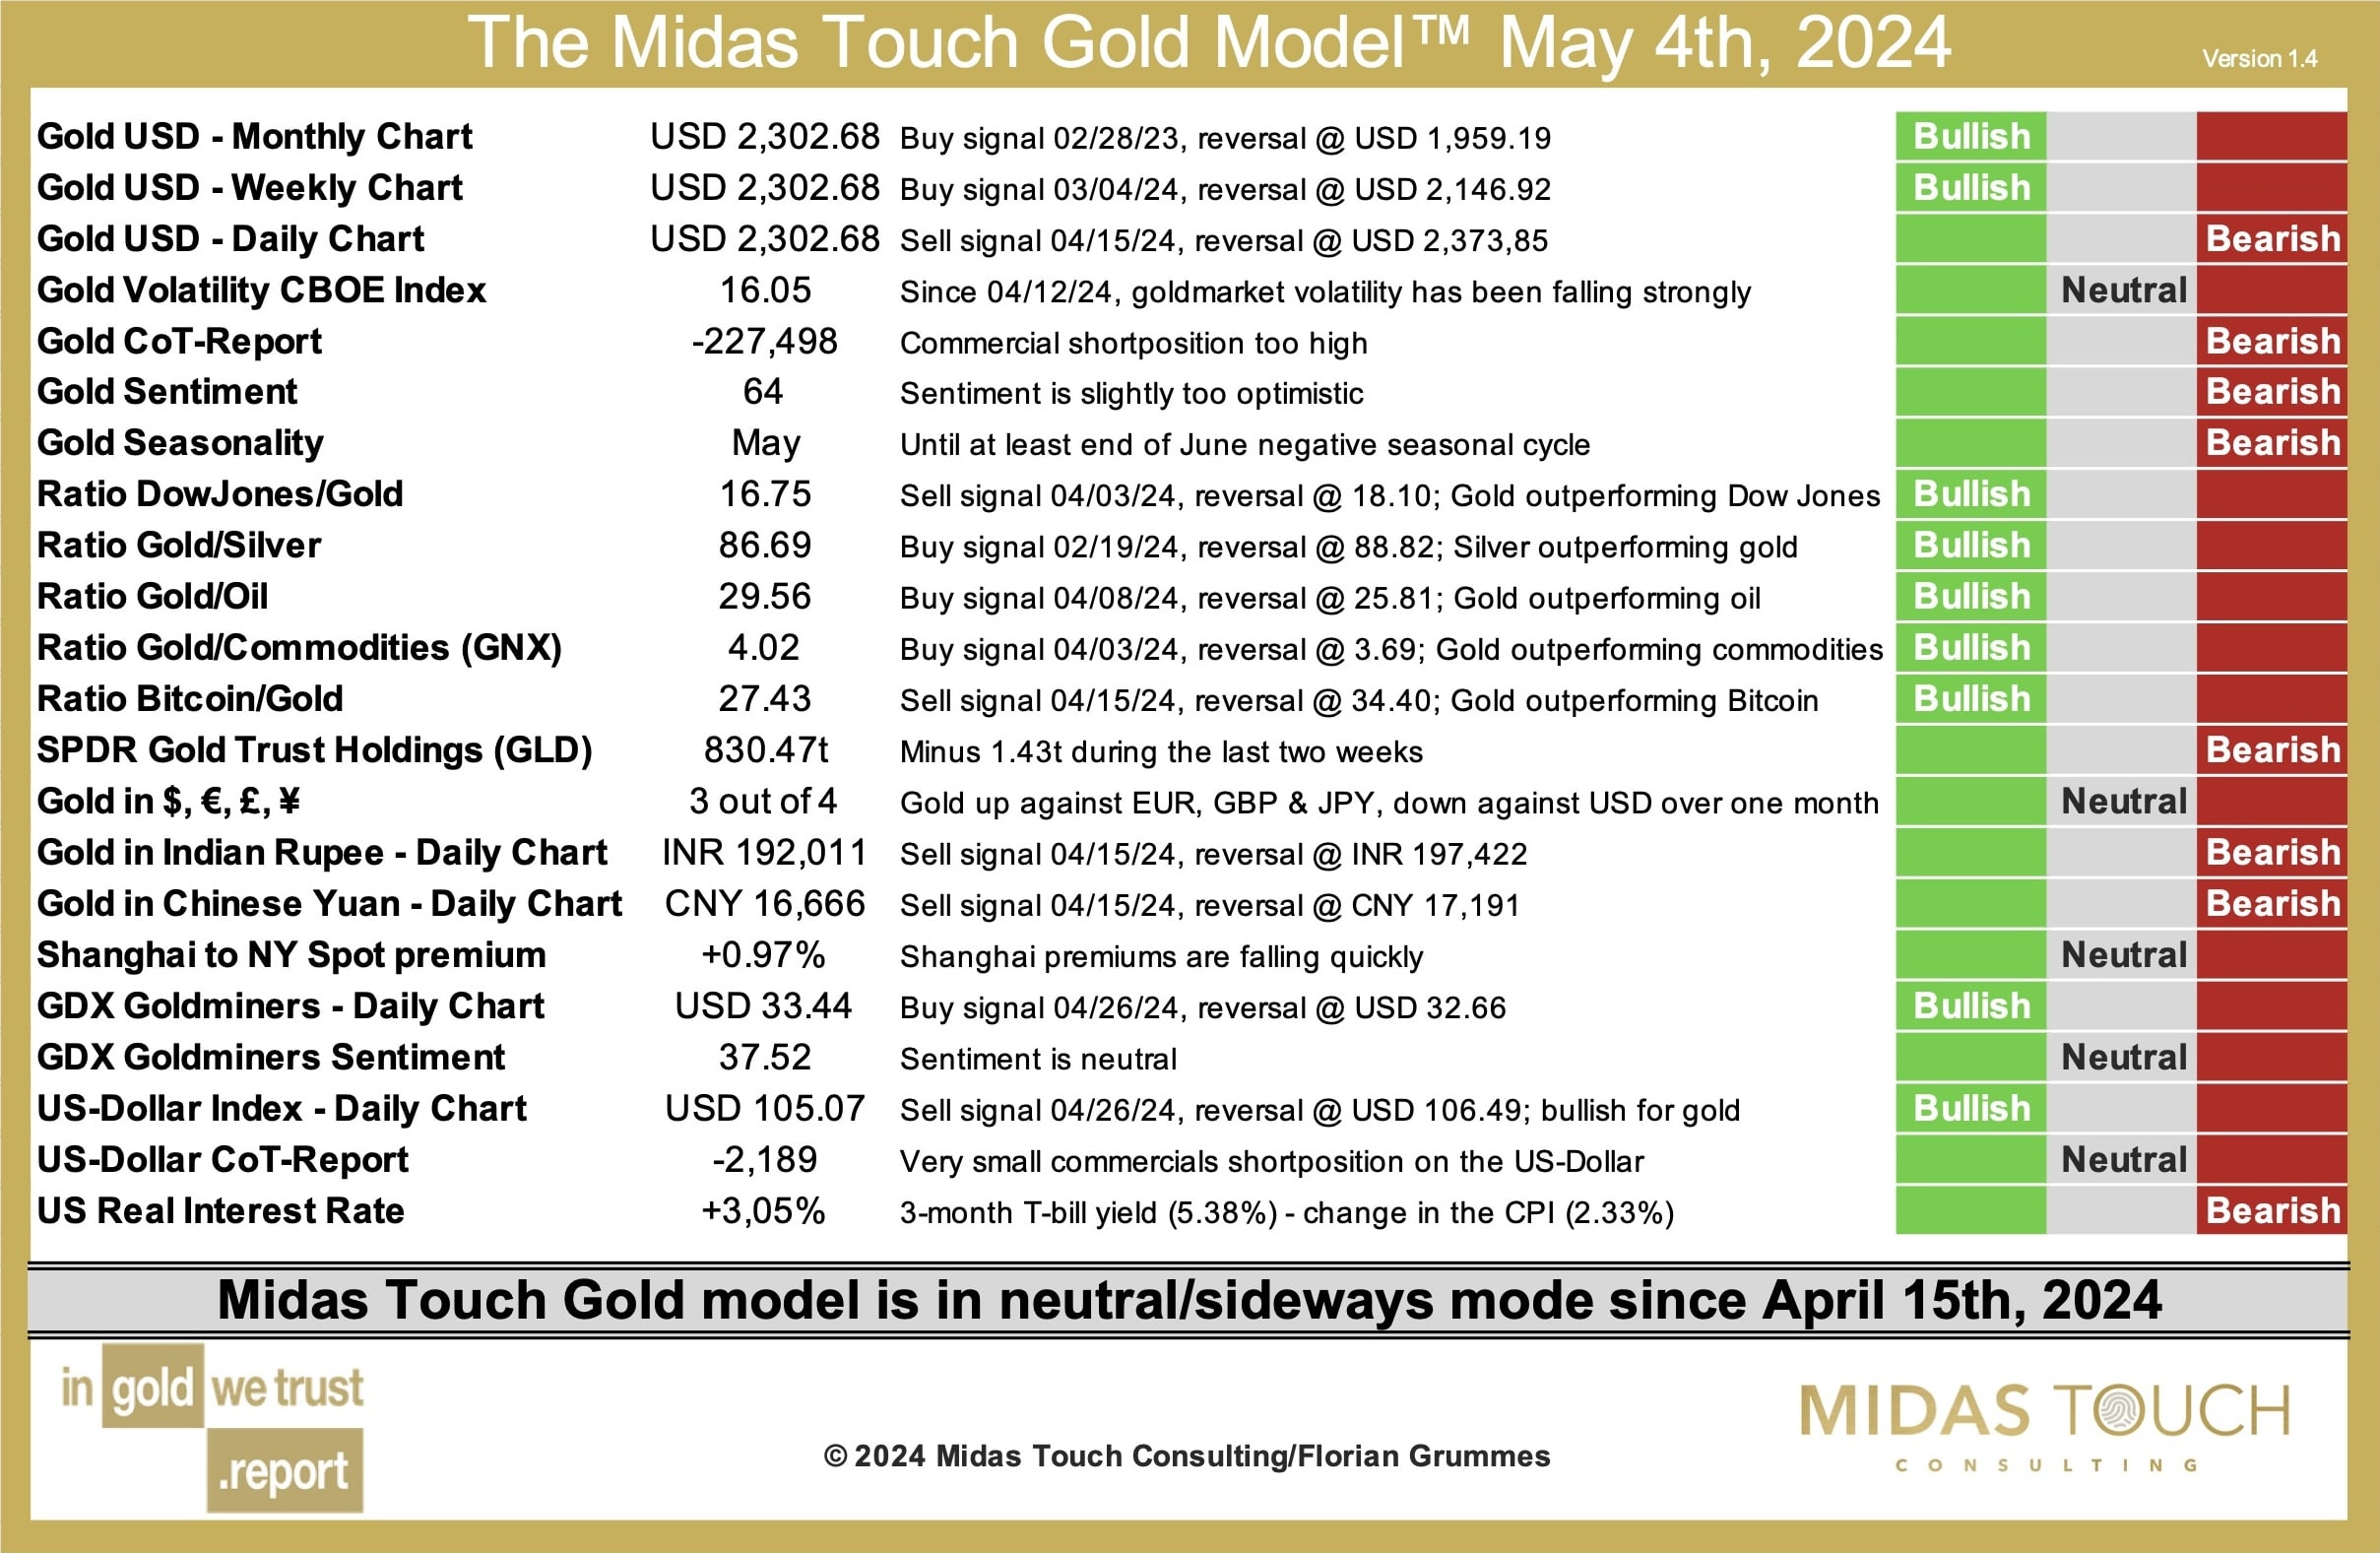
The Midas Touch Gold Model™ as of May 4th, 2024. Source: Midas Touch Consulting
The Midas Touch Gold Model™ switched from bullish to neutral on April 15th, 2024, detecting the trend reversal in the gold market extremely promptly. Particularly, the sell signals on the daily charts for gold in US dollars, Indian rupees, and Chinese yuan on April 15th, 2024, marked the end of the bullish conclusion. This was further reinforced by the seasonal component, which is now clearly negative for the gold price until mid-summer.
Overall, the following conclusions can currently be drawn from the Midas Touch Gold Model™:
- Both the monthly and weekly charts still have active buy signals. Especially the buy signal on the monthly chart remains robust and currently only turns at USD 1,959.19. However, the buy signal on the weekly chart could flip during a multi-week correction. Currently, this would only occur if gold prices would reach USD 2,146.92. However, this threshold on the weekly chart increases by over USD 30 per week! Thus, in about three weeks, a price decline to around USD 2,240 would be enough to turn the weekly chart bearish.
- The Commitment of Traders report (CoT report) has hardly changed over the past 12 months. A year ago, with gold trading at USD 2,011, we recorded a cumulative commercial short position of 222,515 contracts. Currently, this short position amounts to 227,498 contracts, despite gold prices being around USD 300 higher. This confirms our departure from the detective observation of the CoT report because prices are now made in Asia. Western paper jugglers, on the other hand, have lost significant influence on the price discovery. Not surprisingly, in recent months, numerous representatives of Western bullion banks have approached the CEO of the Shanghai Gold Exchange.
- Seasonality clearly calls for caution, restraint, and above all, patience. Statistically, the precious metals sector does not enter a favorable phase until July. The month of June, in particular, is traditionally an extremely weak month for the gold price.
- It is astonishing that the spectacular rally has not led to completely exaggerated euphoria among gold investors so far. Rather, especially in March, it seemed as if the breakout in the gold market was not even noticed by most market participants due to the strong performance of stock markets and Bitcoin. However, with a current value of 64, the Gold Optix is clearly too optimistic.
- Also somewhat atypical is the behavior of the gold price against stock markets. Although the model issued a buy signal for gold against the Dow Jones on April 3rd, more than a sideways movement has not yet materialized.
- The performance of silver was quite disappointing. Despite breaking out of its three-and-a-half-year consolidation triangle, it only managed to briefly spike to USD 29.73. The typical final sprint on the home stretch of every precious metal rally did not really occur this time. Although the Gold/Silver Ratio has activated a buy signal in favor of the silver price, it is not far from a reversal signal.
- The weak demand for gold ETFs is also surprising. Unlike in the past, the gold ETFs were not the driver of the gold price rally since last October. Instead, the price increase was fueled by physical demand from institutional and private buyers from Asia. The holdings of the largest gold ETF, GLD, have even decreased by 35.38 metric tons in the last six and a half months!
- Mining stocks also fall into the list of disappointments. Although the mining ETF GDX temporarily increased by 39.25% from the end of February, the overall performance is extremely weak considering the high gold price. While the gold price is currently about 20% above its high from the summer of 2011, the GDX trades at a discount of 47% to its former all-time high from 2011. Therefore, we anticipate a significant catch-up opportunity in mining stocks in the medium term and see only limited downside potential despite a possible correction in the gold market.
- Currently, the behavior of the US dollar does not quite fit our correction scenario. A new sell signal for the greenback occurred on April 26th. While the slightly stronger US dollar in the last three months did not counteract the strong rise in gold, a weaker US dollar could likely cushion the anticipated correction in the gold market.
Gold – Short- to midterm Outlook
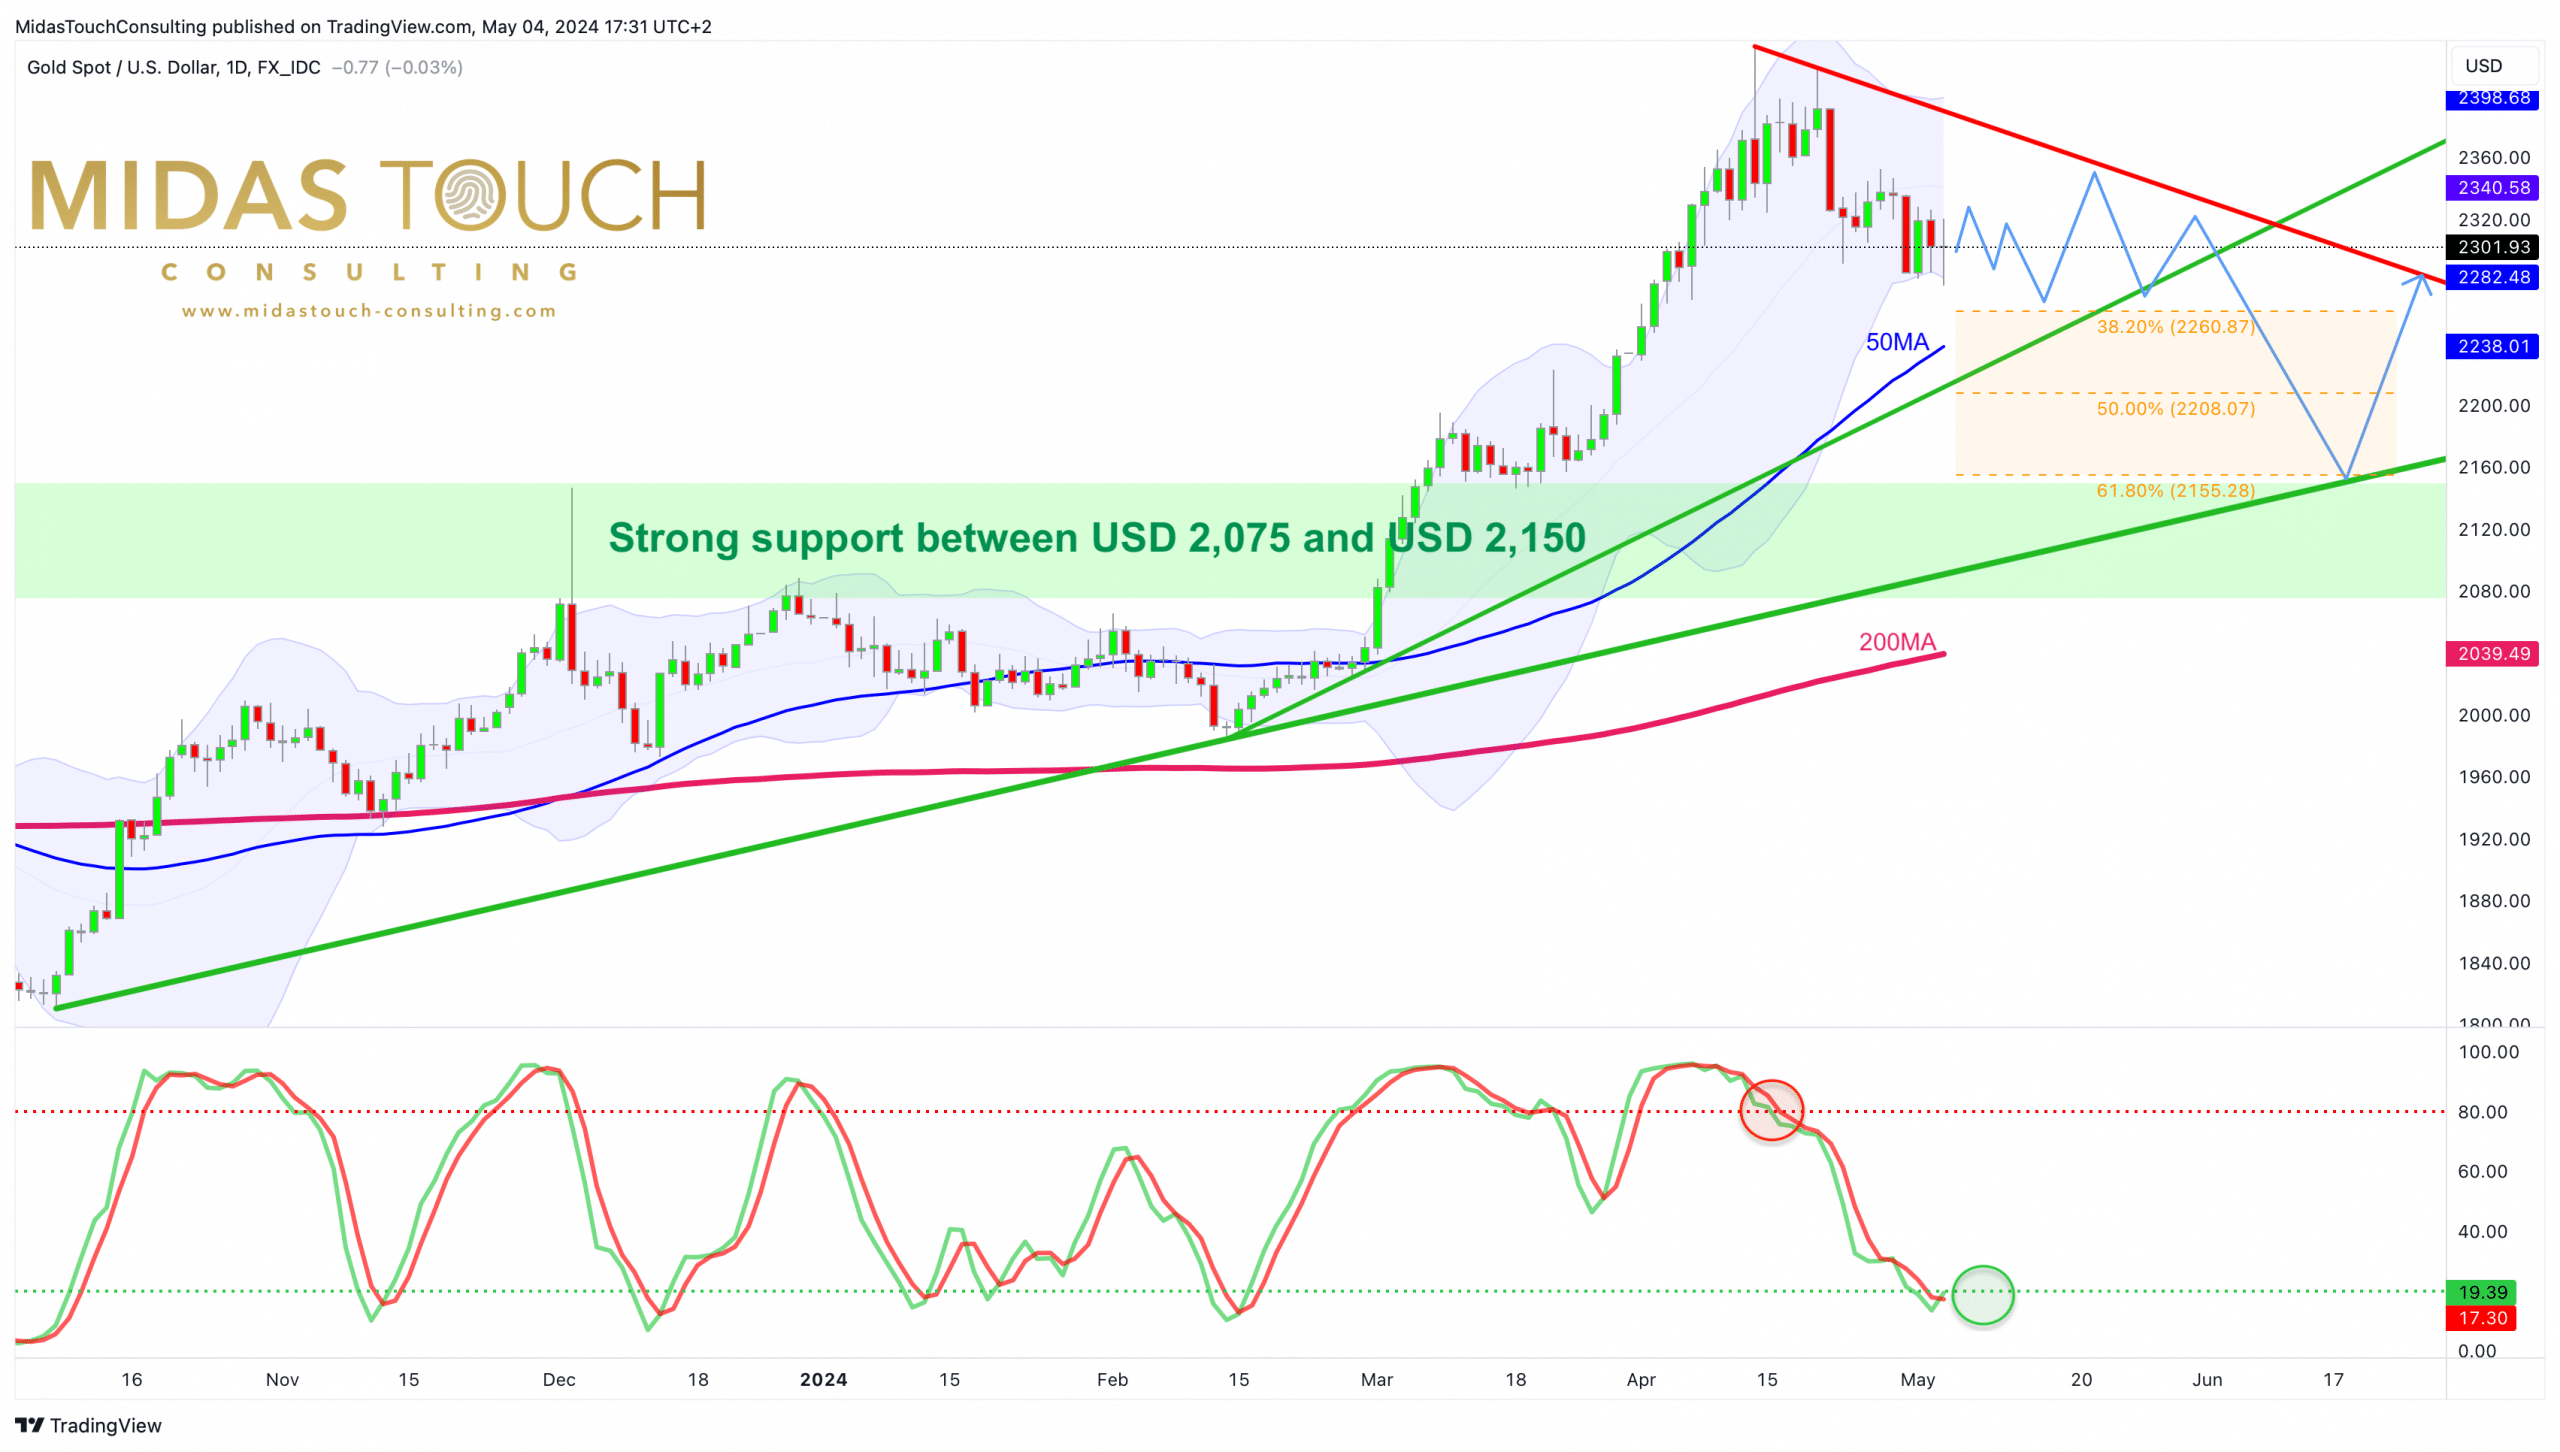 Gold in US-Dollars, daily chart as of May 4th, 2024. Source: Tradingview
The gold price on the daily chart is now approximately USD 130 below its new all-time high of USD 2,431 achieved on April 12th. The pullback reached a peak of USD 154 (-6.3%) over the past three weeks, which is relatively moderate so far. Nevertheless, many factors suggest the beginning of a correction in the gold market.
In the past, any pullbacks following a breakout rally have always retraced back to the breakout level. Currently, this zone appears to be quite distant, ranging between approximately USD 2,075 and USD 2,150. However, a dark red seasonal timeframe awaits gold bulls in June. If strong gold purchases from Asia were to temporarily cease, demand in the West might not be sufficient to stabilize the gold price. The lack of interest has repeatedly made life difficult for the spoiled German gold dealers in the past year, for example. Instead of buying, many gold investors had to sell physical positions due to the recessionary real economy to generate much-needed liquidity.
From a technical perspective, the significant distance to the rising 200-day moving average (USD 2,037) suggests a need for more correction, too. However, as long as the support around USD 2,280 can be defended on a weekly closing basis, the significantly oversold condition on the daily chart could trigger a larger recovery at any time. Nevertheless, the picture brightens significantly only above USD 2,380. Then, new all-time highs would also be conceivable. However, given the timid and powerless behavior of gold bulls in the past two weeks, this bullish scenario seems rather unlikely to us.
Seasonality is not favorable for gold
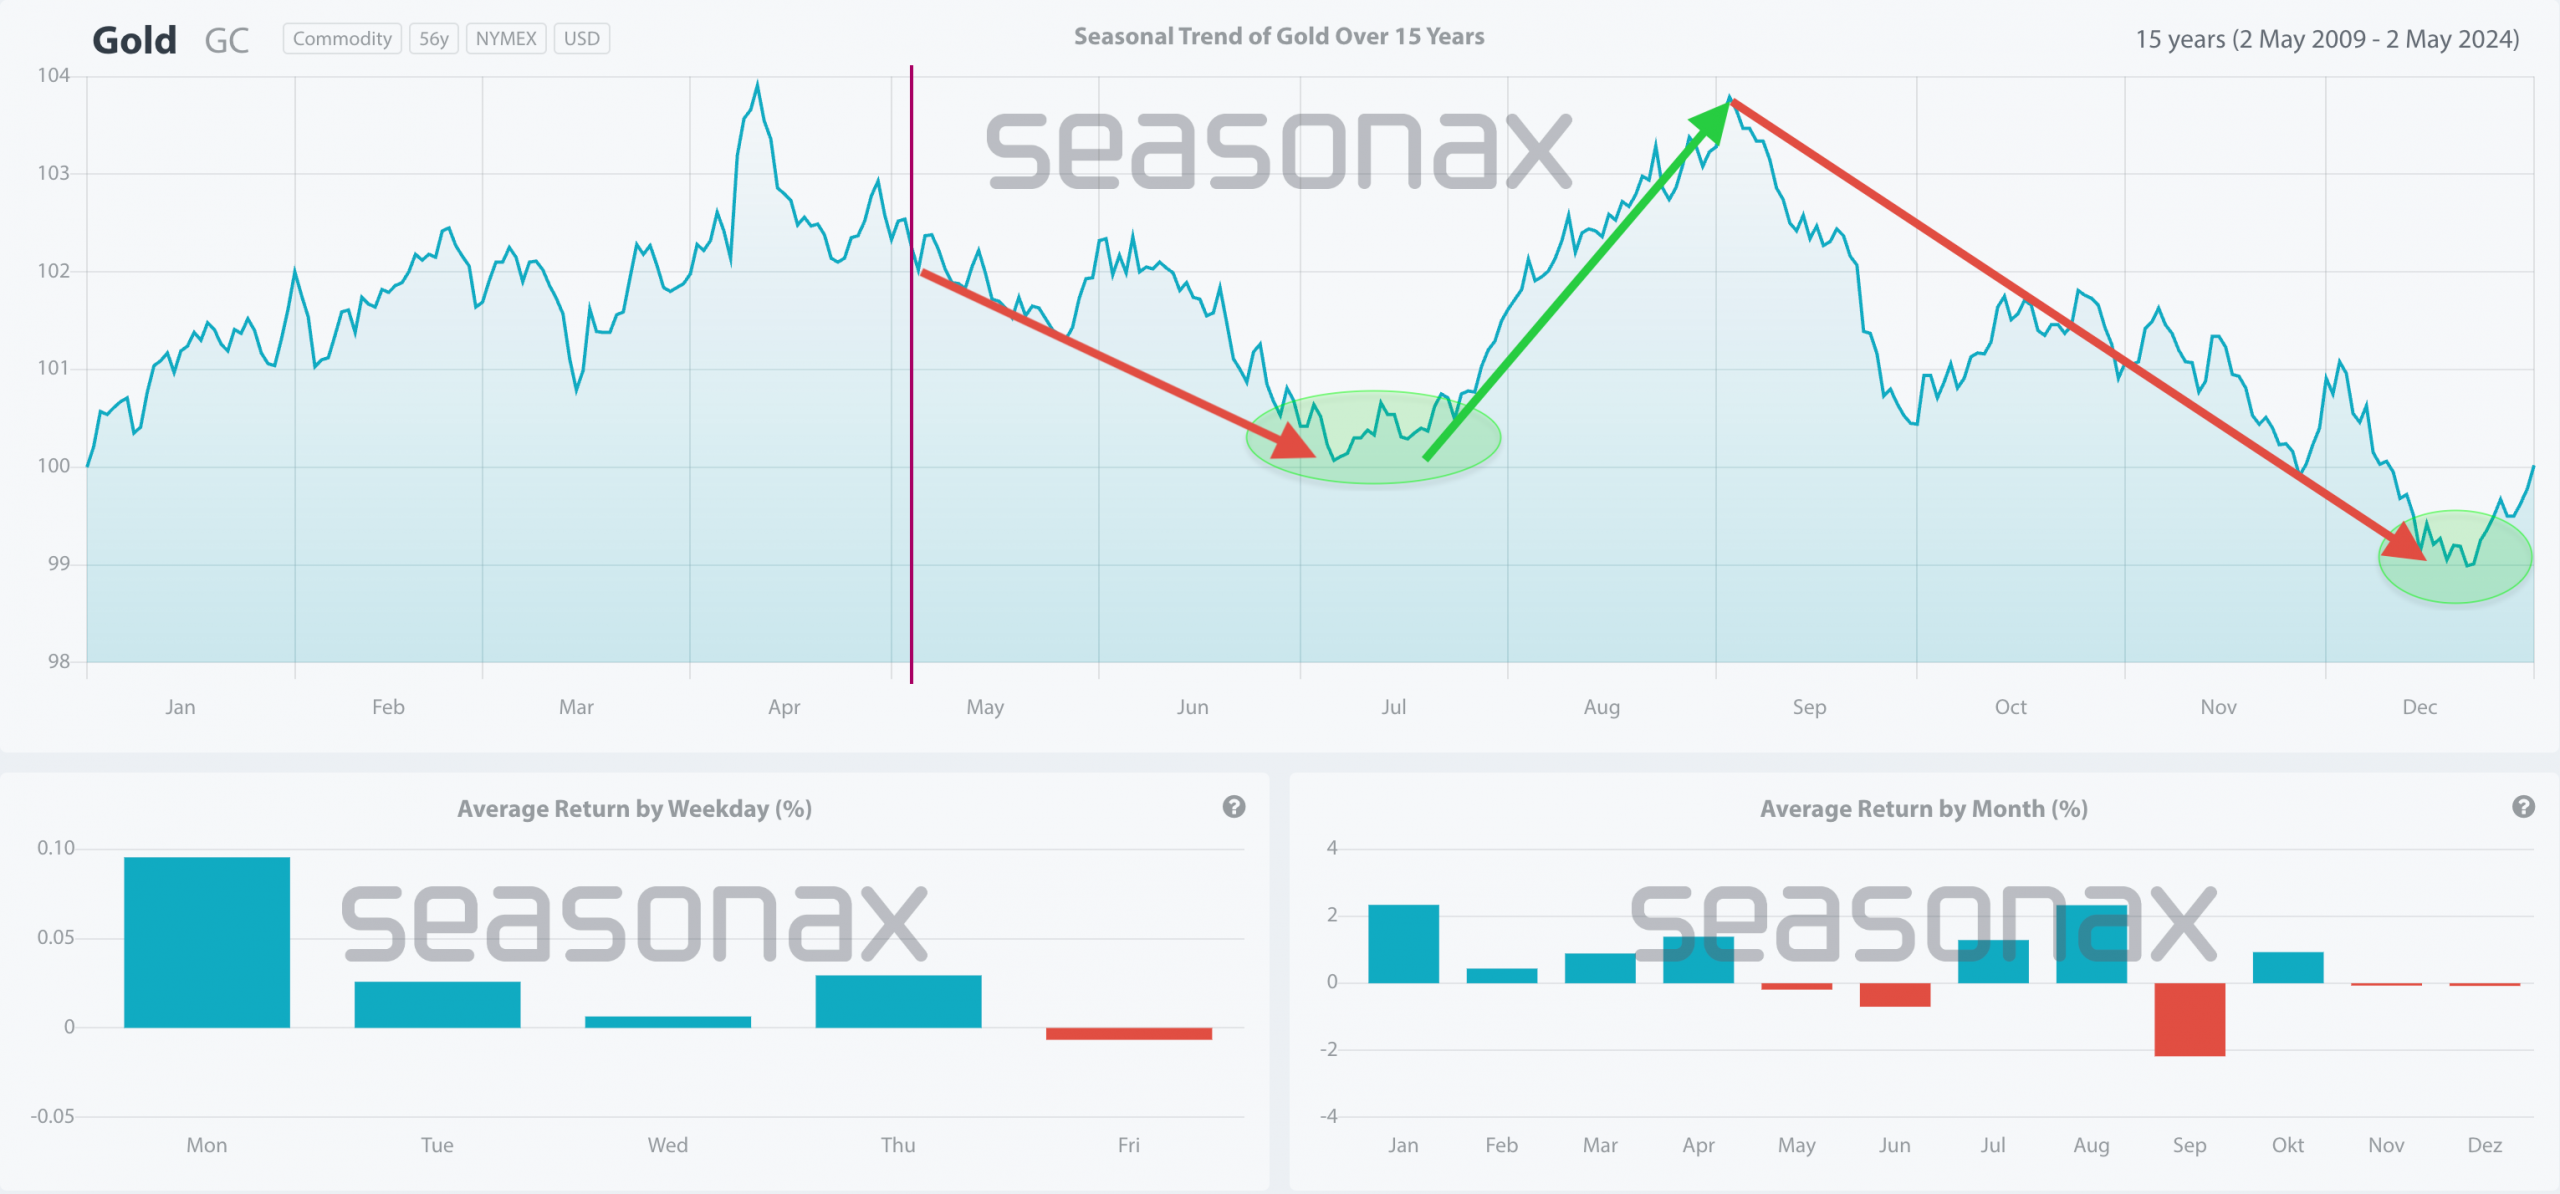 Gold seasonality over the last 15 years, as of May 3rd, 2024. Source: Seasonax
In doubt, we expect a sideways consolidation around USD 2,300 to continue in May. Before mid-summer, however, gold typically transitions into a sell-off, which should find a bottom around mid-July. Subsequently, a small summer rally can be expected. However, the seasonal component is only truly favorable to the gold market again from mid-December onwards!
Conclusion: Sell in May and go away!
Patience is required when practicing patience. – German Proverb
Overall, we approach the next few months with caution and patience according to the old stock market adage “Sell in May”. The strong rallies in stock-markets and crypto seem not yet fully digested after a minor pullback. If more trouble arises here, the precious metals sector may not be able to escape it. At the same time, central bankers are always ready with new support measures, hence, further excesses on the upside within the ongoing crack-up boom are conceivable even during the weak summer months. However, a healthy breather and thus weaker prices until autumn seem more likely to us, which should then make the lagging mining stocks particularly interesting again.
This article is our contribution to the In Gold We Trust Report 2024. It was initially written in German on May 4th, 2024 and then translated into English and partially updated on May 6th, 2024.
Feel free to join us in our free Telegram channel for daily real time data and a great community. If you like to get regular updates on our gold model, precious metals and cryptocurrencies you can also subscribe to our free newsletter.
Disclosure: This article and the content are for informational purposes only and do not contain investment advice or recommendations. Every investment and trading move involves risk, and readers should conduct their own research when making a decision. The views, thoughts and opinions expressed here are the author’s alone. They do not necessarily reflect or represent the views and opinions of Midas Touch Consulting.

