Bitcoin – Two sides of a coin
In our previous chart book, we were pointing towards a moment of truth coming up, with a triangle formation on the daily time frame manifesting over time. We already posted various reload entries live in our Telegram channel. While most chartists prefer to trade confirmed signals, which would be in the scenario of a triangle a breakout, we rather anticipatory position ourselves on low risk. Triangles have three possible resolutions. When they are not loaded, prices simply move sideways. And like a coin with two sides, for a possibility to break upwards or downwards. Why we consider this scenario especially important is that both breaks are meaningful for the trader and investor alike. Bitcoin – Two sides of a coin.
What if we break to the long side?
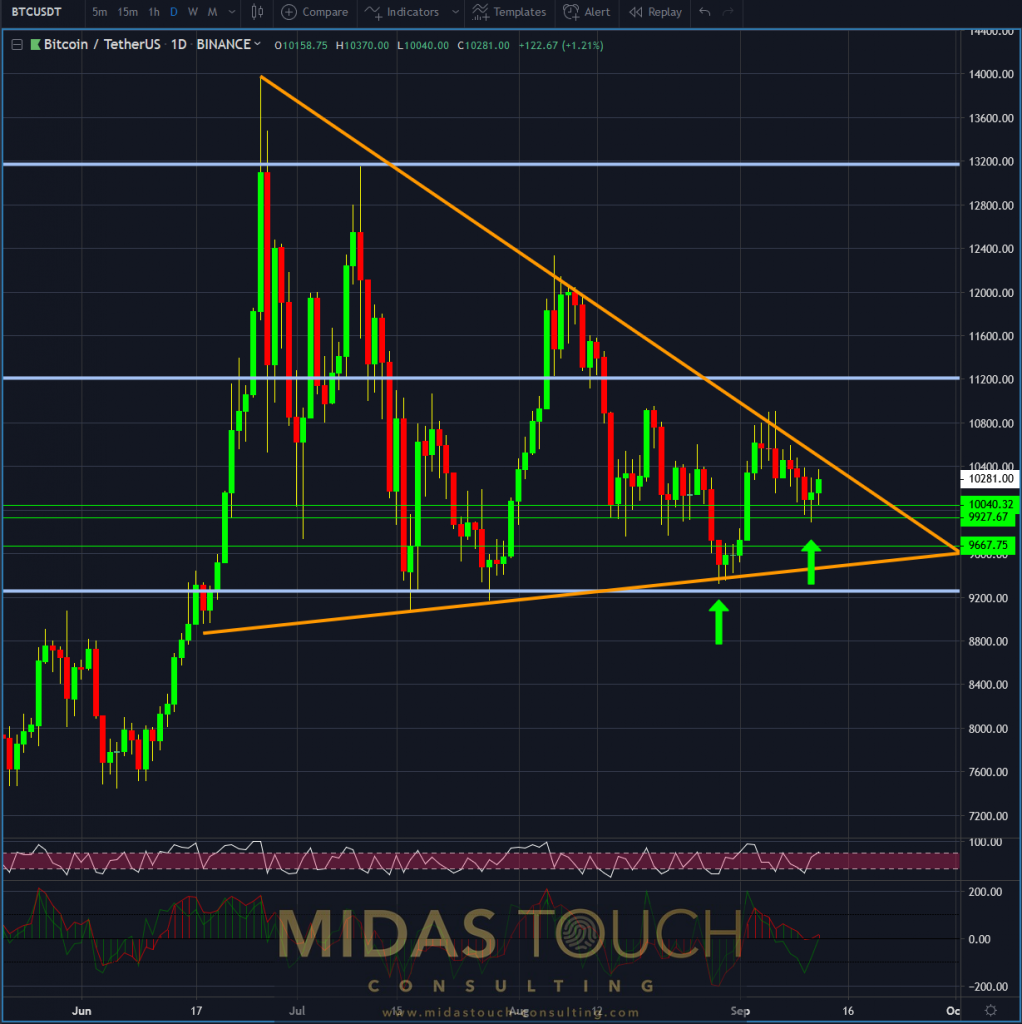
September 12th 2019, BTC/USDT, daily chart, perceived strength:

Bitcoin in TetherUS, daily chart as of September 12th 2019
On this daily chart we clearly see support in addition to last weeks support resistance analysis. The trading behavior over the last six daily sessions indicates only meager strength on the short side. Instead of swiftly trading towards the bottom triangle line, prices crept slowly near the midpoint. This might indicate a possible reversal already. The possibility of a triangle break resolve, earlier than the triangle itself forces it out, is one not to be missed! As such, we have reloaded to our core monthly long position on various time frames. With the intent to have a desired position size established prior to the anticipated triangle break to the upside. You can find the details by reviewing the recent history of our free Telegram channel.
What if we break to the short side?
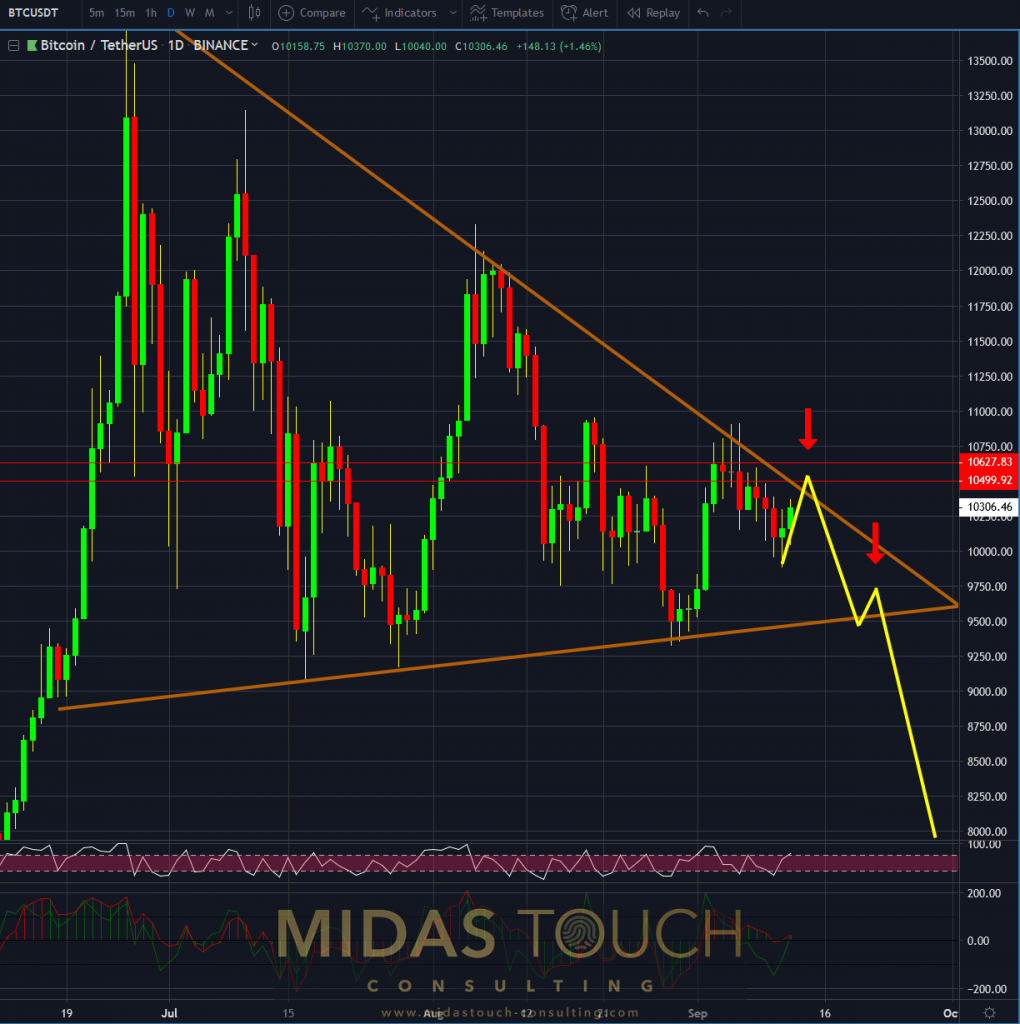
Bitcoin – two sides of a coin, BTC/USDT, daily chart September 12th 2019, “what if”:

Bitcoin in TetherUS, daily chart as of September 12th 2019 b
In case we break to the downside, there is a high likelihood of a volatile move. Massive support will be broken. Since the 10k price level represents a psychological anchor in the media, we might see swift price behavior and a large volume of stops being taken out.
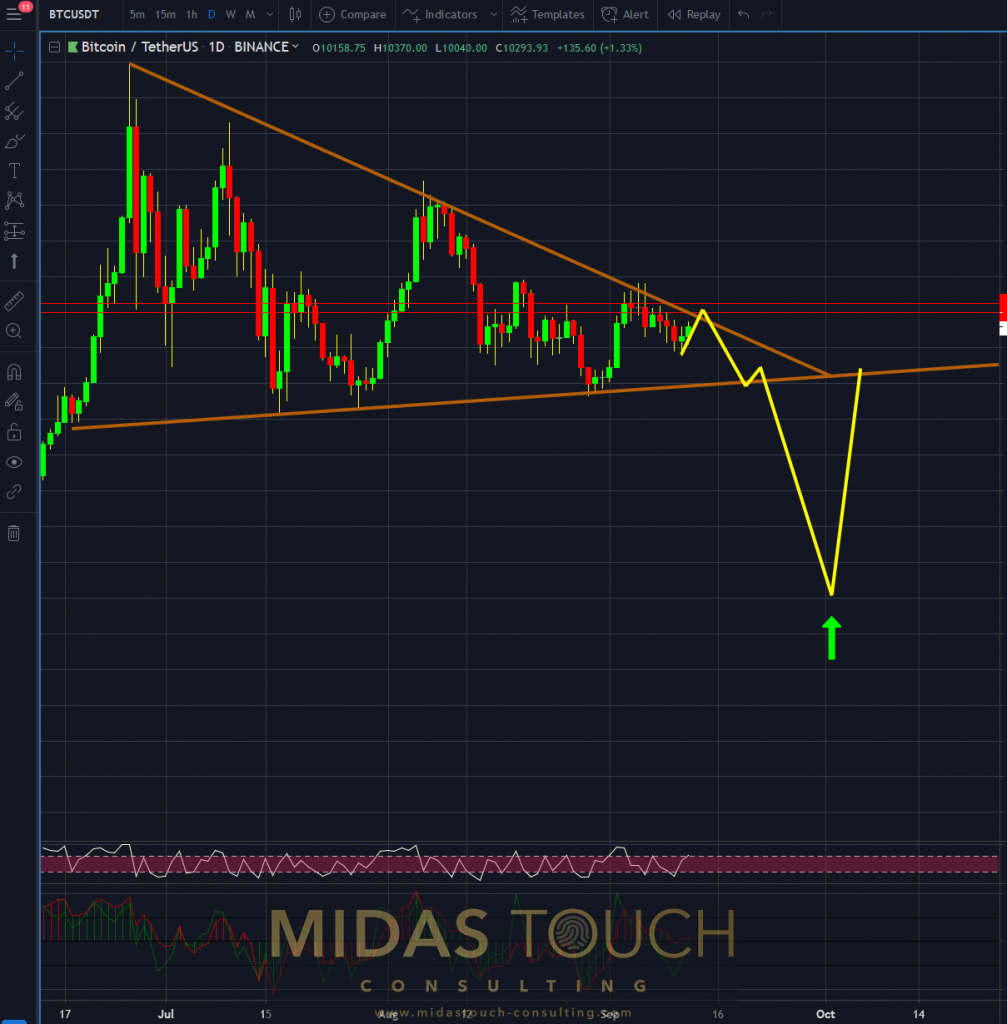
BTC/USDT, bitcoin – two sides of a coin, daily chart September 12th 2019, “action, reaction”:

Bitcoin in TetherUS, daily chart as of September 12th 2019 c
This increase in volatility and the demand for institutional bitcoin purchase, could lead to what we call a “V” turning point. This type of turning point is less precise in support resistance zones. That is why we removed the price scale in the chart above! It is also hard to enter into the market, since larger than usual stops are possibly needed and since waiting for a retracement is futile, they simply do not appear.
Especially the breakout to the downside of the triangle and its consequential reversal long “V” play needs preparation. Rehearsing possible scenarios in ones mind and having a well prepped plan in mind on how to act, is a necessary traders routine. In case of ones anticipated scenario matching up with the markets price behavior, a well rehearsed routine of execution should be set in motion. This undeterred by emotions that price movement might evoke in a traders mind. With this week’s chart-book “Bitcoin – Two sides of a coin” you should be prepared for the triangle resolution!
All charts timely posted in our telegram channel.
If you like to get regular updates on our gold model, precious metals and cryptocurrencies you can subscribe to our free newsletter.


