THE MIDAS TOUCH GOLD MODEL™
Become more successful with a rational & systematic approach to the gold market
Gold, likely the most emotional asset in the world
Opinions are strongly divided upon the gold market – one of the most difficult and nontransparent markets in the world. Although, in the past six years many fundamental reasons should have led to a rising gold price, the precious metal itself lost more than 45% (calculated in US-Dollar) from the top in 2011 down to the low in December 2015.
While on the one hand some gold bugs suspect a conspiracy theory behind each price slide and expect the direct demise of the Western World, the mainstream and society on the other hand deny the numerous advantages that gold investments have and want to write it off as a relic of a bygone era. The truth lies somewhere in the middle of these two extreme views.
Gold survived them all
The fact remains that Gold is an extremely emotional subject. Millions of people have been victims of its magical attraction. Just think of the extermination of the Incas by the Spanish. The belief in Gold is deeply rooted in our subconsciousness and has been conditioned for over five thousand years. From a rational perspective, it is only a rare metal whose price is defined in an almost 24-hour trading day by the world wide financial markets.
But in times of hot running printing presses and an unprecedented instability in the system, an investor can not afford to ignore the asset class “precious metals”. After all mankind´s history is full of currency collapses and disasters, yet gold has survived them all. However, one should not be guided by emotions, but act based on a method that gives clear and simple signals.
All important perspectives & indicators in our model

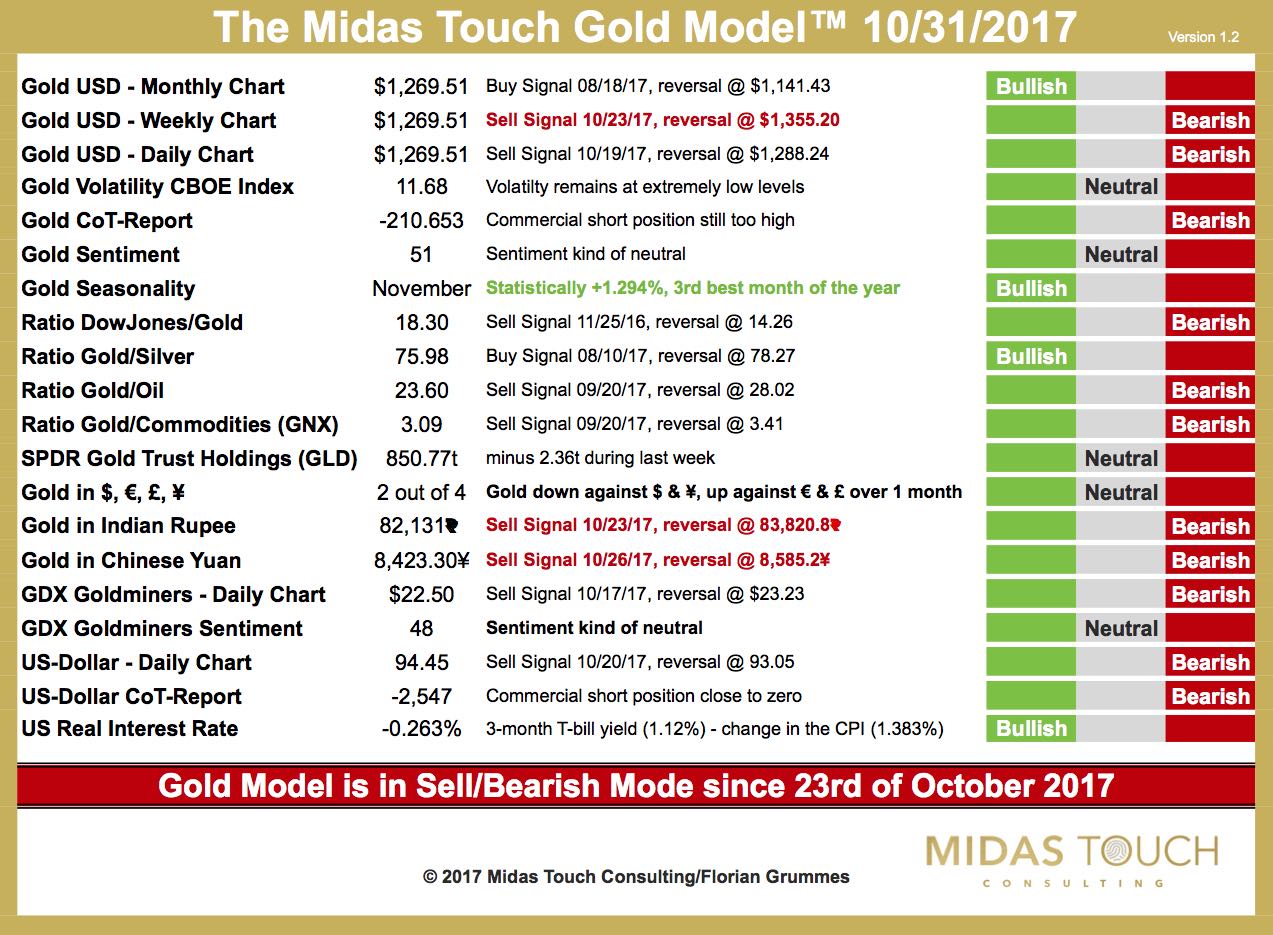
Our Midas Touch Gold Model takes a holistic and three dimensional approach.
The aim is to analyze the gold market from many different and independent perspectives to come up with a rational and simple, short- to medium-term signal.
Although the model is based on a lot of underlying data, this systematic approach helps to create a compact and comprehensive analysis which contains the best technical, fundamental and sentiment signals we know of.
Top Down Approach
The first component, a trend-following indicator on the monthly gold chart, has delivered a sell signal back in December 2011 and has stayed bearish for nearly four years in a row. Many traders and investors could have saved themselves from a lot of pain and drama just by using this simple indicator.
With the weekly and daily chart, the model zooms deeper into the short-term price developments. After that a simple signal based on volatility is included. Generally an increasing volatility occurs in downtrends while uptrends are usually accompanied by low or falling volatility.
With the Commitment of Trades Report and the sentiment numbers two countercyclical (“contrarian”) signals are following. While the professionals currently see only little need for hedging, the mood in the Gold market can only be described as “excessive pessimism”.

Ratios to understand the bigger picture
Next, the model contains a series of highly interesting ratios. Besides the classic DowJones/gold ratio and the well-known gold/silver ratio, we are interested to find out how gold is acting against oil and against other commodities.
If gold can clearly outperformed other commodities, we presume that the “Safe Haven” function of Gold is activated. In that case, steep and irrational rallies are often observed. To represent the physical investment demand the model analyses the reported inventories changes in the largest and most important gold ETF, the SPDR Gold Shares (GLD).
The multipolar world of gold
Furthermore, the model provides two trend-following signals depending on the price development in Chinese Renminbi and Indian Rupee. China and India now account for more than 50% of the world’s physical gold demand and therefore have an increasing influence on the price.
Of course the Gold mining stocks can not be missed in any serious analysis. To close this gap a technical trend following signal comes from the well-established Goldminers ETF “GDX”. As well the model includes the sentiment numbers for the mining stocks. Often, the miners run ahead of the gold price (particularly at important turning points). Finally the model observes the technical situation in the US-Dollar and tracks the Commitment of Trades for the US-Dollar and the real interest rates in the United States.
Conclusion
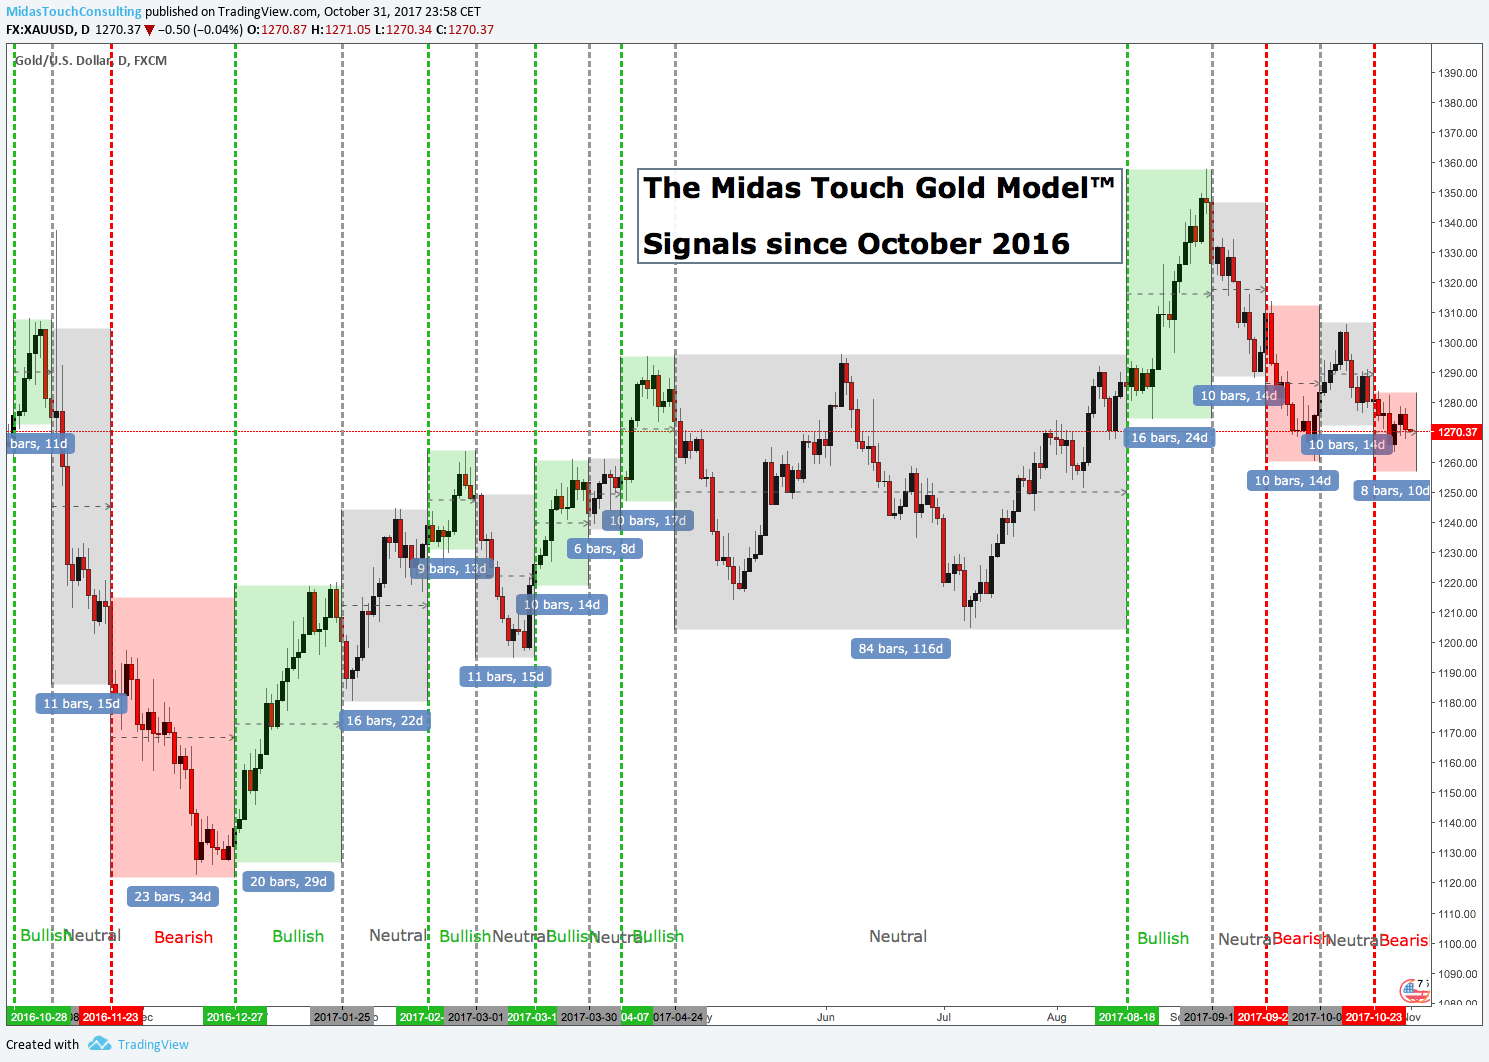
Overall the model has done an excellent service. It has been bearish during most of 2015 and helped to avoid the bear market that was still going on back then. In 2016 the model called most of the trend changes while 2017 has been a bit more challenging. The trend-less and low-volatile market environment created lots of neutral signals and made it difficult to catch all the movements from their beginning. Yet you would have caught most of the upside while the model would have taken you out before any meaningful corrective wave.
Therefore we are very sure that investors and traders should be able to benefit from our Midas Touch Gold Model and its rational approach in the unfolding and always exciting gold and precious metals markets.


