


Strong reversal should lead to another leg up
We have been bullish on gold since mid of December. Back then it was primarily the oversold setup coupled with a beaten down sentiment and a positive seasonal pattern, which led us to anticipate a recovery for the next two months. In the meantime, however, things have come to a head on many different fronts. After the unrest in Kazakhstan, inflation numbers soaring to a 40-year high, a more and more hawkish FED as well as seizures in Canada without court orders, the last few days are dominated by the Russian invasion of Ukraine. On the day of the attack, gold spiked sharply higher only to end the day lower. Friday saw gold dropping further. Gold – Strong reversal should lead to another leg up.
Looking back, gold has been rising nearly US$225 since December 15th, 2021, and US$195 since 28th of January 2022. Especially the strong rally over the last four weeks caught many by surprise. But our price target of US$1,975 was hit exactly last Thursday, when all other markets plunged in anticipation of strong sanctions against Russia. Markets then strongly recovered on Friday on hopes of weak sanctions and a potential postponement of the rate hikes by the FED. Over the weekend, however, NATO and its partners announced SWIFT sanctions against Russia. Monday will therefore likely be another wild and volatile day in the markets. But “peak fear” has probably been reached last Thursday (at least for now).
Give peace a chance 🕊️🇷🇺🕊️🇺🇦🕊️
Fundamentally, banning Russian banks from SWIFT payments will lead to Russia stop selling oil & natural gas. Russian oil represents about 9% of global output and there’s an energy shortage already. The result will be a global depression and more inflation at the same time. And that would be the best-case scenario, cause as quickly as things unfold, WWIII is no longer an unthinkable horror scenario. We can only hope that successful peace negotiations will take place as soon as possible.
In these uncertain times, gold should remain supported. As geopolitical events unfold, another sharp spike higher is always possible. A direct transition back into the correction, which began in August 2020, is unlikely. It would rather take much more time (at least a few months), before gold could drift back towards significantly lower grounds. Our maximum downside remains at US$1,625 for the potential 8-year cycle low, due in 2023 or 2024.
Gold in US-Dollar, weekly chart as of February 27th, 2022.
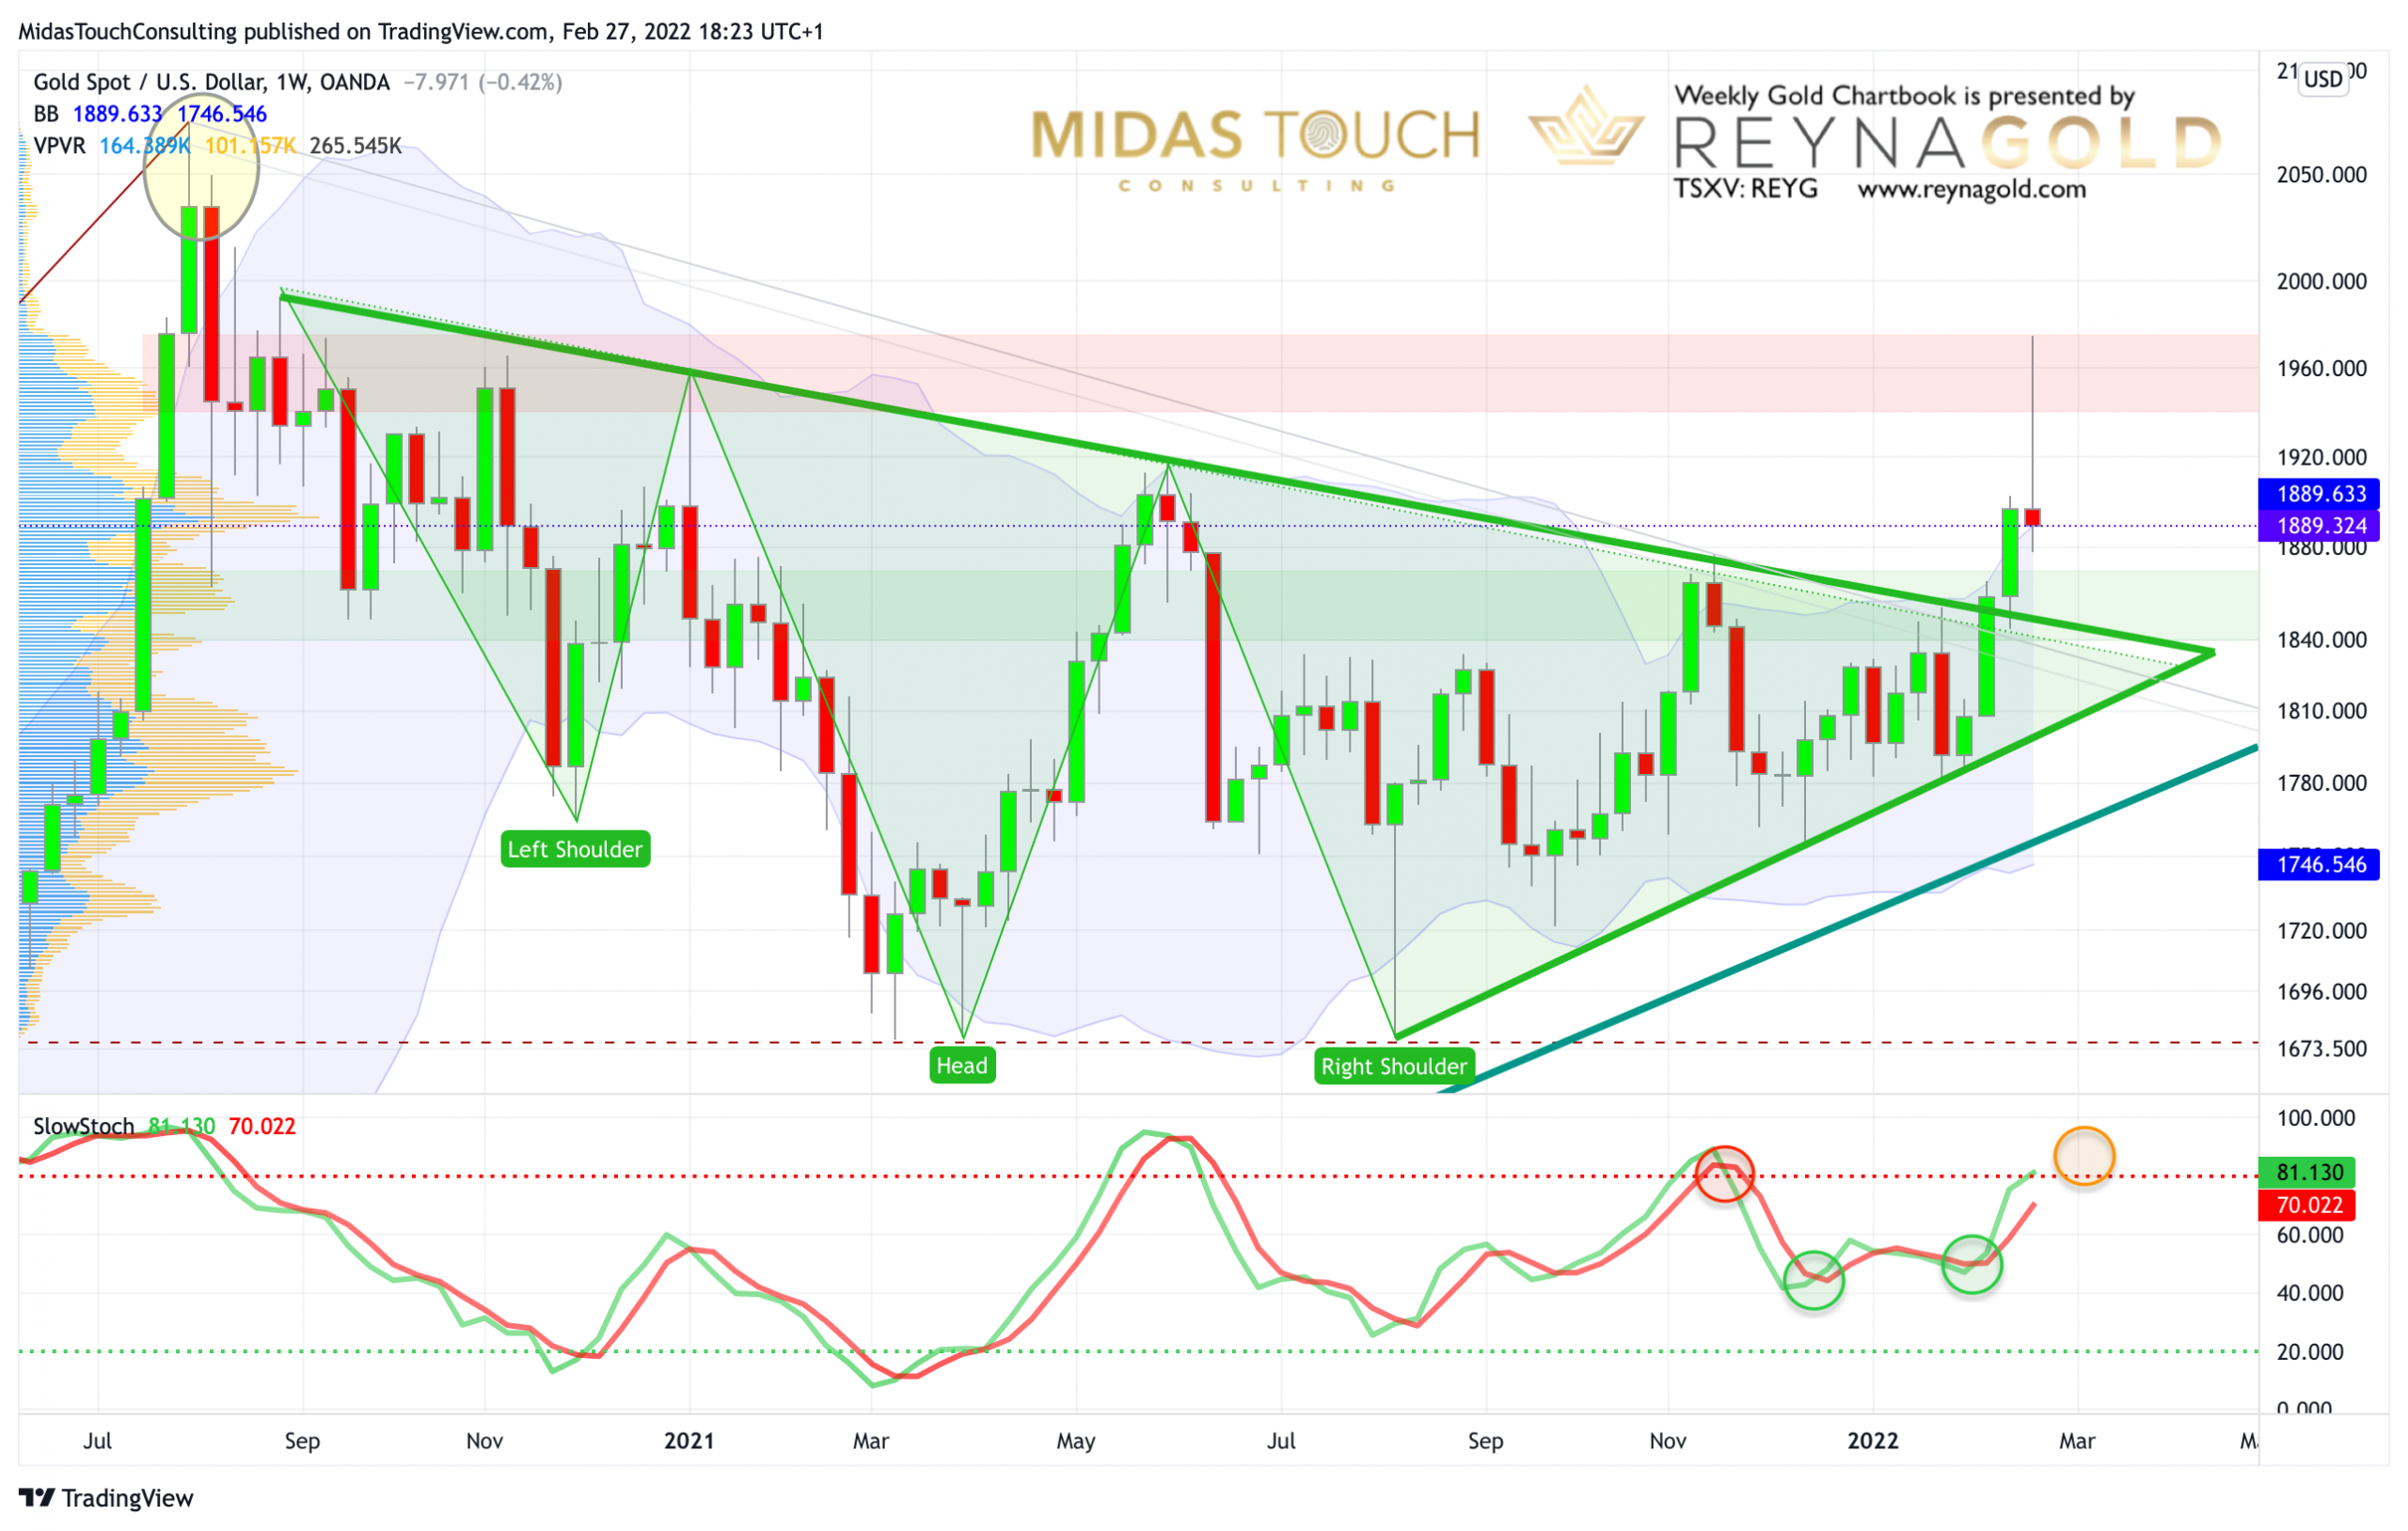
Gold in US-Dollar, weekly chart as of February 27th, 2022.
On its weekly chart, gold continues to be in an uptrend. The breakout above the downtrend line led to a sharp advance over the last two weeks. The stochastic oscillator still has a buy signal in place. And with the sharp reversal/pullback since reaching $1,975, gold did close the week right at its upper Bollinger Band (US$1,889). Since the upper Bollinger Band has been bent upwards, gold will now have more room to continue its rally to the upside over the coming two to four weeks.
However, the stochastic oscillator is about to reach its overbought zone. Comparing its behavior to the last 16 months, we have to assume that gold will have a hard time nesting up in the overbought zone for long. Hence, corrective price action is on the horizon.
Overall, the weekly chart is still bullish and points to another attack towards US$1,950 to US$1,975.
Gold in US-Dollar, daily chart as of February 27th, 2022.
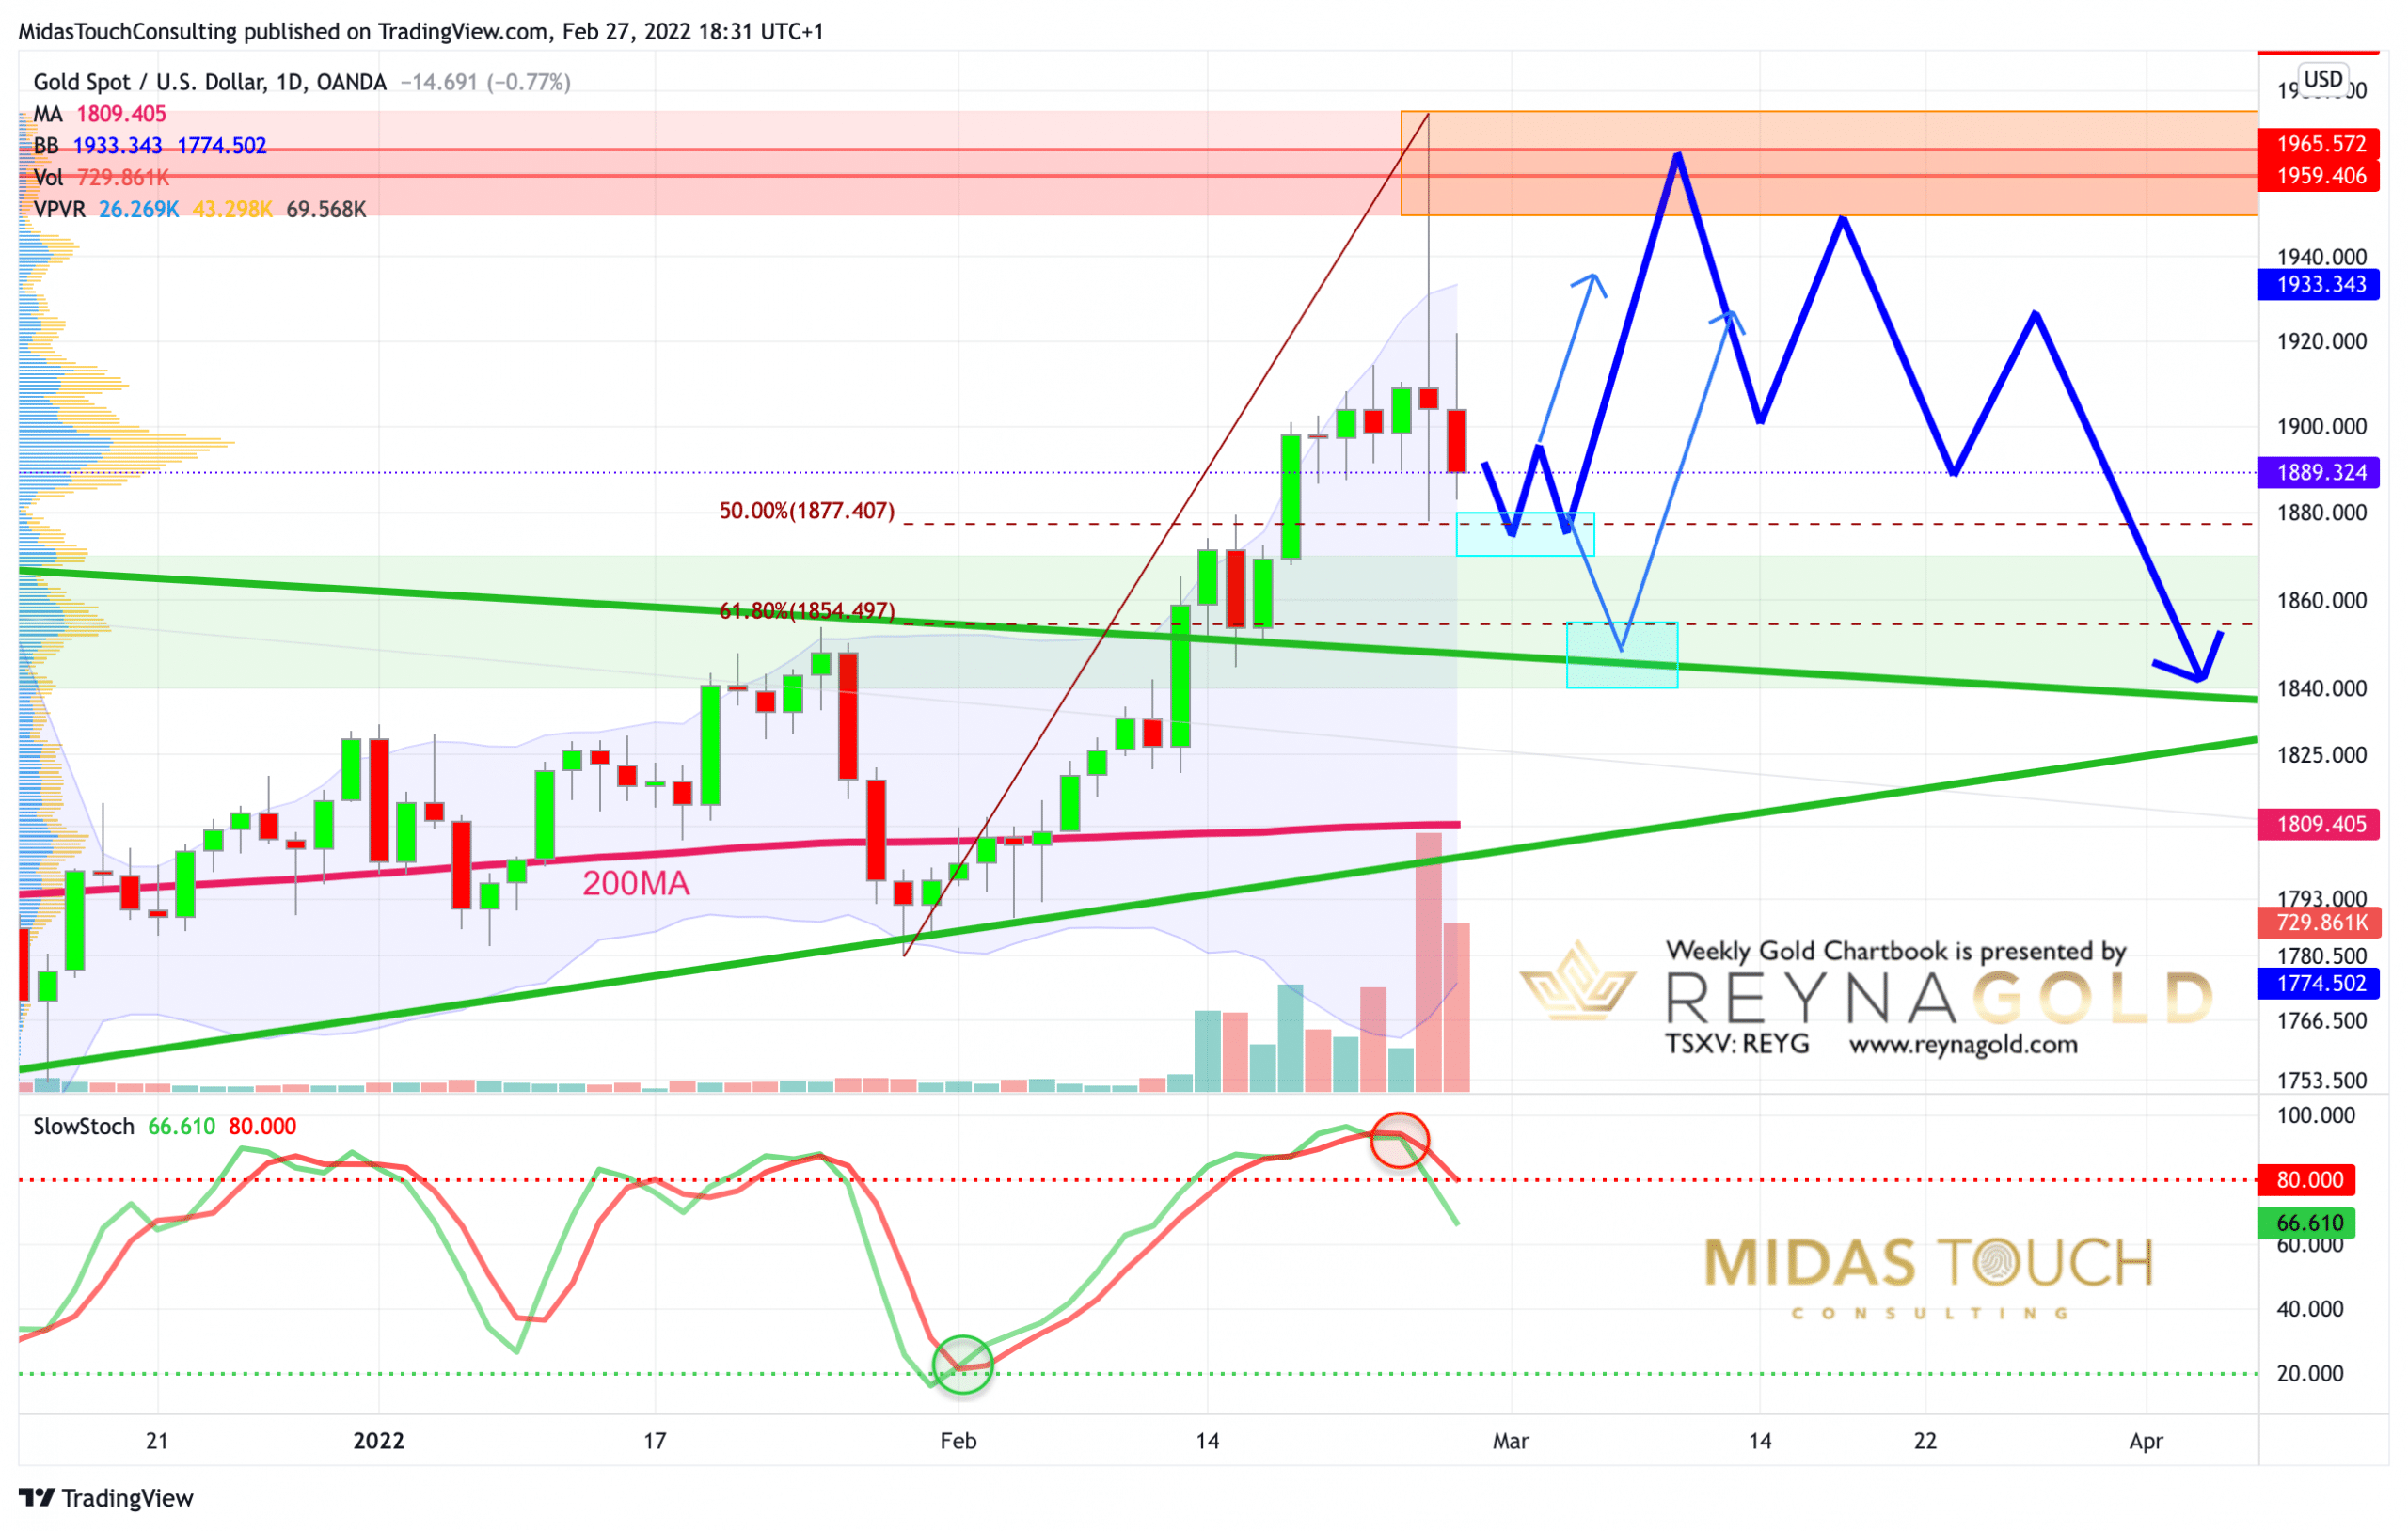
Gold in US-Dollar, daily chart as of February 27th, 2022.
The daily chart captures the sharp rally as well as the reversal and bloodbath in the gold market over last two days. So far, gold has given back nearly 50% of the rally since January 28th (from US$1,780 up to US$1,975 and then down to US$1,878). The stochastic oscillator has lost its embedded status and momentum is bearish now.
Should gold want to correct further towards the 61.8%-retracement ($1,854), it will likely also test the former resistance and breakout level around US$1,840 to US$1,845. Such a pullback towards US$1,840 to US$1,855 has certain probability, but would also offer a very interesting long entry again.
Since the short-term timeframes like the 1- and 4-hour charts are getting oversold, gold alternatively might find support between US$1,870 and US$1,880 over the next few days already.
To summarize, the daily chart is currently bearish and patience is needed. But Gold is well supported and should find support either between US$1,840 to US$1,855 or US$1,870 and US$1,880. Afterwards it should start another leg up.

Conclusion: Strong reversal should lead to another leg up
Last week’s price action was certainly not for the faint of heart. A daily gain of over +4% is extremely rare in the gold market and was immediately undone upon COMEX opening. The sharp reversal does not look too good, but it does not yet mean the end of the rally. Expect some more downside or at least sideways consolidation. Usually, such a sharp rally does not collapse immediately. Hence, once the bulls have sorted themselves, we expect another rise above US$1,900 with a minimum price target of US$1,950. An overshot towards US$2,000 is still possible, but now a bit less likely. Once this next attack will have failed, we assume the start of a corrective wave down somewhere in spring, which could last well into early to midsummer.
Feel free to join us in our free Telegram channel for daily real time data and a great community. If you like to get regular updates on our gold model, precious metals and cryptocurrencies you can also subscribe to our free newsletter.
Disclosure: Midas Touch Consulting and members of our team are invested in Reyna Gold Corp. These statements are intended to disclose any conflict of interest. They should not be misconstrued as a recommendation to purchase any share. This article and the content are for informational purposes only and do not contain investment advice or recommendations. Every investment and trading move involves risk, and readers should conduct their own research when making a decision. The views, thoughts and opinions expressed here are the author’s alone. They do not necessarily reflect or represent the views and opinions of Midas Touch Consulting.

