


Potential recovery to approx. US$2,000
Driven by the dramatic geopolitical escalation in Ukraine as well as the tough and unprecedented sanctions against Russia, which resulted in exploding oil and commodity prices, the gold market experienced a sharp spike followed by a rather brutal reversal in the last seven weeks. Gold – Potential recovery to approx. US$2,000.
Starting at a low of US$1,780 on January 28th, gold went up rapidly US$290 within less than six weeks, reaching a short-term top at US$2,070. Since that high on March 8th, however, gold prices fell back even faster. In total, gold plunged a whooping US$175 to a low of US$1,895 in the aftermath of last week’s FOMC meeting. A quick bounce took prices back to around US$1,950, but the weekly close at around US$1,920 came in lower.
This volatile roller coaster ride is truly not for the faint of heart. Nevertheless, gold has done well this year and, despite a looming multi-months correction, it might now be in a setup from which another attack towards US$2,000 could start in the short-term.
Gold in US-Dollar, weekly chart as of March 19th, 2022.
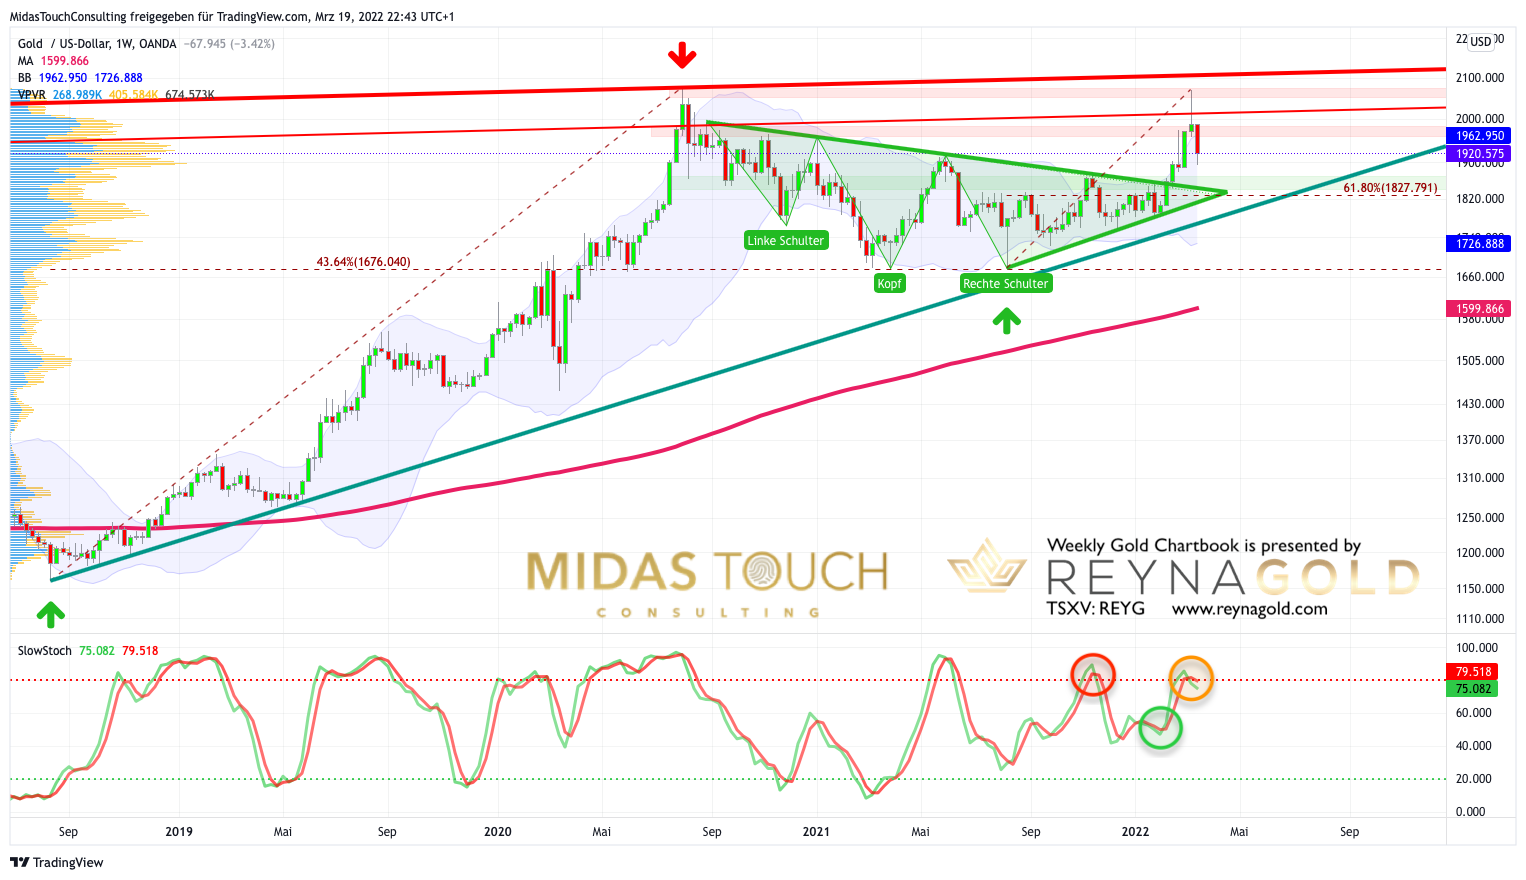
Gold in US-Dollar, weekly chart as of March 19th, 2022.
On the weekly chart, gold prices have been rushing higher with great momentum. For five consecutive weeks, the bulls were able to bend the upper Bollinger band (US$1,963) upwards. However, the final green candle closed far outside the Bollinger bands and looks like a weekly reversal. Consequently, if gold has now dipped into a multi-months correction, a retracement back to the neckline of the broken triangle respectively the inverse head & shoulder pattern in the range of US$1,820 to US$1,850 would be quite typical and to be expected. In this range, the classic 61.8% retracement of the entire wave up (from the low at US$1,678 on August 9th, 2021 to the most recent blow off top at US$2,070) sits at US$1,827.79. The weekly stochastic oscillator has not yet rolled over, but weekly momentum is overbought and vulnerable.
In total, the weekly chart shows a big reversal and therefore no longer supports the bullish case. However, it could still take some more time before a potential correction gains momentum.
Gold in US-Dollar, daily chart as of March 19th, 2022.
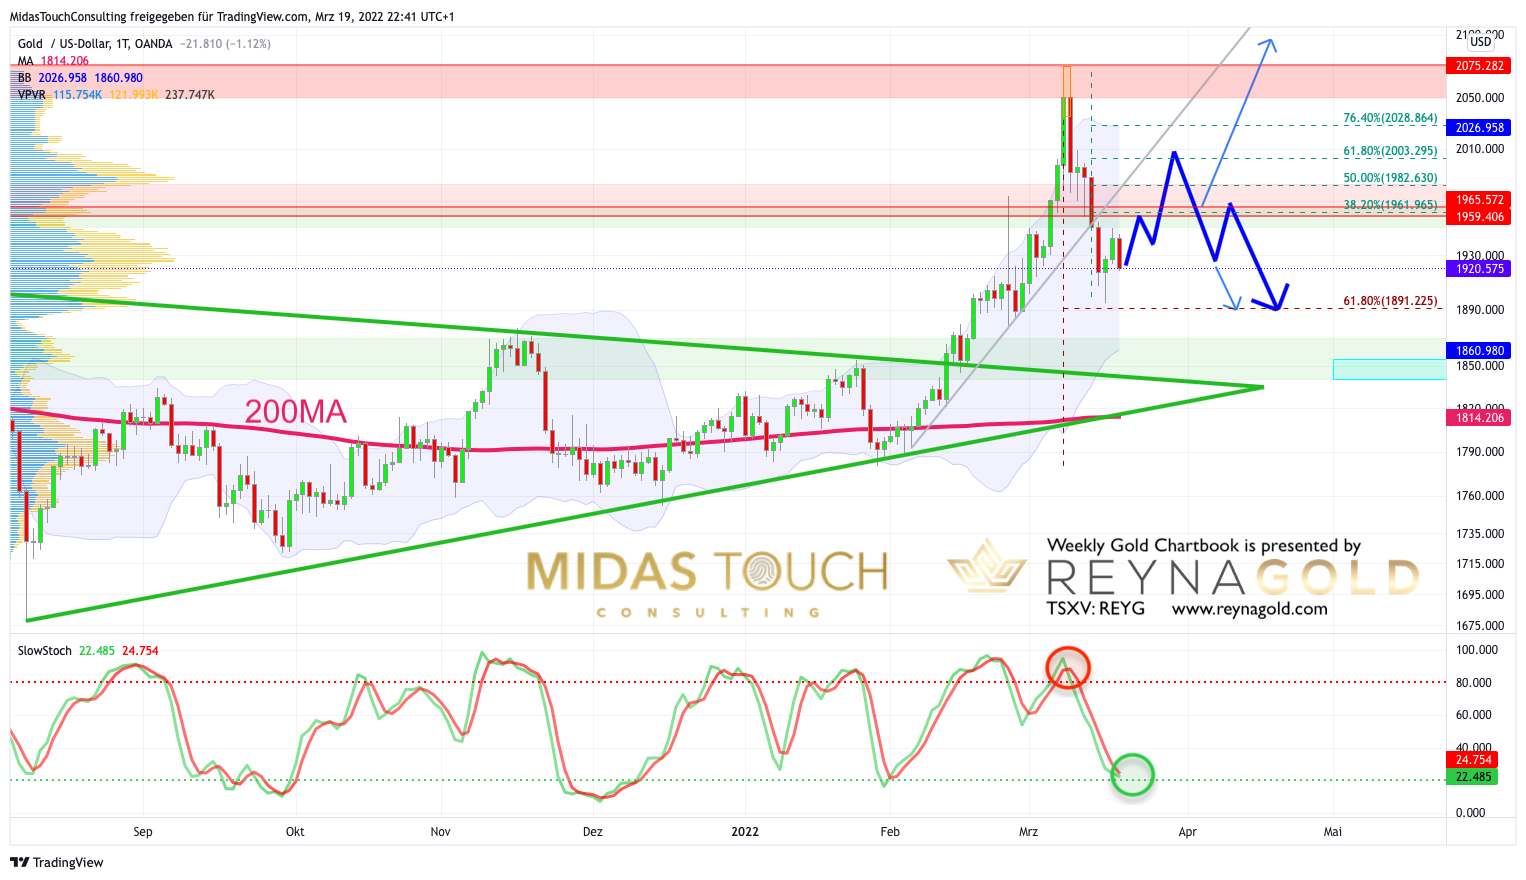
Gold in US-Dollar, daily chart as of March 19th, 2022.
While the weekly chart may just be at the beginning of a multi-months correction, the overbought setup on the daily chart has already been largely cleared up by the recent steep pullback. Despite Friday’s rather weak closing, the odds are not bad that gold might very soon be turning up again. However, gold bulls need to take out the pivot resistance around US$1,960 to unlock higher price targets in the context of a recovery. The potential Fibonacci retracements are waiting at US$1,962, US$2,003 and US$2,028. Hence, gold could bounce back to approx. US$2,000, which is a round number and therefore a psychological resistance.
On the other hand, if gold fails to move back above Thursday’s high at US$1,950, weakness would increase immediately and significantly. In that case, bulls can only hope that the quickly rising lower Bollinger Band (US$1,861) would catch and limit a deeper sell-off. But since the stochastic oscillator has reached its oversold zone, bears might have a hard time pushing gold significantly below US$1,900.
Overall, the daily chart is slightly oversold and gold might start a bounce soon.

Conclusion: Potential recovery to approx. US$2,000
After a strong rally and a steep pullback, the gold market is likely in the process of reordering. While the weekly timeframe points to a correction, the oversold daily chart points to an immediate bounce. Given these contradictory signals, investors and especially traders are well advised to exercise patience and caution in the coming days, weeks and months. If gold has entered a corrective cycle, it could easily take until the early to mid-summer before a sustainable new up-trend might emerge.
Alternative super bullish scenario
Alternatively, and this of course is still a possible scenario, the breakout from the large “cup and handle” pattern is just getting started. In this very bullish case, gold is in the process of breaking out above US$2,100 to finally complete the very large “cup and handle” pattern, which has been developing for 11 years! Obviously, the sky would then be the limit.
To summarize, gold is getting really bullish back above US$2,030. On the other hand, below $US1,895 the bears would be in control. In between those two numbers, the odds favor a bounce towards US$1,960 and maybe USD$2,000.
Feel free to join us in our free Telegram channel for daily real time data and a great community. If you like to get regular updates on our gold model, precious metals and cryptocurrencies you can also subscribe to our free newsletter.
Disclosure: Midas Touch Consulting and members of our team are invested in Reyna Gold Corp. These statements are intended to disclose any conflict of interest. They should not be misconstrued as a recommendation to purchase any share. This article and the content are for informational purposes only and do not contain investment advice or recommendations. Every investment and trading move involves risk, and readers should conduct their own research when making a decision. The views, thoughts and opinions expressed here are the author’s alone. They do not necessarily reflect or represent the views and opinions of Midas Touch Consulting.

