


Spring correction or further escalation?
When Gold started to break out of its multi-month triangle in early February, we figured that US$1,975 would be a realistic target. We also stated that a short-lived overshot towards US$2,000 would be a possibility. Little did we know back then about the geopolitical turmoil that unfolded over the last six weeks. The Russian invasion followed by massive sanctions have pushed commodities and gold strongly higher. Even though it appears very challenging to follow your preplanned analysis while at the same remaining an open-minded listener to the markets, we now see a setup where gold has become vulnerable in the short-term. At the same time, the fundamentals have never been more bullish for gold, and it doesn’t take much upside to initiate another run towards the all-time high at US$2,075. Gold – Spring correction or further escalation?
Let’s examine the gold market with a top-down approach.
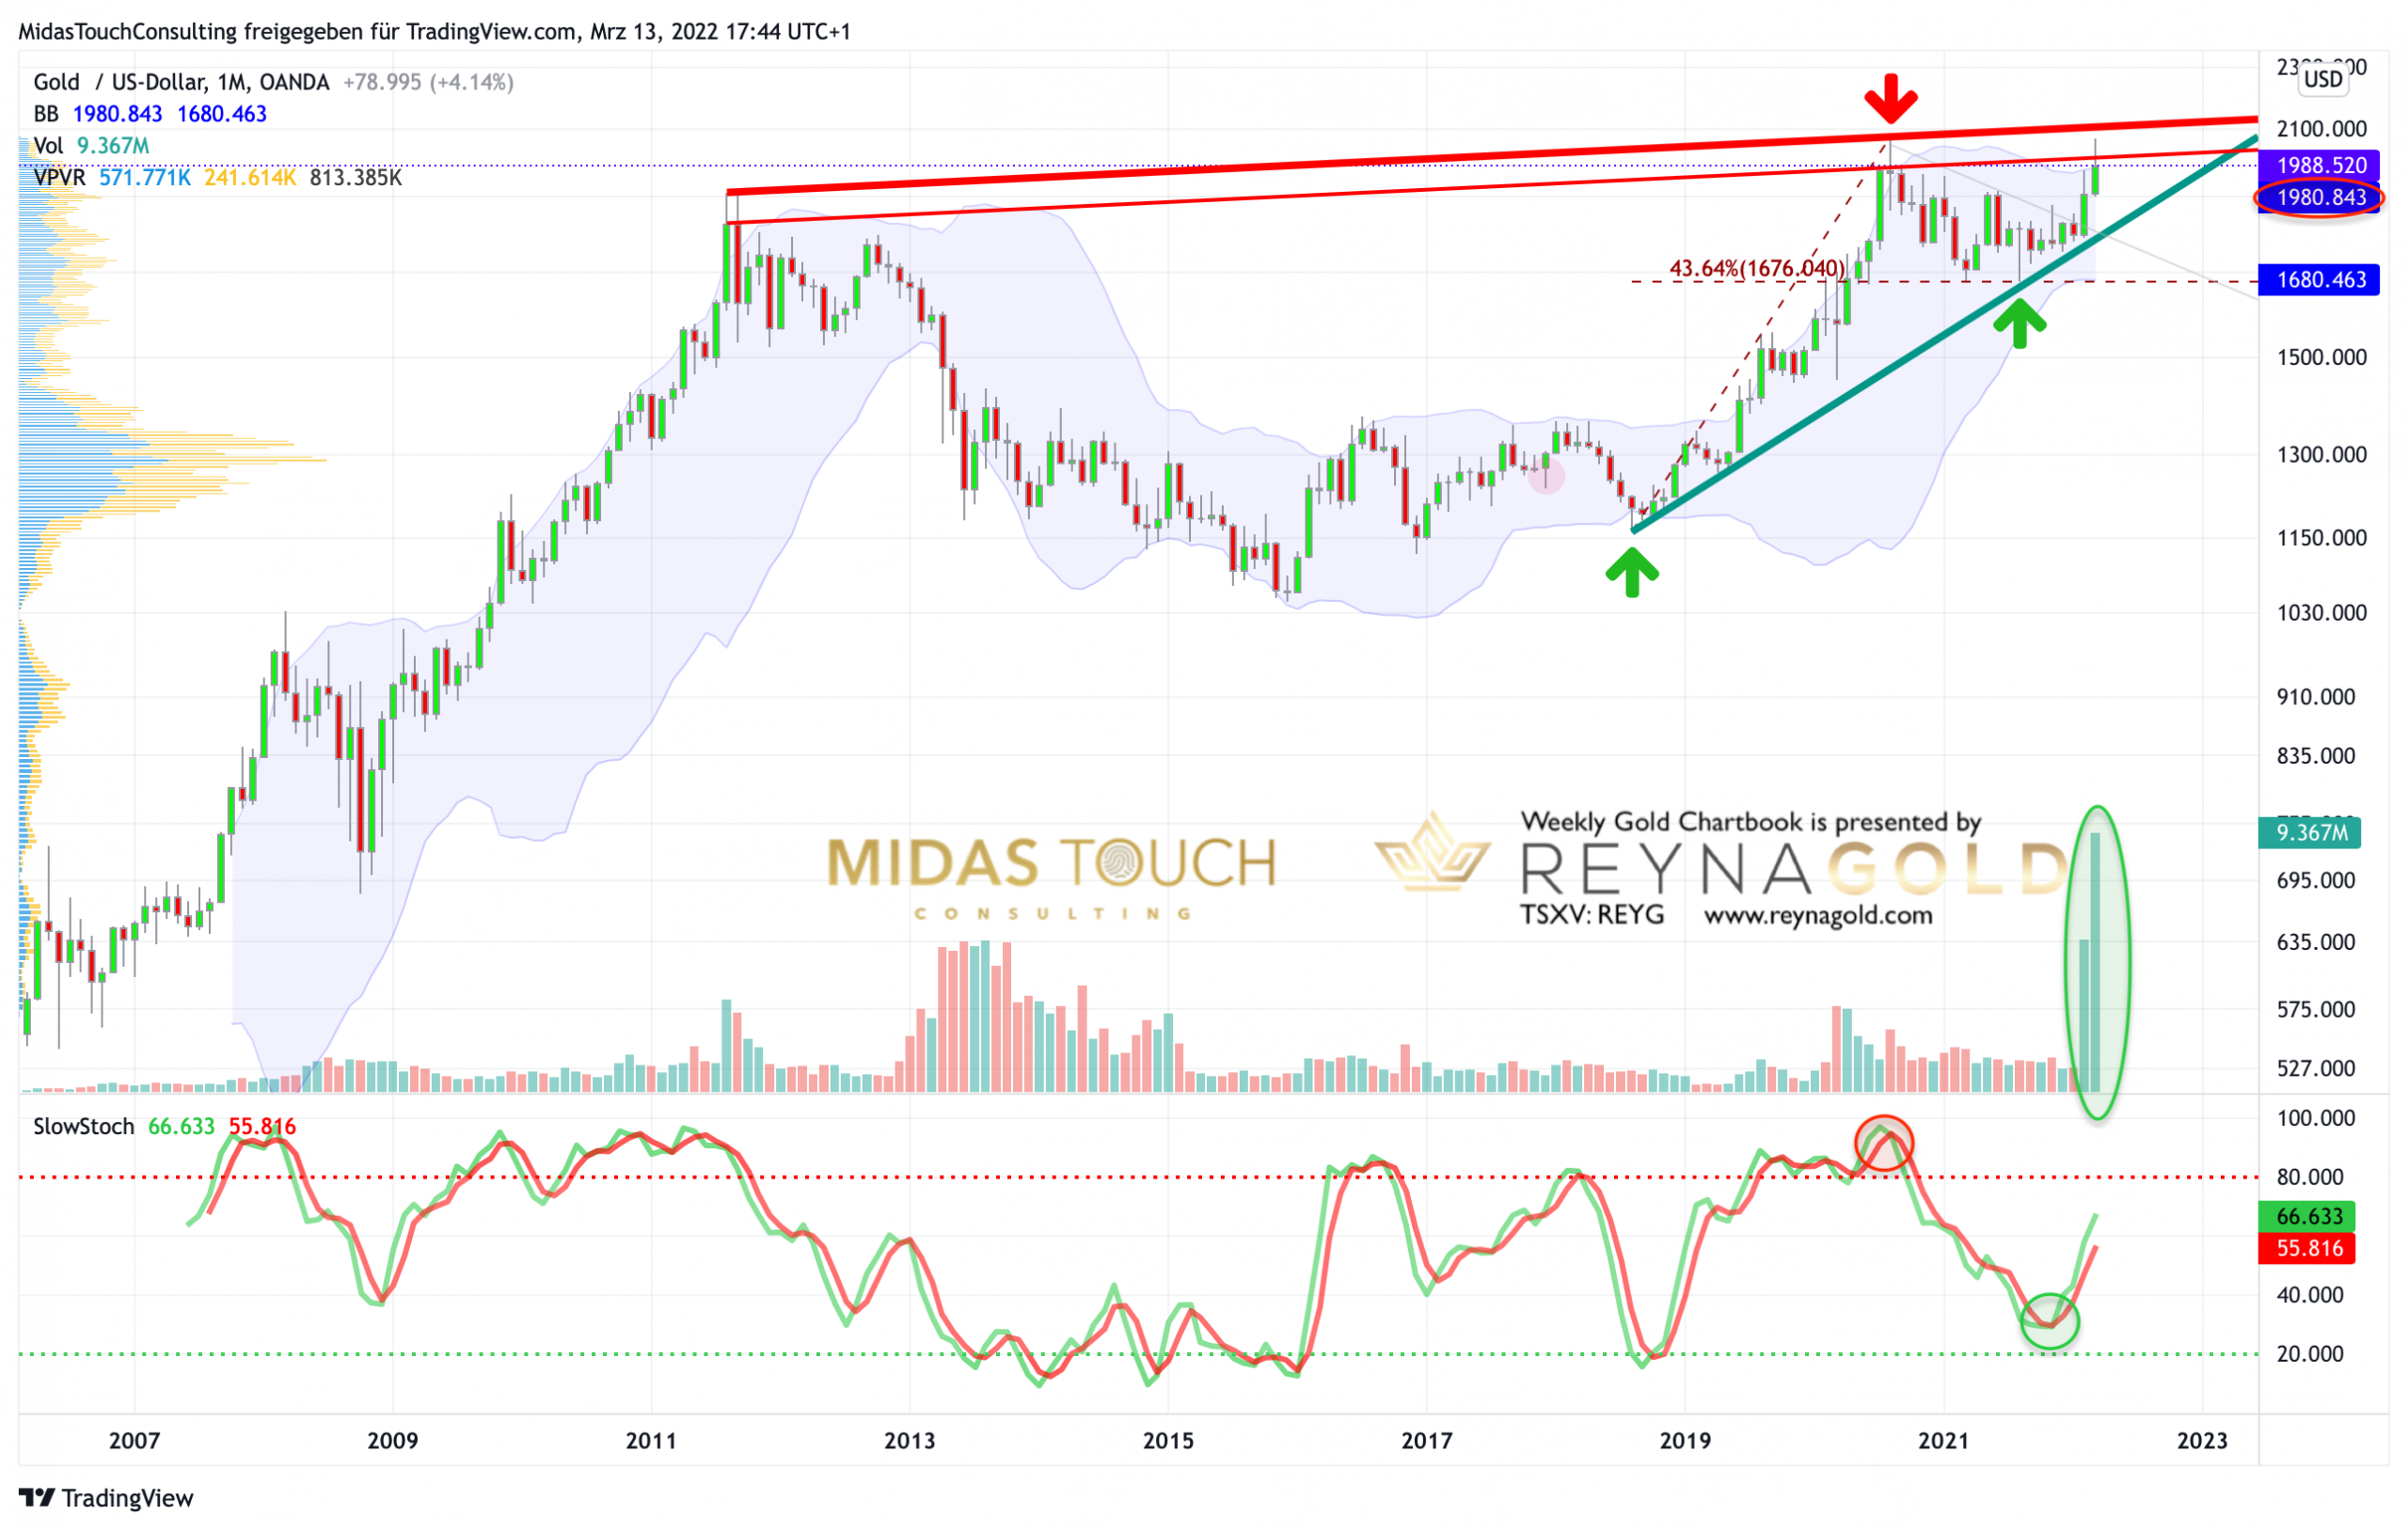
Gold in US-Dollar, monthly chart as of March 13th, 2022.
Gold in US-Dollar, monthly chart as of March 13th, 2022.
Since August 2011, gold has been building a very large cup and handle formation. The most conservatively drawn neckline currently sits at around US$2,100. You could also argue that the whole zone between US$1,900 and US$2,100 is the neckline and once gold will have broken through that resistance zone, the sky will be the limit. The stochastic oscillator has given a clear buy signal on the monthly chart, and recent volume has been dwarfing anything we have seen over the last 25 years! But the monthly Bollinger Band (US$1,980) has so far only allowed a short-lived overshot and is strong resistance, hence any move back above US$2,000 will take an extra effort from the bulls.
In total, the monthly chart is bullish and one could argue that the breakout is in full swing. Yet, at the same time the chart indicates massive resistance between US$1,980 and US$2,100. A pullback below the uptrend line, in place since August 2018, at around US$1,800 on the other hand seems unlikely. Hence, gold might consolidate between US1,800 and US$2,100 for some time.
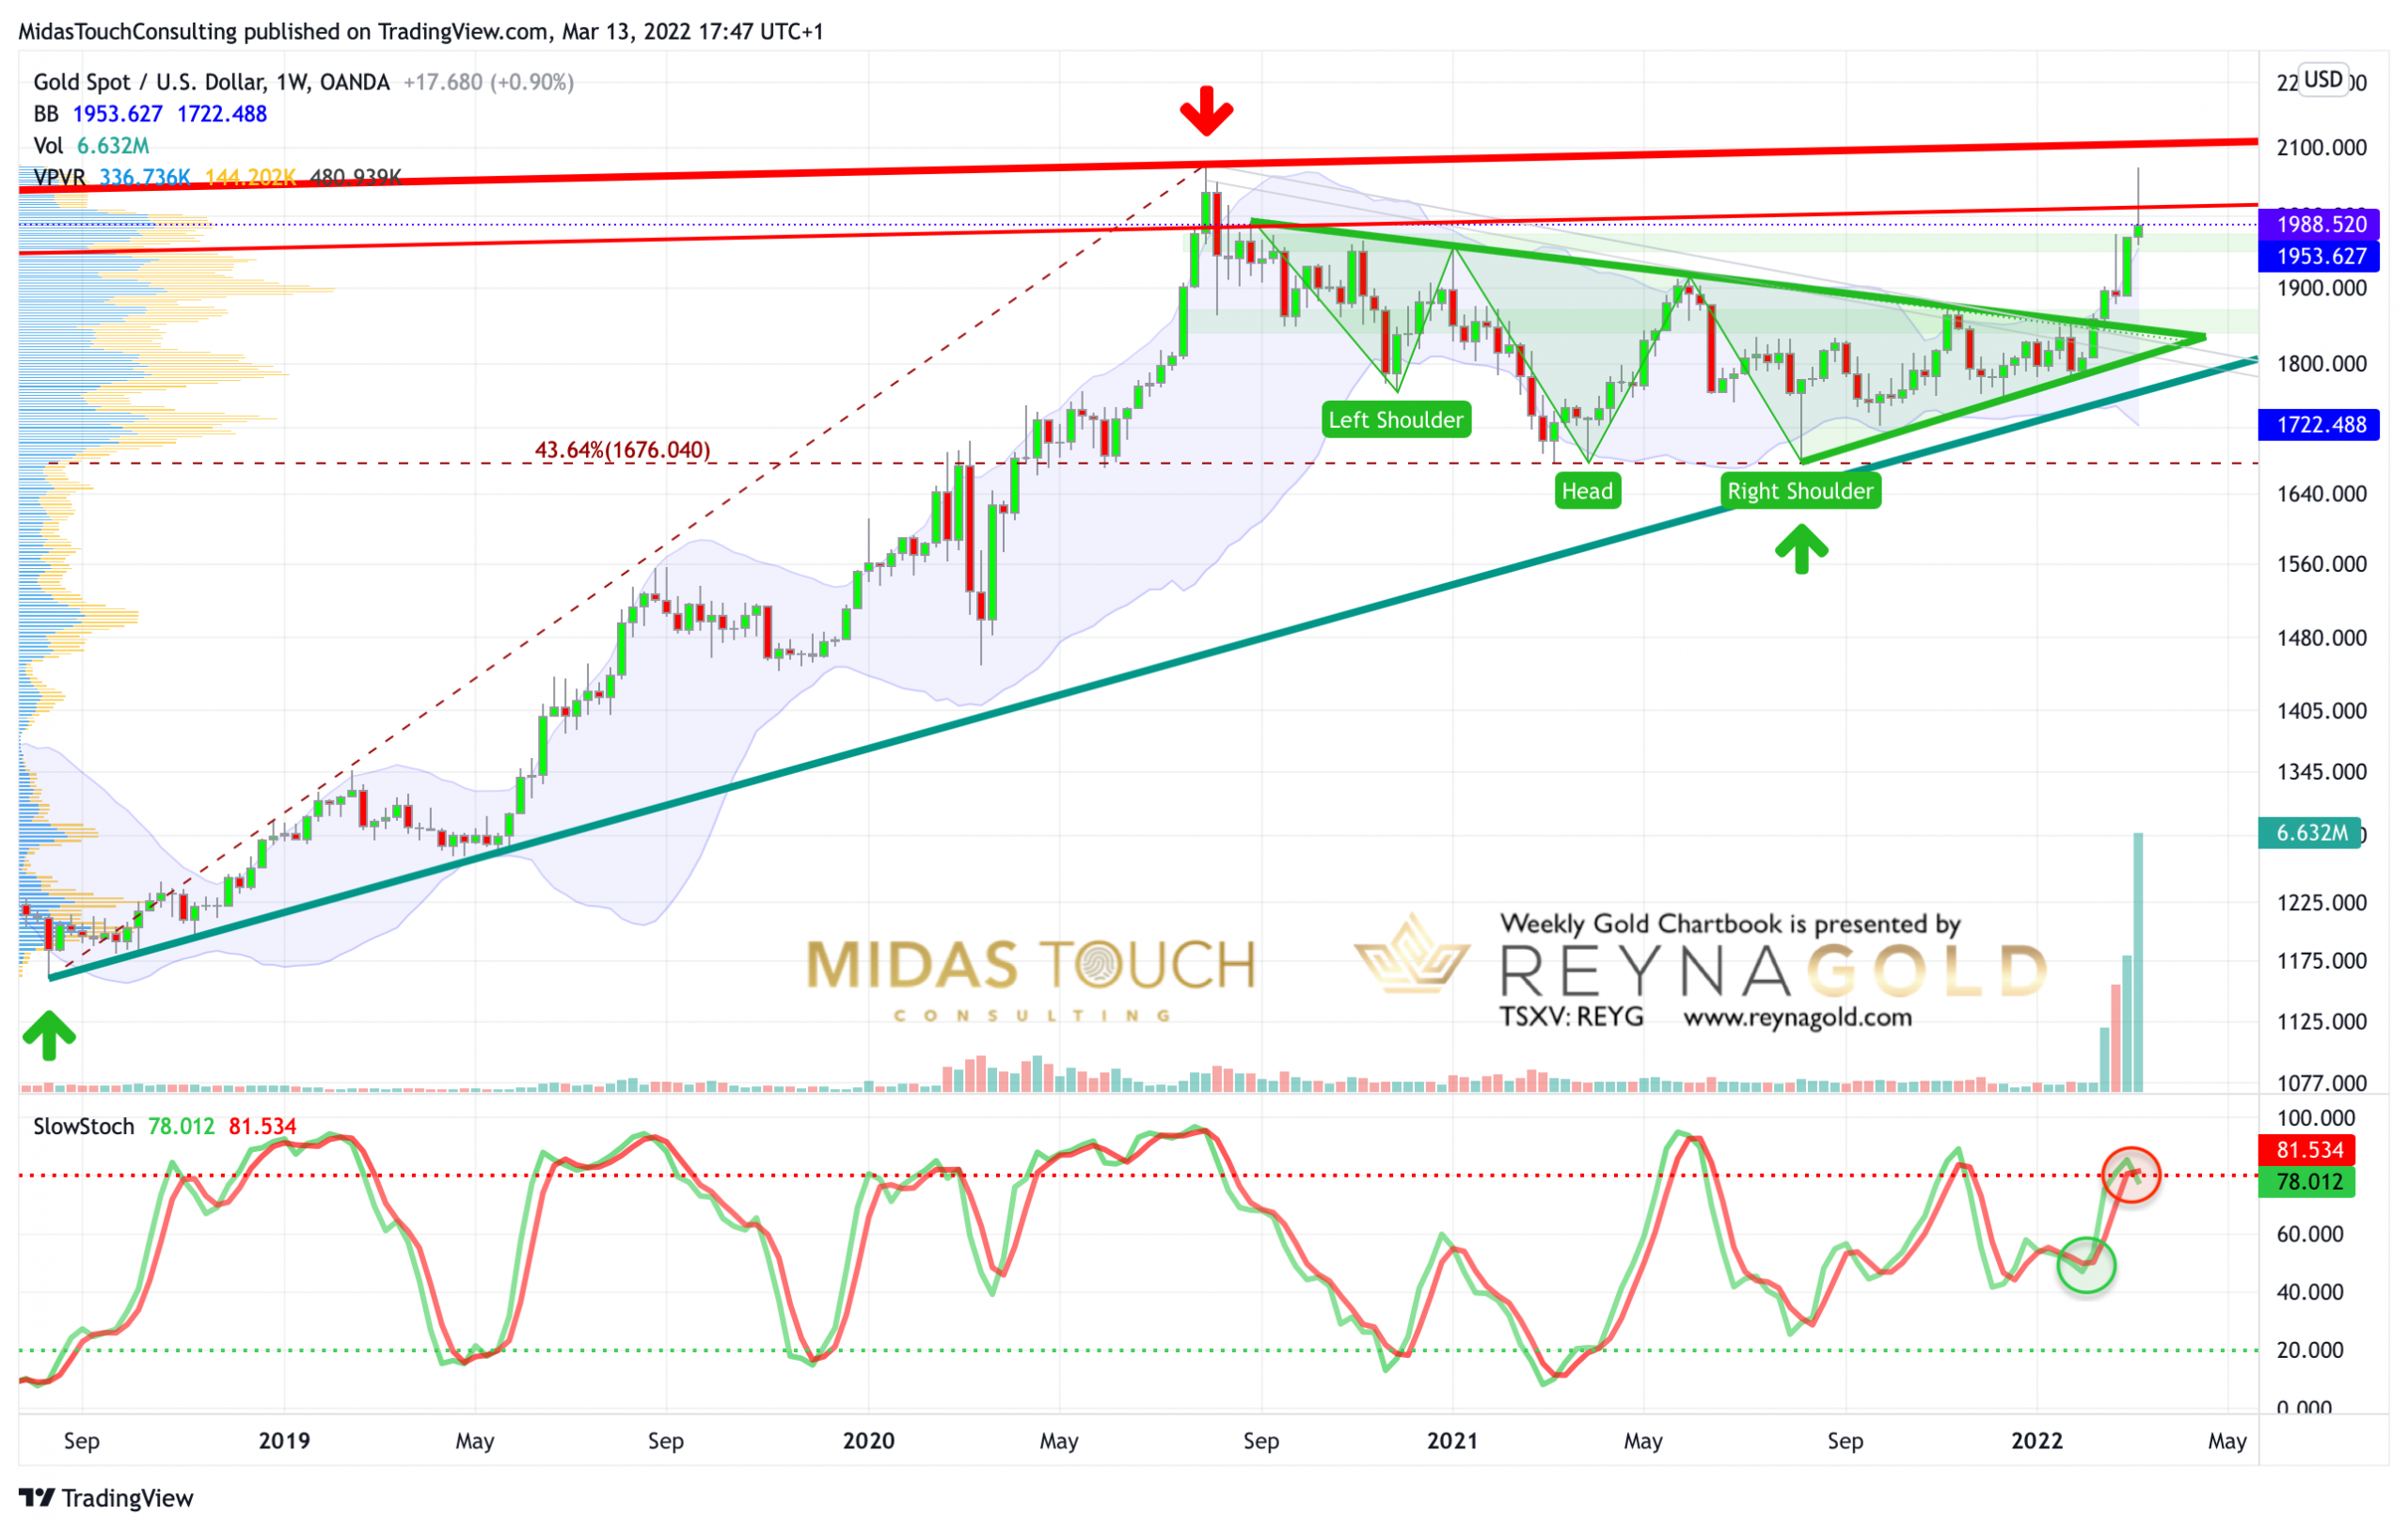
Gold in US-Dollar, weekly chart as of March 13th, 2022.
Gold in US-Dollar, weekly chart as of March 13th, 2022.
On its weekly chart, gold has been pushing trading above the weekly Bollinger Band for the 4th week in a row. Usually, five or six weeks are the maximum that a string trend can stretch these bands. Hence, the air is becoming thinner and thinner for the bulls. As well, the stochastic oscillator has issued a sell signal.
Obviously, the uptrend is still intact, but the bulls need to regain the US$2,000 mark rather soon. Otherwise, the overbought setup can easily trigger a larger pullback. A correction back to the neckline of the head and shoulder pattern around US$1,840 would take some time but is not impossible!
Overall, the weekly chart is neutral to slightly bullish, but last week’s candle looks like a reversal. Hence, the warning signals are increasing.
Gold in US-Dollar, daily chart as of March 13th, 2022.
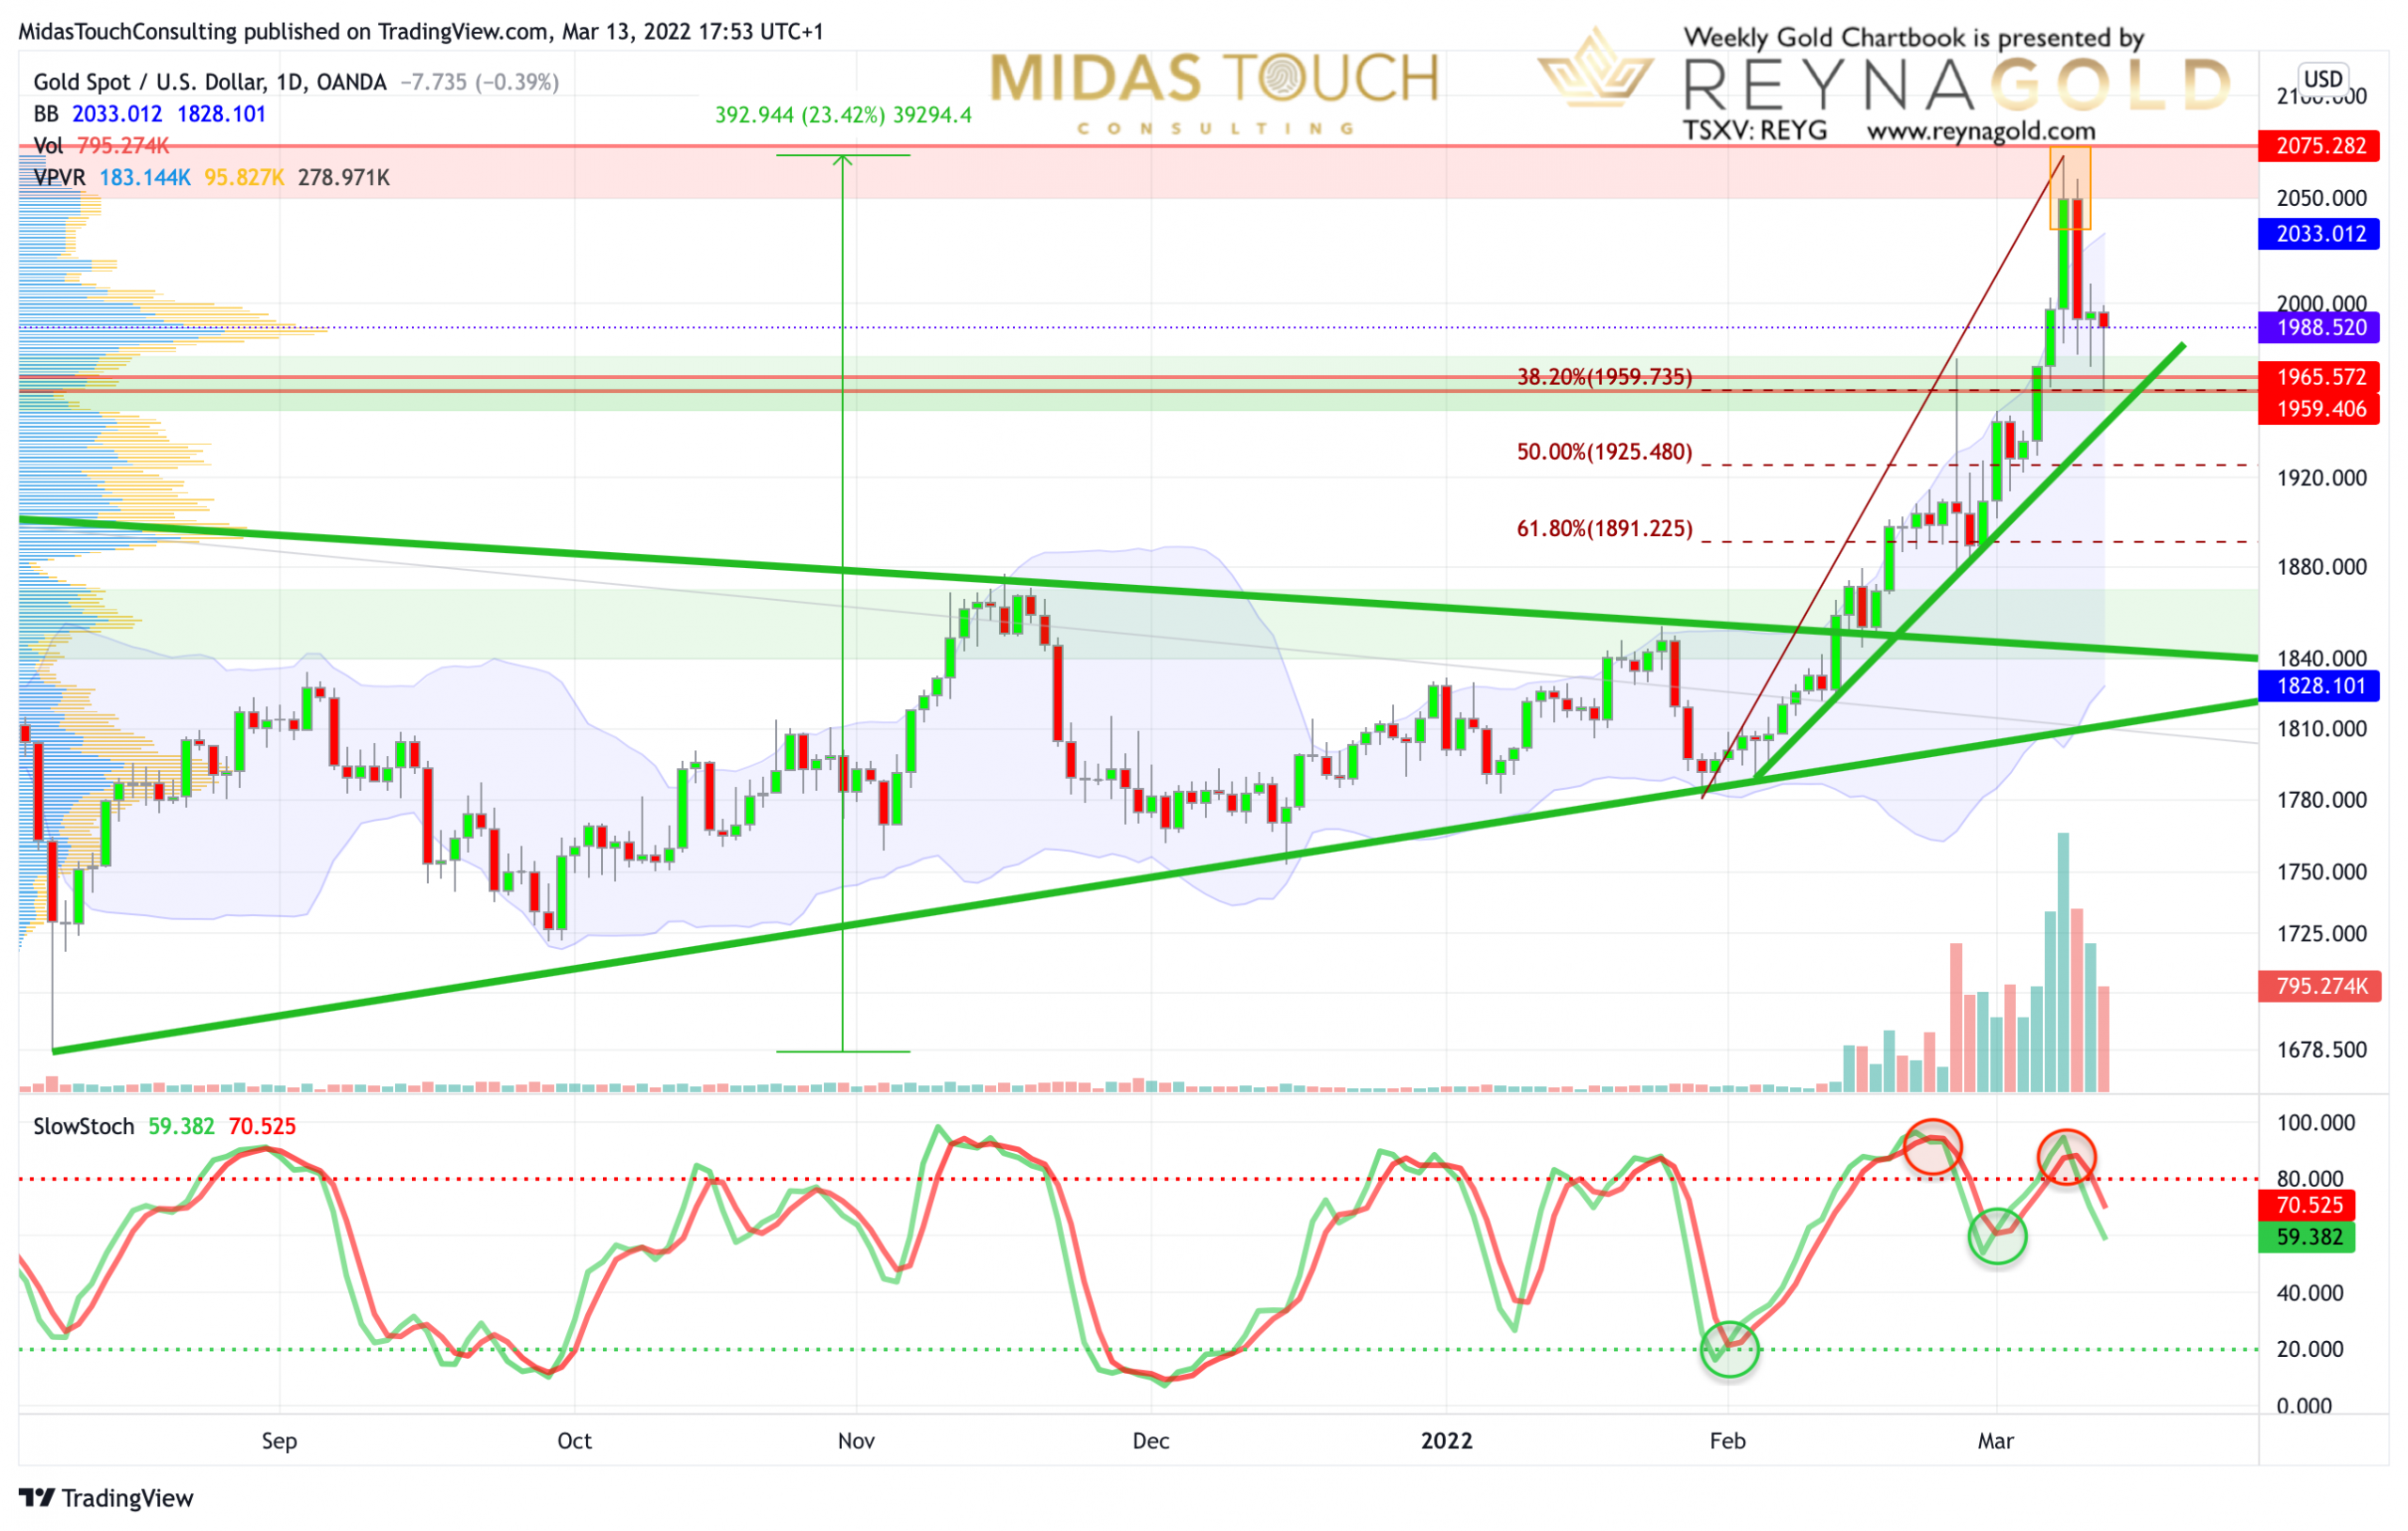
Gold in US-Dollar, daily chart as of March 13th, 2022.
On the daily chart, gold has gained US$393 or 23.4% since the start of this rally back in August 2021. The steep rise since late January 2022 has delivered a gain of US$290 or 16.3%. The pullback, that started with a big reversal day last Wednesday, has so far exactly retraced 38.2% of the recent rally. Thus, the low on Friday at US$1,958 has brought buyers back into the market.
In summary, last week’s price action has a toppy taste and the stochastic oscillator activated a new sell signal. Hence, the strong rally in recent weeks is at risk of transforming into the typical spring top in the gold market. A lower low below Friday’s low at US$1,958 would confirm that the bears have taken over control.

Gold in US-Dollar, 1-hour chart as of March 13th, 2022.
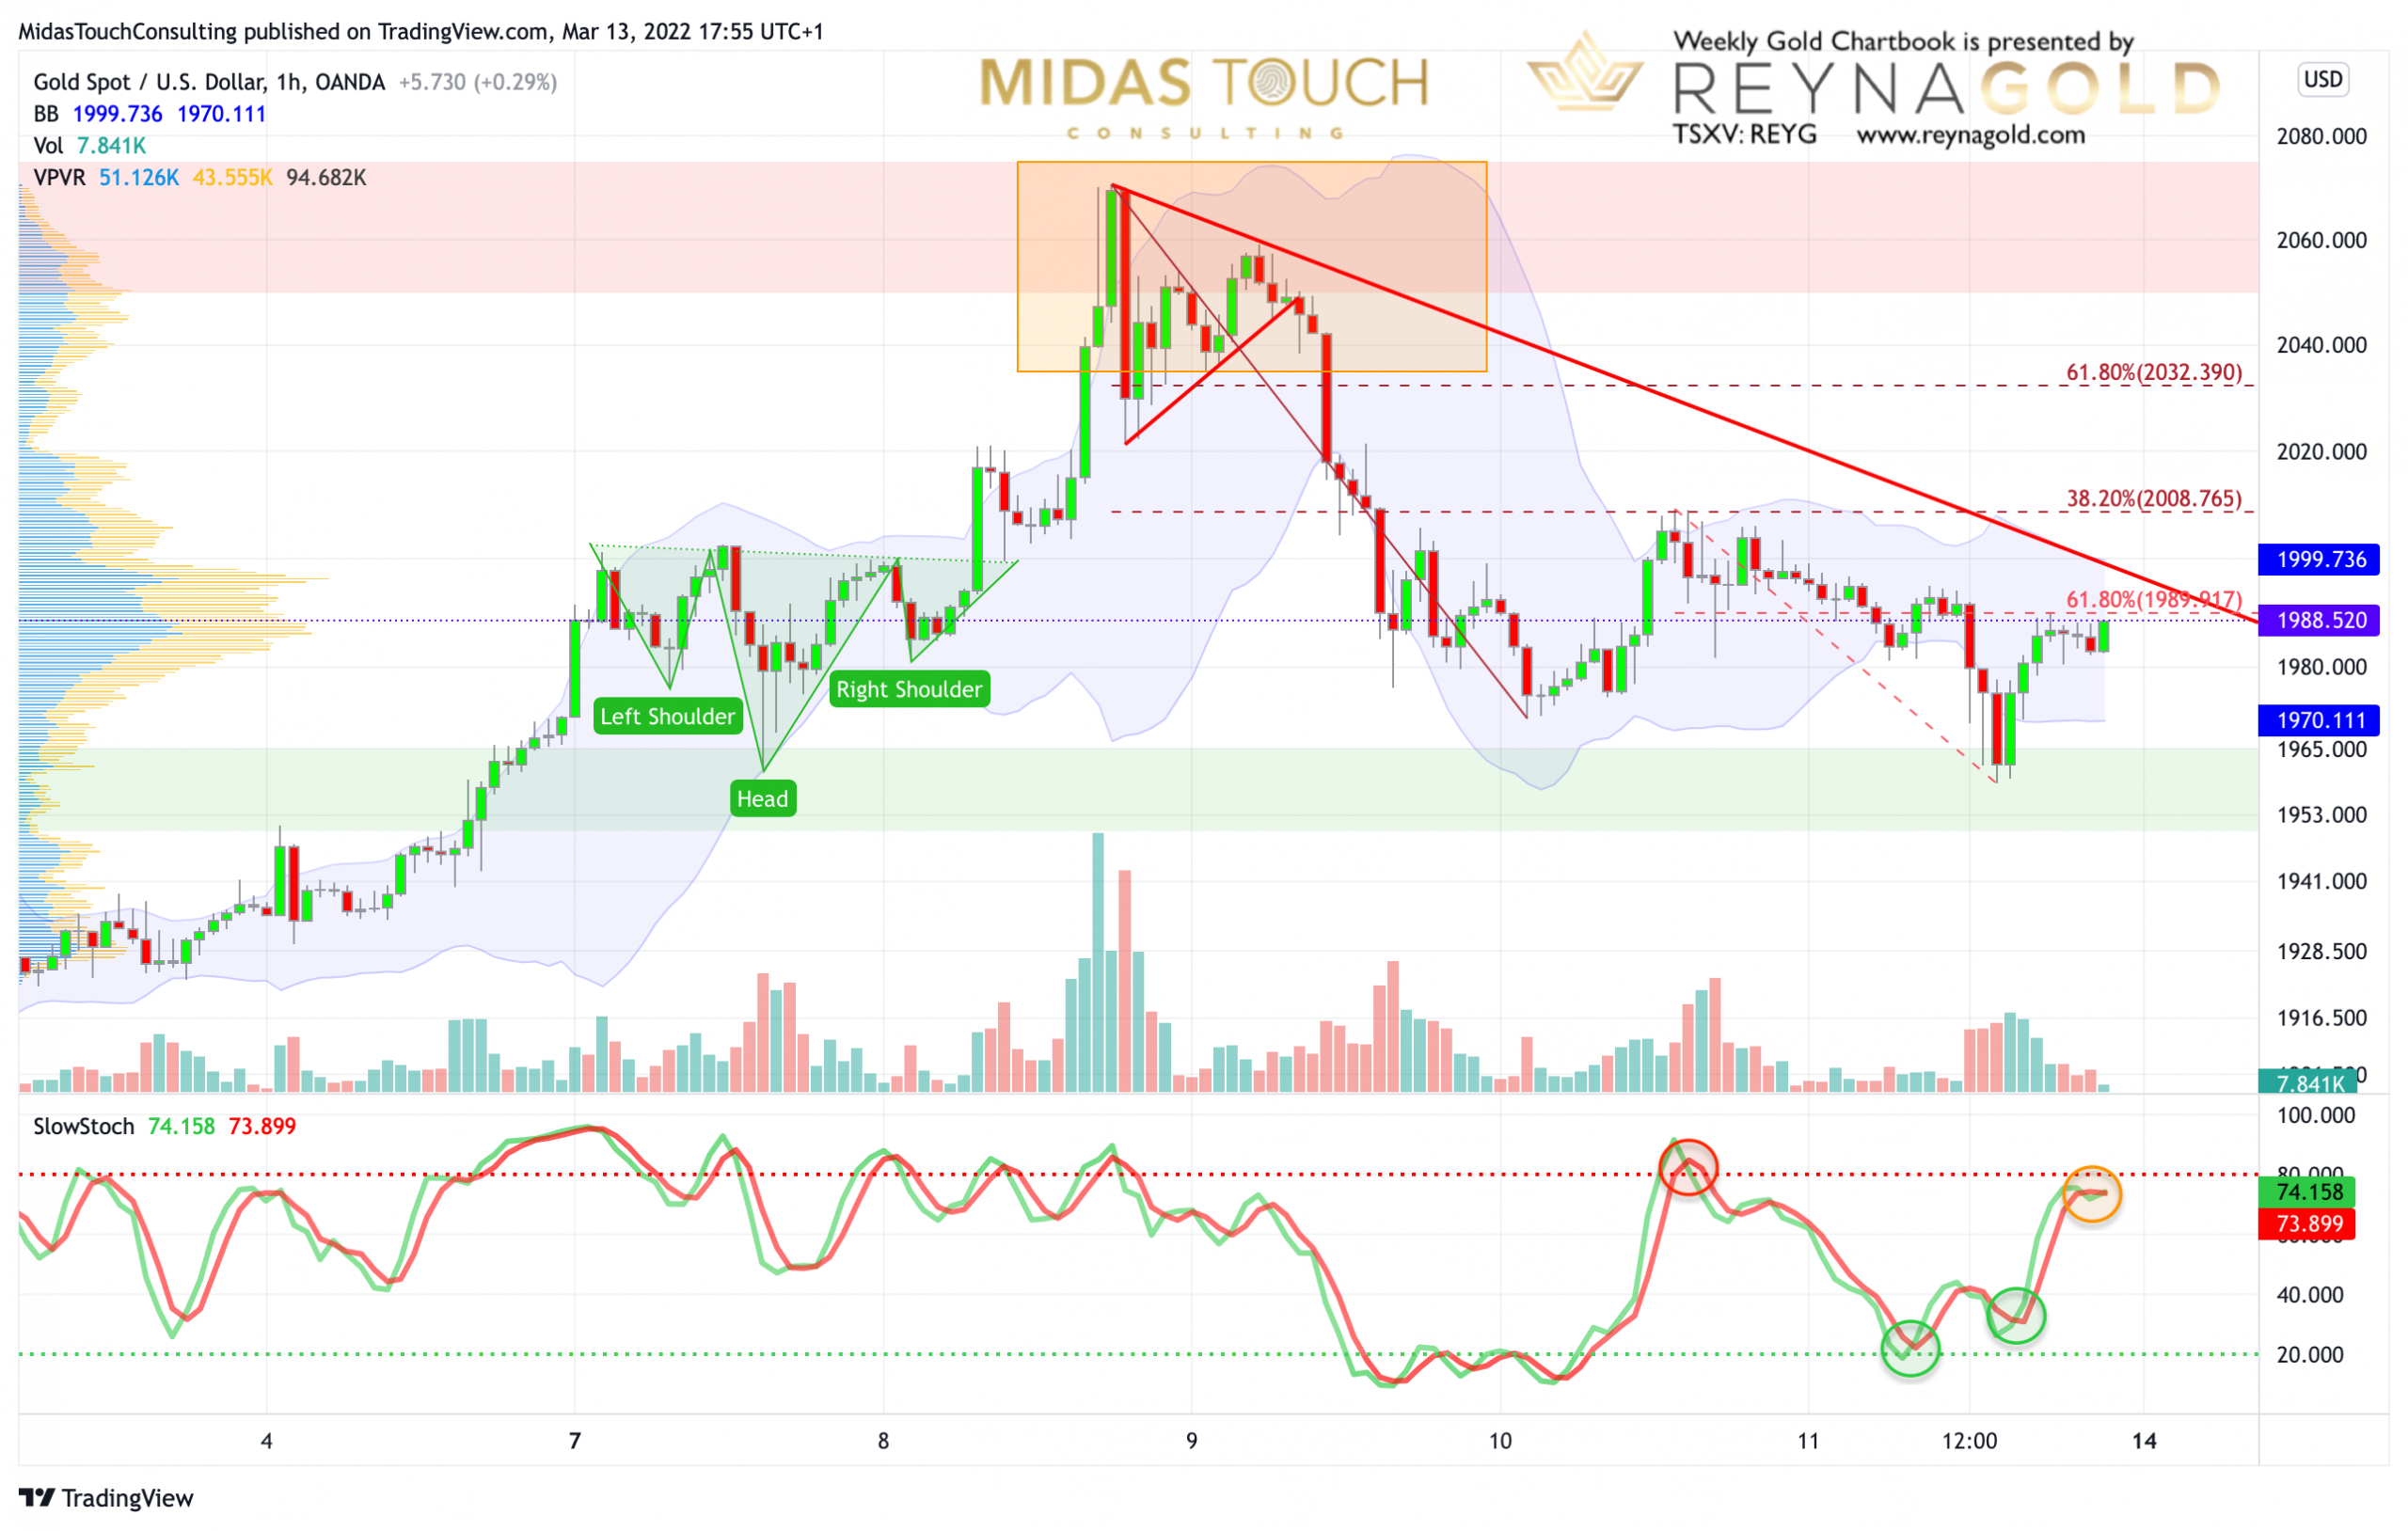
Gold in US-Dollar, 1-hour chart as of March 13th, 2022.
At this critical juncture, we are zooming further into the price action. The 1-hour chart shows the last 10 days in the gold market. After an initial inverse head and shoulder pattern, the bulls drove gold prices nearly towards the all-time high (US$2,075). But after a brief triangle consolidation, the bears finally came back into the market and managed to push gold nearly $110 lower in two waves. The first bounce failed at the 38.2% retracement at $2,008, while Friday’s sell-off recovered nearly 61.8% (US$1,990) of that 2nd wave down.
Hence, if gold wants to continue its bull-run, it has to conquer US$1,990 and US$2,008 urgently. Pretty much in between those two targets, a first bearish downtrend line is waiting that needs to be broken, too.
Overall, the microscope analysis on the 1-hour chart clearly shows that gold needs to regain US$2,000 and US$2,030, before we can assume that this rally is not over yet.
Sentiment – Caution advised
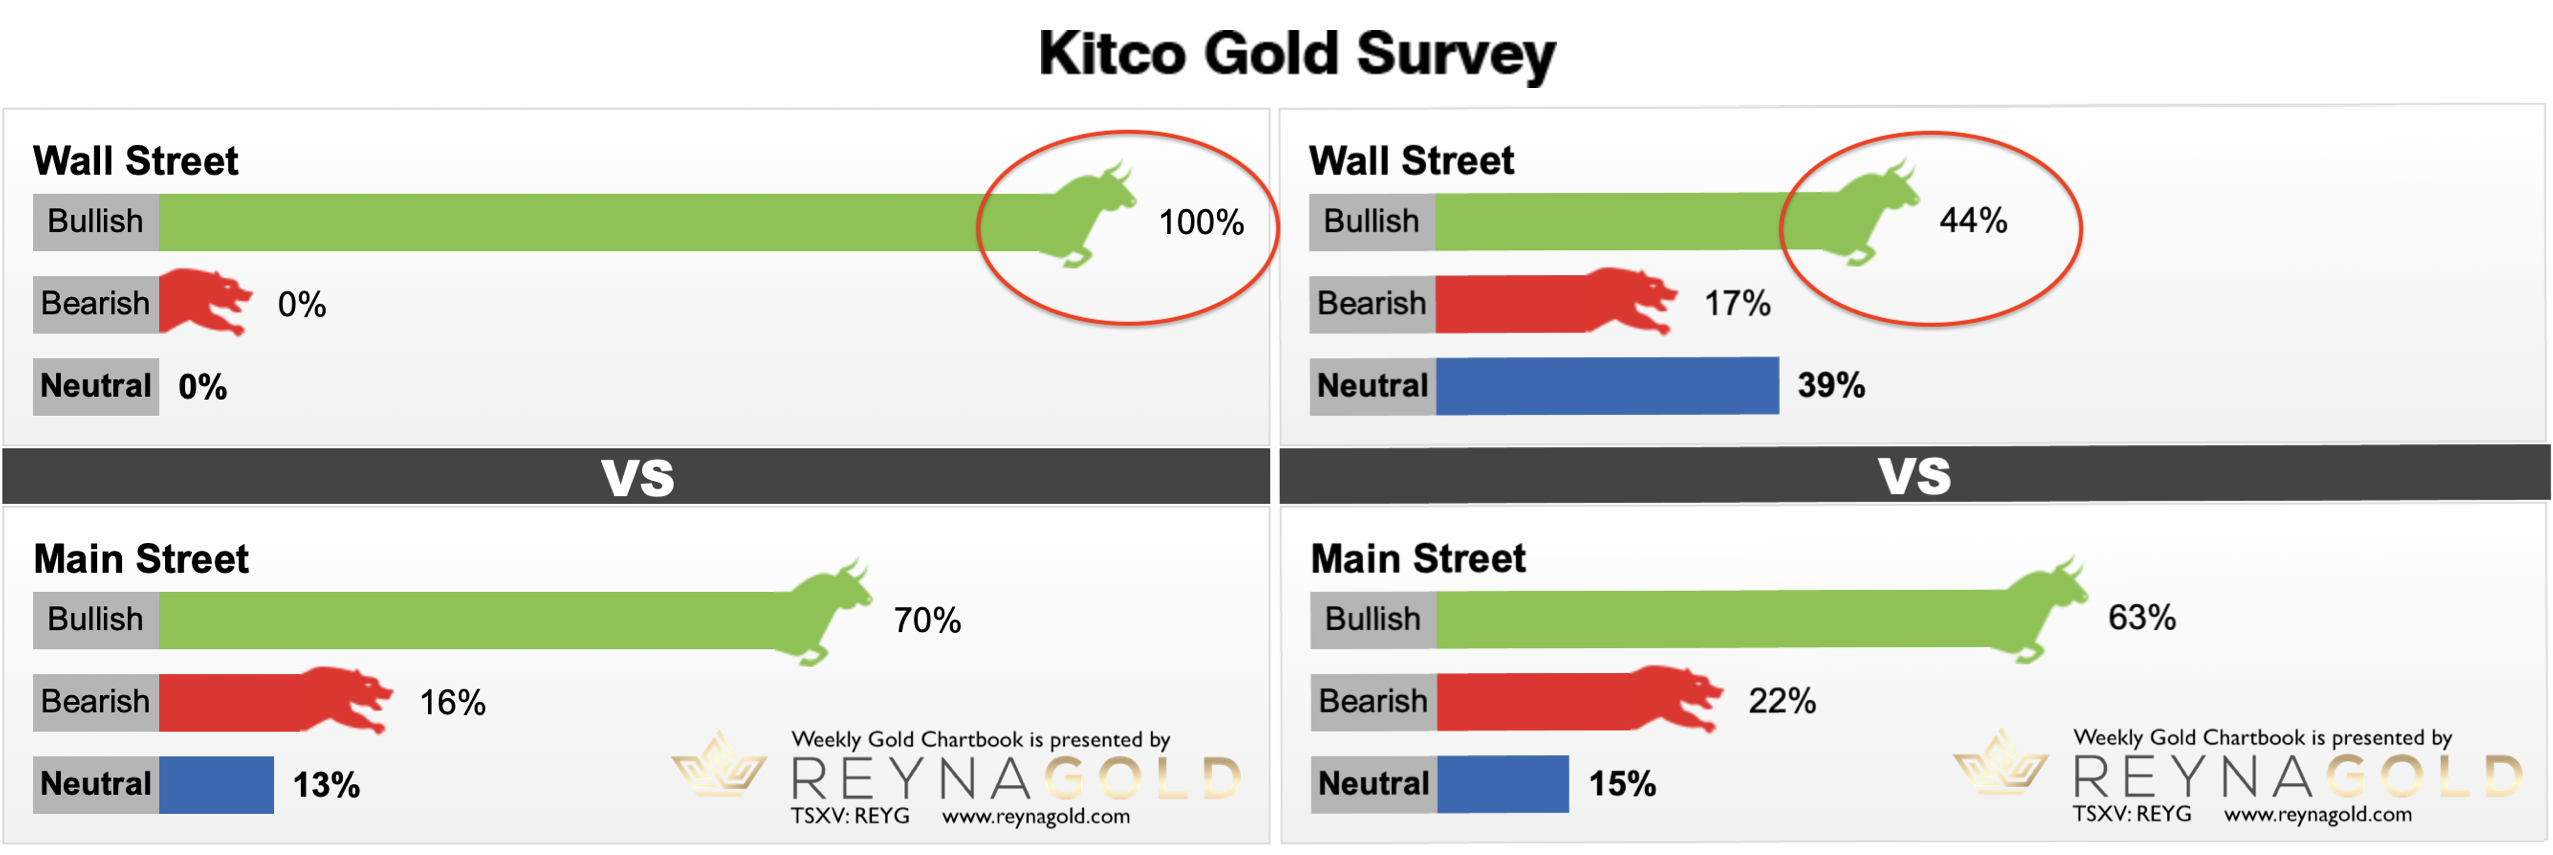
Kitco Gold Survey as of March 4th, 2022 vs. Kitco Gold Survey as of March 11th, 2022.
Looking at the most recent Kitco Gold Surveys, retail money is still rather bullish. But the professionals have performed a strong U-turn over the last week. As you know, sentiment analysis is the king’s path. You get very few extreme signals per year – usually two to sometimes three. This requires a tremendous amount of patience. And often, only a sharp contrarian mindset will actually see them, let alone act on those rare signals.
Obviously, the current reading of the Kitco Gold Survey and the change in expectations among professionals provide a strong warning signal for the bulls!
Conclusion: Spring correction or further escalation?
While the troubling geopolitical developments have somewhat disrupted our roadmap on the upside, the overall price action is in line with our template. From a macroeconomic perspective, the massive and unprecedented sanctions and the resulting imploding Russian economy are certainly deflationary. However, physical gold demand should remain very strong, and commodity prices could continue to explode due to shrinking supply.
From a technical perspective, last week looks like a trend reversal, but the bears need to back up their thesis with new lows below US$1,958. Otherwise, the bulls will surely attack again very soon.
Another observation that we had already mentioned in one of our last chart-books is the fact, that silver still has not shown up at the ongoing party in the precious metals sector. Gold’s little brother usually comes in just shortly before the peak with a strong outperformance, throwing in a few hit records, only to then crush the party completely. This classic pattern has not been observed so far. If silver were to run towards $30 within a few days, for example, we would become extremely cautious. This typical “top signal” is missing so far.
Nevertheless, the risk/reward-ratio for new long trading positions is rather unfavorable, if you plan to hold those paper positions for a few weeks or months. But at the same time, recent developments have once again clearly shown how important long term physical gold and silver holdings indeed are!
To summarize, gold is bullish above US$2,030 while bearish below US$1,960. In between those two numbers, it’s hard to come up with a strong bias.
Feel free to join us in our free Telegram channel for daily real time data and a great community. If you like to get regular updates on our gold model, precious metals and cryptocurrencies you can also subscribe to our free newsletter.
Disclosure: Midas Touch Consulting and members of our team are invested in Reyna Gold Corp. These statements are intended to disclose any conflict of interest. They should not be misconstrued as a recommendation to purchase any share. This article and the content are for informational purposes only and do not contain investment advice or recommendations. Every investment and trading move involves risk, and readers should conduct their own research when making a decision. The views, thoughts and opinions expressed here are the author’s alone. They do not necessarily reflect or represent the views and opinions of Midas Touch Consulting.

