


Gold – The Bull Is Alive!
Since 3rd of September gold and the SPDR Gold Trust ETF are consolidating and correcting. But so far bulls can hold prices above US$1,483. Even though commitment of trades numbers for the gold market are looking terrible, the bull still seems to be alive and kicking! Especially if gold can hold above US$1,480, the bull is alive! There are a lot of indications pointing to a continuation of this rally towards the potential price target of US$1,800 by January or February 2020. Gold – The Bull Is Alive!
Review
After rallying for three and a half months from US$1,265 in mid-May, the gold price peaked at US$1,557 on September 4th. The last five weeks were initially characterized by several attempts to overcome the resistance zone between US$1,550 and US$1,555. Here, however, bulls could not make any progress. The relatively sharp pullback down to US$1,483 therefore came not as a surprise.
At the same time, the pullback of US$75 has been rather shallow and bears have not been able to push gold prices below the massive round support number at US$1,480. Despite the strongly overbought situation back in early September, the bears have made little progress on the downside in the last three weeks. On the contrary, again and again new buyers stepped in on every dip below US$1,500.
Technical Analysis: Gold in US Dollars
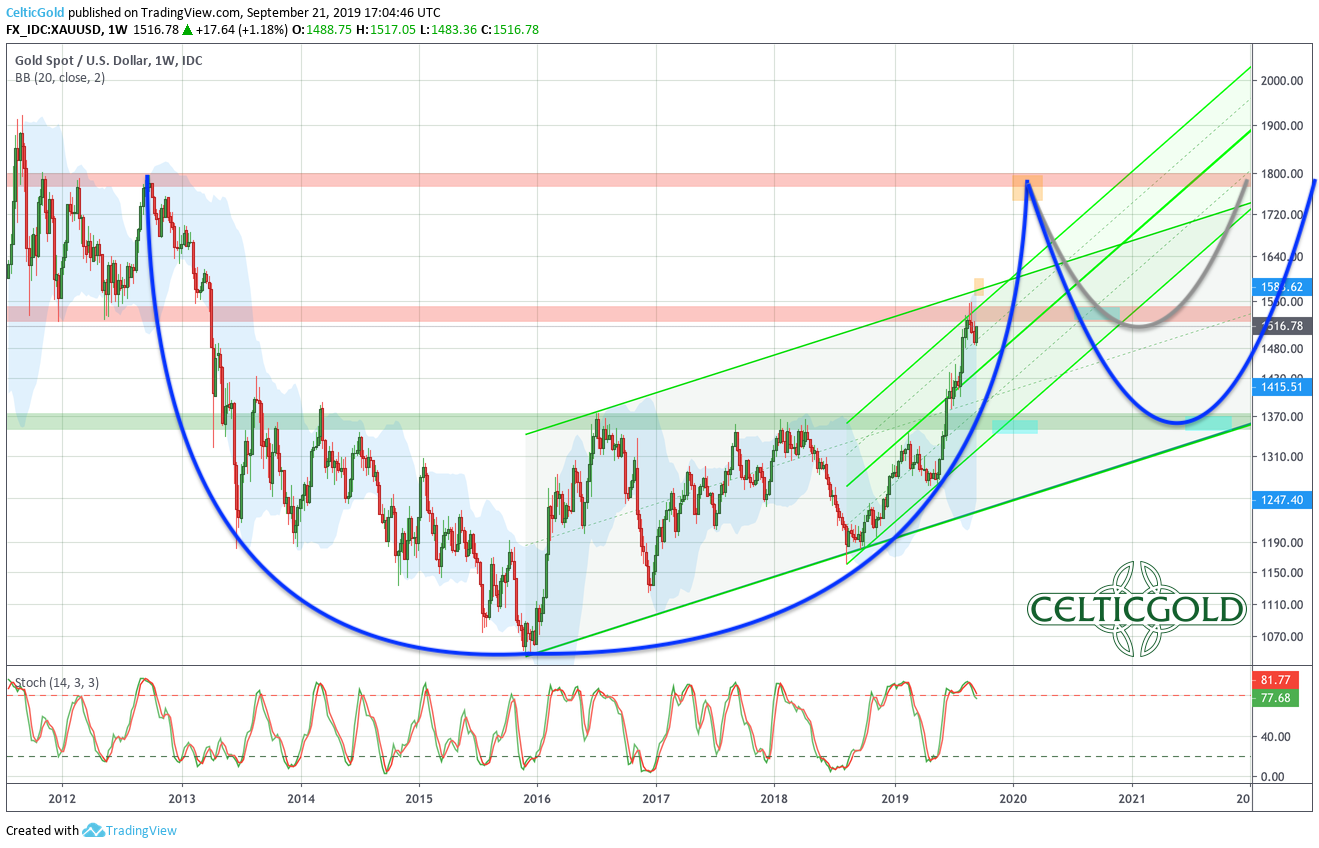
Gold in US-Dollar, weekly chart as of September 21st, 2019. Source: Tradingview
On the weekly chart, the steep rise in price over the last three months has increasingly created the possibility of a huge Cup & Handle formation! Basically, Cup & Handle formations appear as a consolidation in the overall uptrend. Since the 4th Quarter of 2012 the gold price might therefore be tinkering with such a formation already! If the uptrend keeps up its steep rise in the coming months, the price of gold could continue to rise to around $1,800 by January 2020. Although the weekly chart is without question overbought, fundamentally there are currently enough reasons for a continuation of the rally. Indeed, in this context, even a veritable gold rush in the markets is possible in the next three to four months!
Overall, the weekly chart remains bullish. The next price target is US$1,585. The cup and handle formation points towards US$1,800 by January or February 2020.
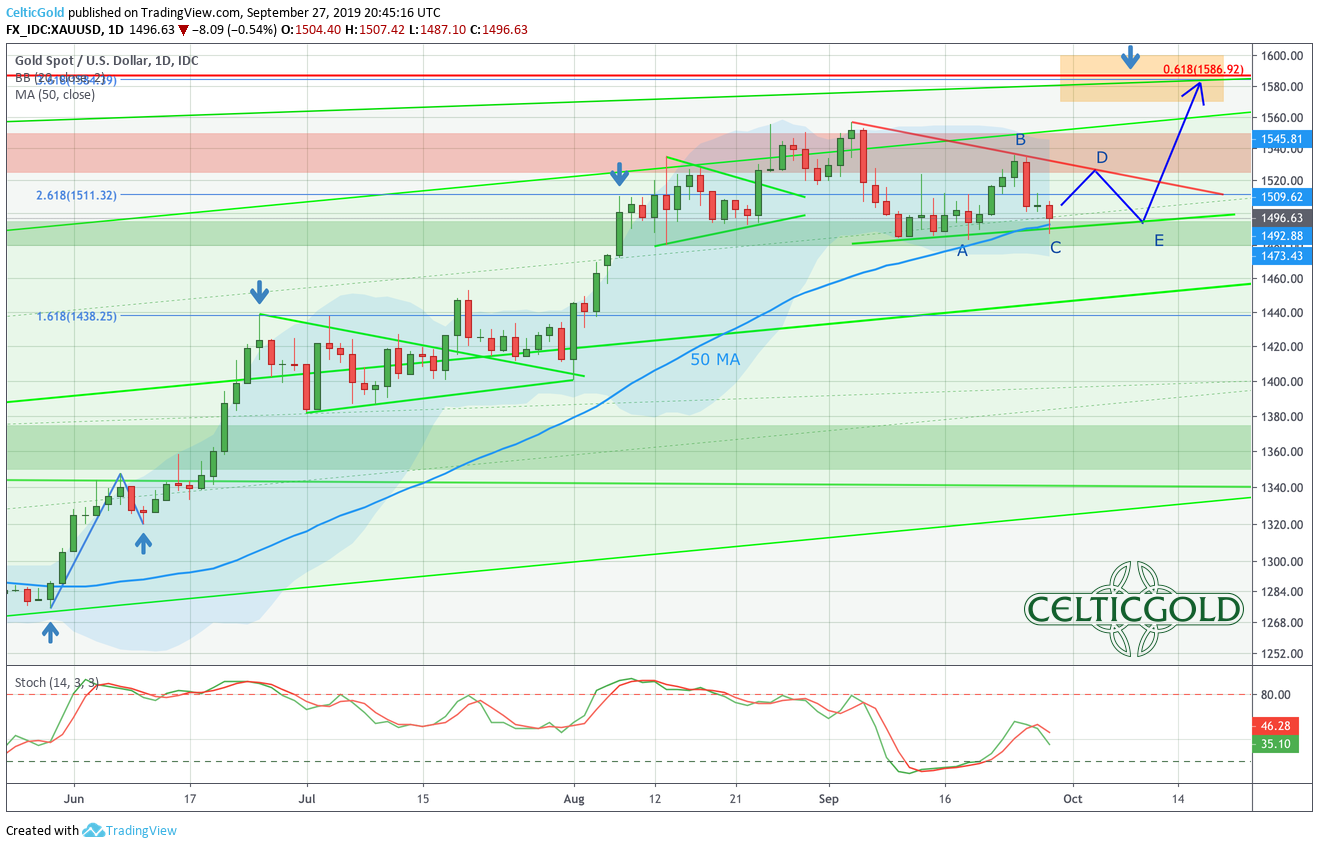
Gold in US-Dollar, daily chart as of September 27th, 2019. Source: Tradingview
On the daily chart, gold came back down hard from the latest recovery bounce. At the same time it has hold above US$1,487 so far. Due to the first pullback, the daily chart had become as oversold as last April! This is more than impressive given the previous gains of nearly US$300. After this week’s bounce to US$1,535, gold is now only slightly oversold.
As strong as gold presents itself even in the second pullback, prices below US$1,480 seem rather unlikely. Actually, gold might be running into a triangle consolidation. If gold can move above US$1,530 again, another attack towards US$1,550 – 1,560 seem very likely. Below US$1,480 however, the bears are getting into control and might be able to push gold prices back towards the breakout level between US$1,350 and 1,380.
Commitment of Traders: Gold
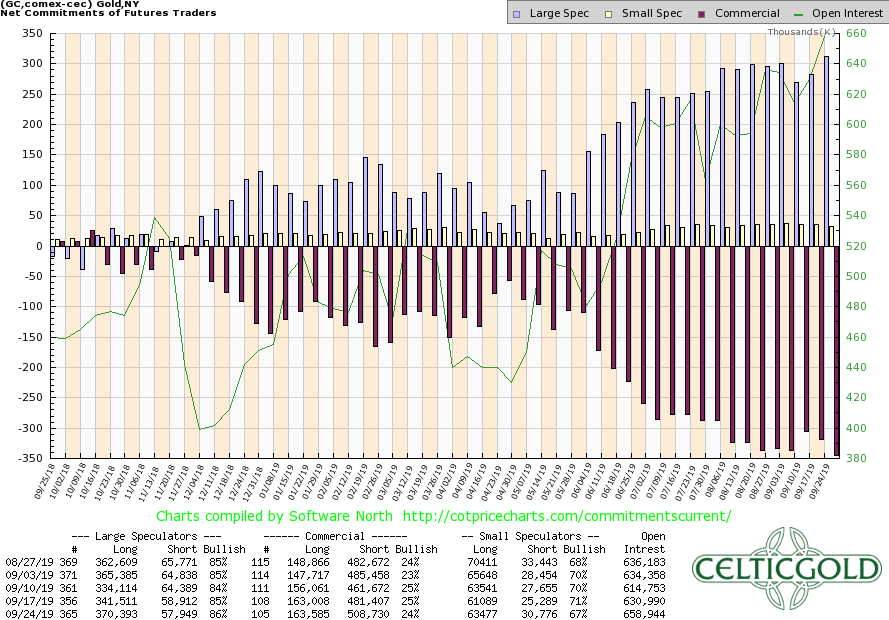
Commitment of Traders for Gold as of September 24th, 2019. Source: CoT Price Charts
Despite the correction over the last three and a half weeks, the situation in the gold futures market has barely improved. As of September 24th with a closing price of US$1,531, commercial traders held a cumulative net short position of 345,145 contracts.
On the other hand, the large speculators so far have only taken small profits off the table and remain with their massive long positions.
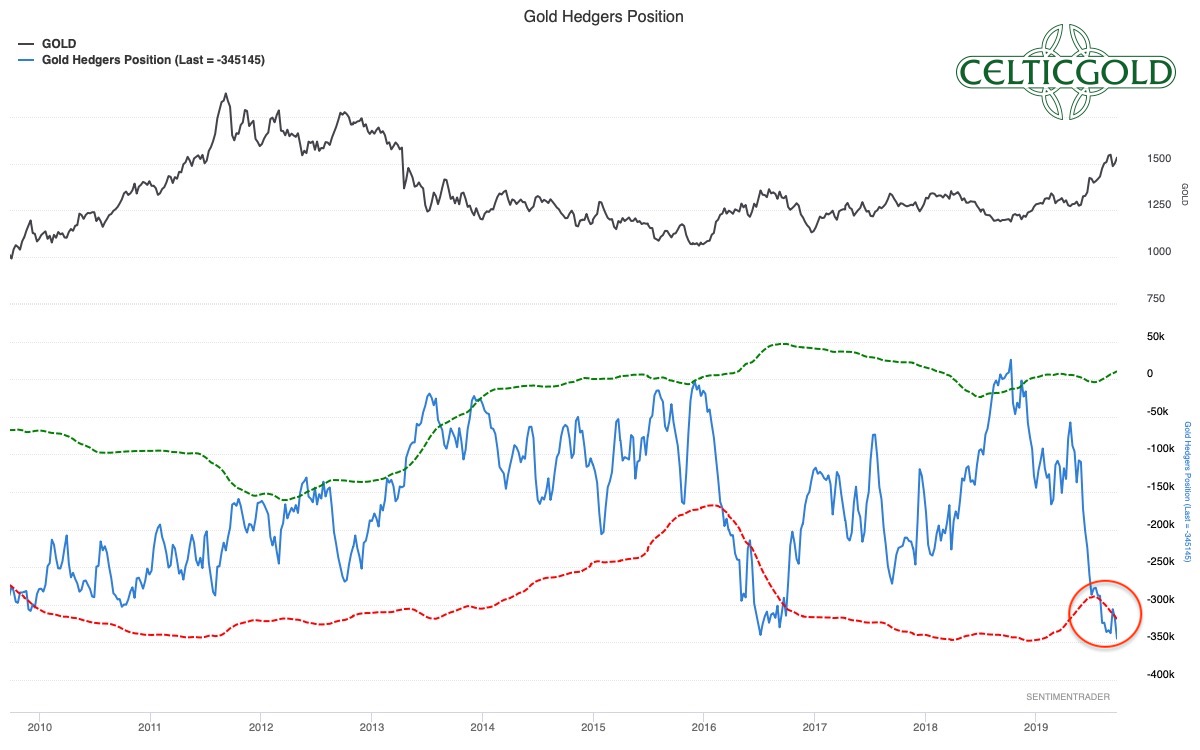
Commitment of Traders for Gold as of September 27th, 2019. Source: Sentimentrader
Overall, the dark red warning signal from the futures market remains. In a gold rush, as it presently may develop, the commercial short position can still increase. In particular, the strong demand from the gold ETFs is currently setting the tone.
To summarize, the Commitment of Traders Report is currently sending a dark red warning signal.
Sentiment: Gold
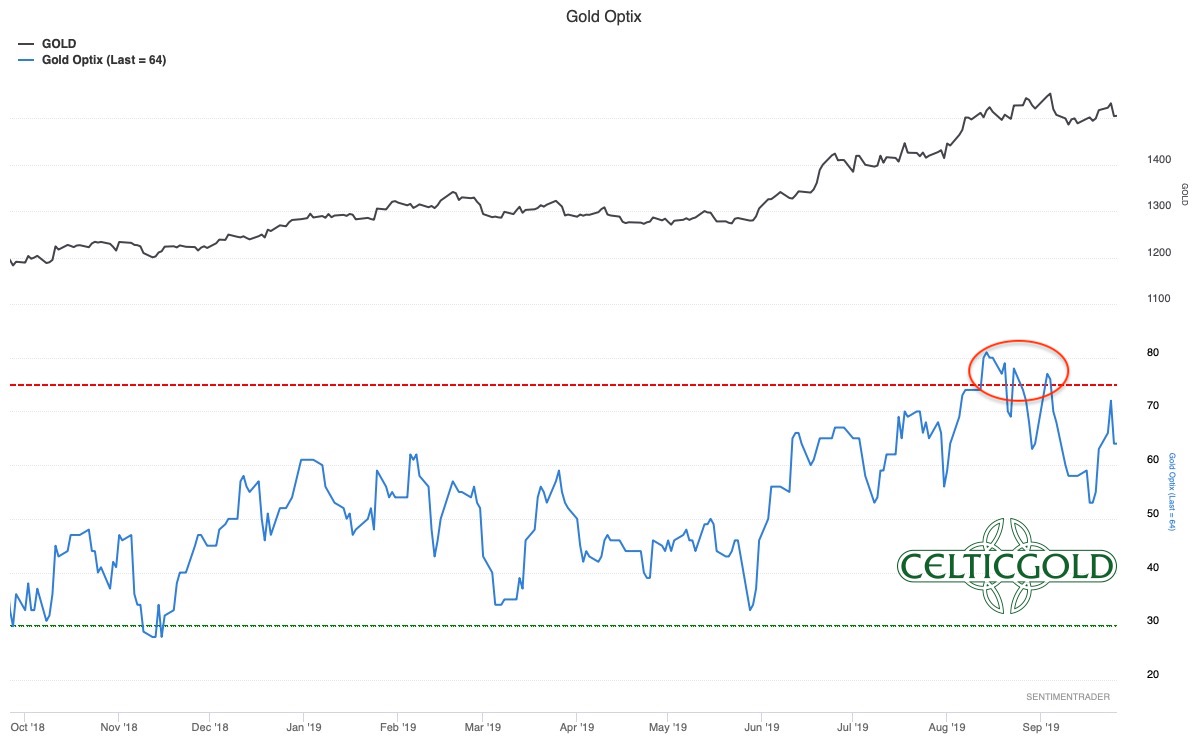
Sentiment Optix for Gold as of September 27th, 2019. Source: Sentimentrader
The sentiment data reported by Sentimentrader in early September showed too much of euphoria among market participants. The pullback in the last three and a half weeks however had already led to a complete cleansing of the sentiment. Now that gold is retreating back to the US$1,500 level again due to the recent bounce the mood is still slightly too bullish.
Remarkable are the many bearish analysts, most of whom expect a much deeper correction in the gold market and do not trust that we are in a new bull market. In summary, the sentiment analysis currently comes to a neutral conclusion.
Seasonality: Gold – The Bull Is Alive
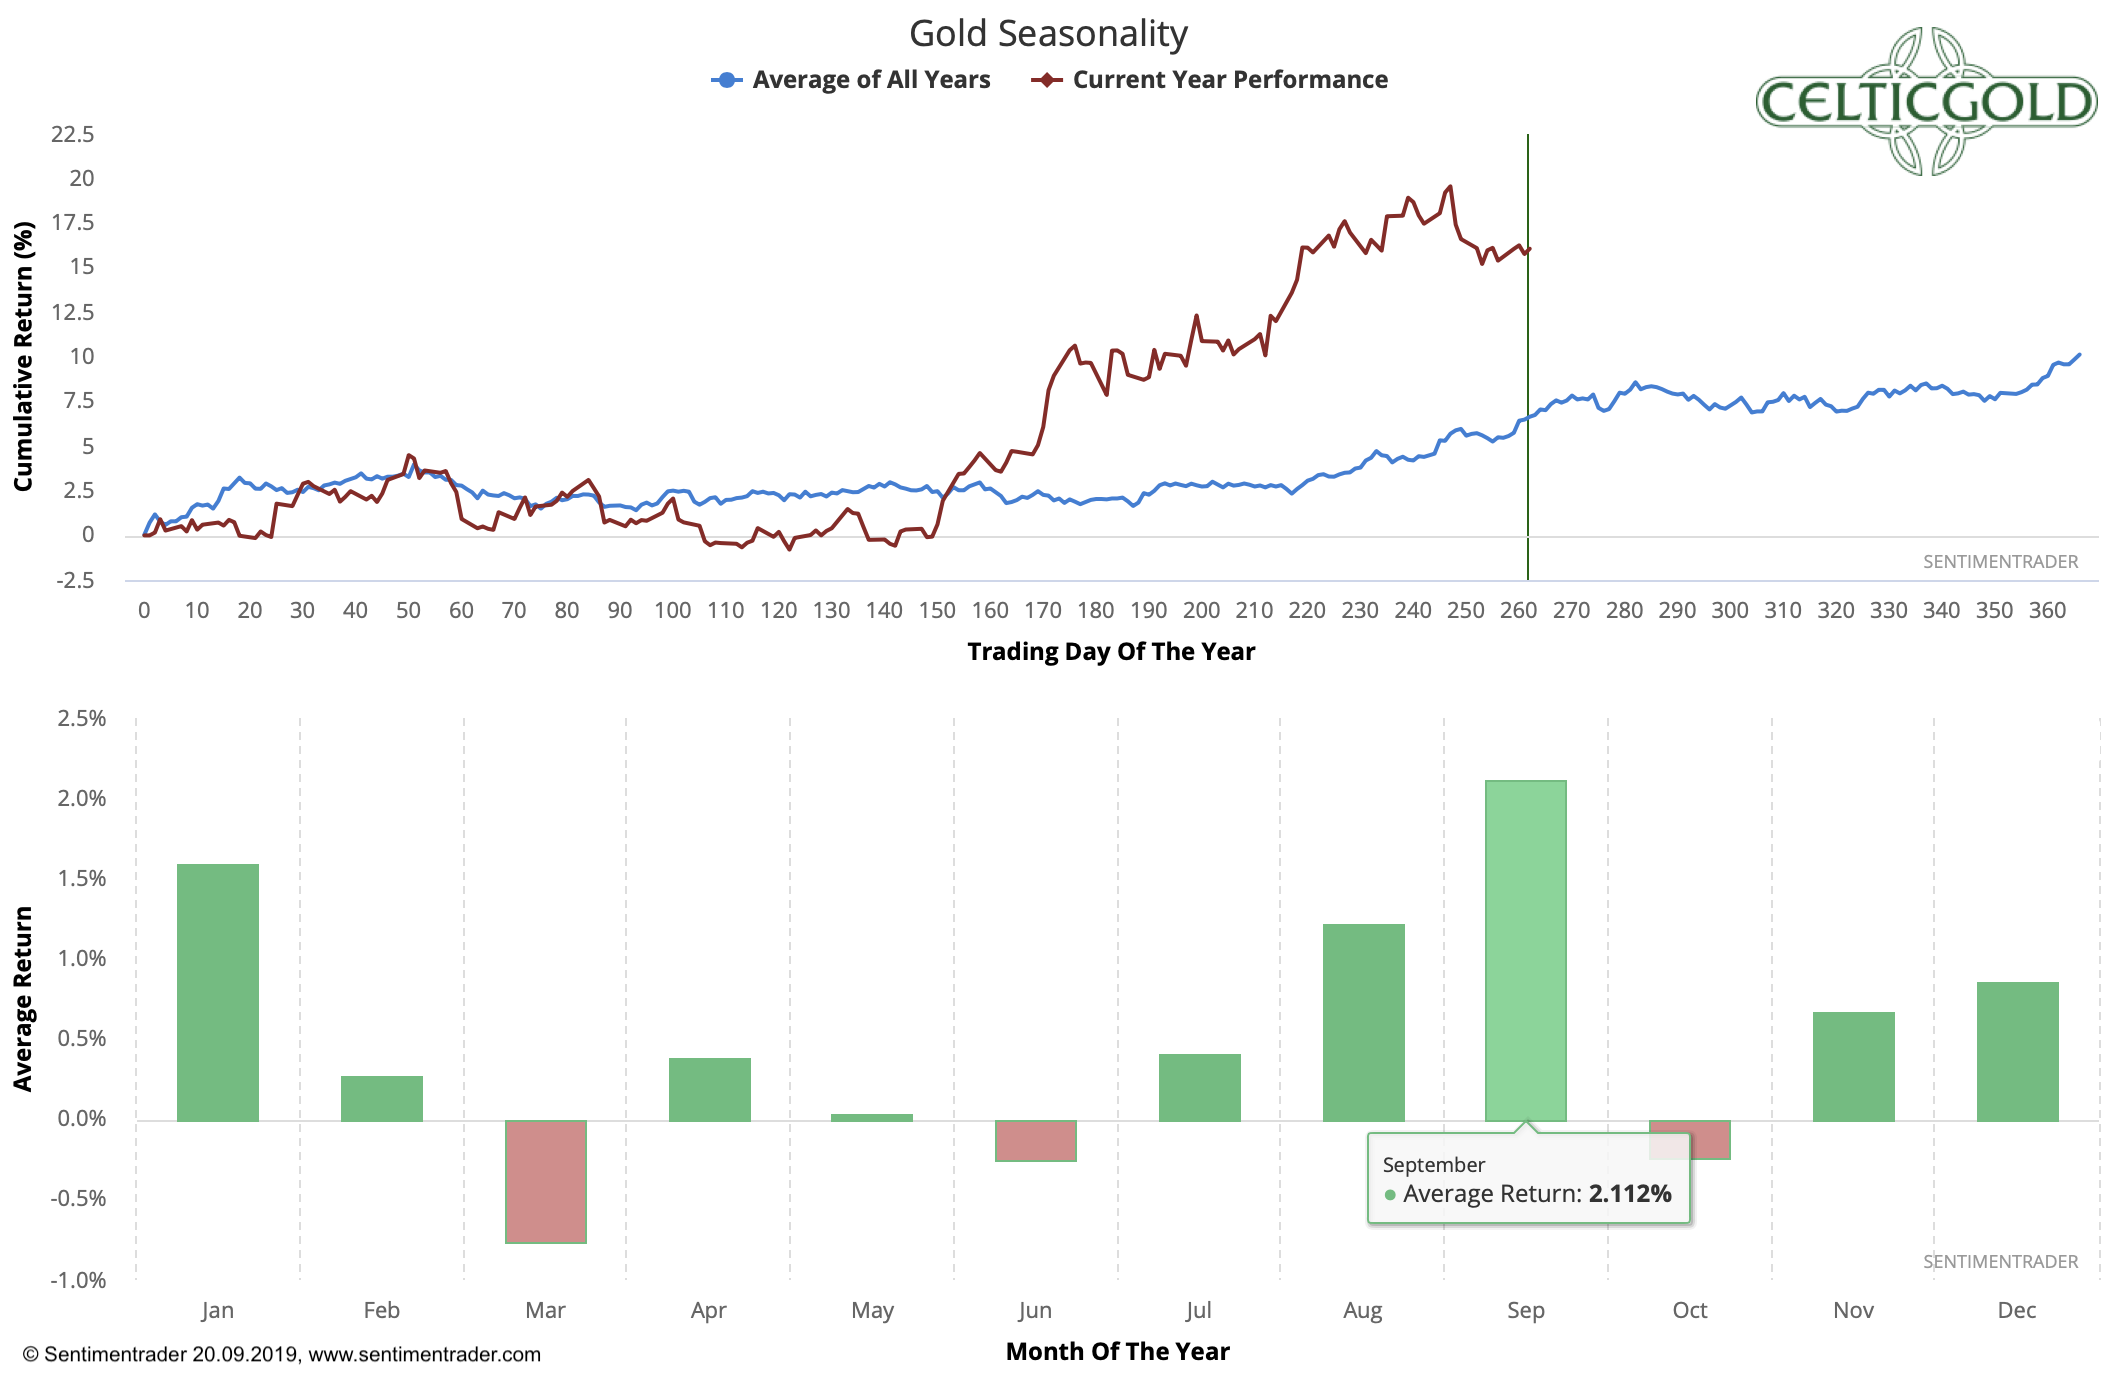
Seasonality for Gold as of September 21st, 2019. Source: Sentimentrader
This year the gold price began its typical “summer rally” statistically more than a month too early! Accordingly, the current correction generally fits well into the pattern, only that it takes place in September instead of October. If the price of gold adheres to the statistical trend, it would have to return to rising prices in October. In addition, the continuation of the rally until the end of the year would be realistic too. The “grande finale” of this rally would be expected in January, as the seasonal gold price usually peaks between February and March.Should the seasonality be postponed by one month this year, the current correction could find its end in about one to three weeks.
Bitcoin in Gold
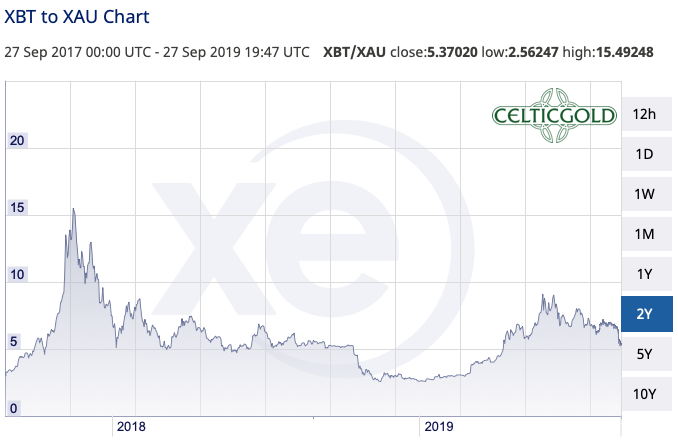
Bitcoin in Gold as of September 27th, 2019. Source: XE
As expected, Bitcoin (BTC-USD) has been coming down hard! The exchange ratio to gold now trades at 5.36 ounces of gold. In other words, you currently have to pay just 0.186 Bitcoin for an ounce of gold.As Bitcoin closed its open gap at US$8,500 while Gold is about to end its correction soon too, if at all it seems advisable to buy some bitcoin against gold. However, there are currently no extreme exchange ratios!
Generally, buying and selling Bitcoin against gold only makes sense to the extent that one balances the allocation in the two asset classes! At least 10% and a maximum of 25% of one’s total assets should be invested in precious metals (mostly physically), while in cryptos and especially in Bitcoin one should hold at least 1% and a maximum of 5%. If you are very familiar with cryptocurrencies and Bitcoin, you can individually allocate higher percentages to Bitcoin. For the average investor, who is also invested in equities and real estate, 5% in the highly speculative and highly volatile Bitcoin is already a lot!
Conclusion and Recommendation: Gold – The Bull Is Alive
Faced with renewed interest rate cuts, foreseeable monetary concerns and growing tensions in the financial markets, it would be foolish not to rely on the protection of gold.
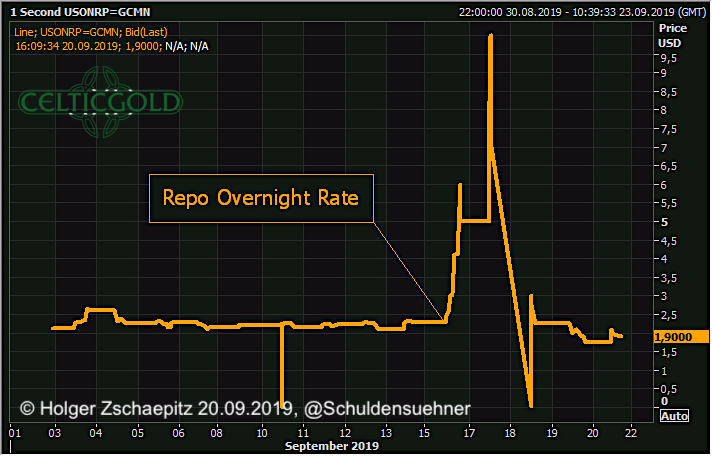
Source: Holger Zschaepitz
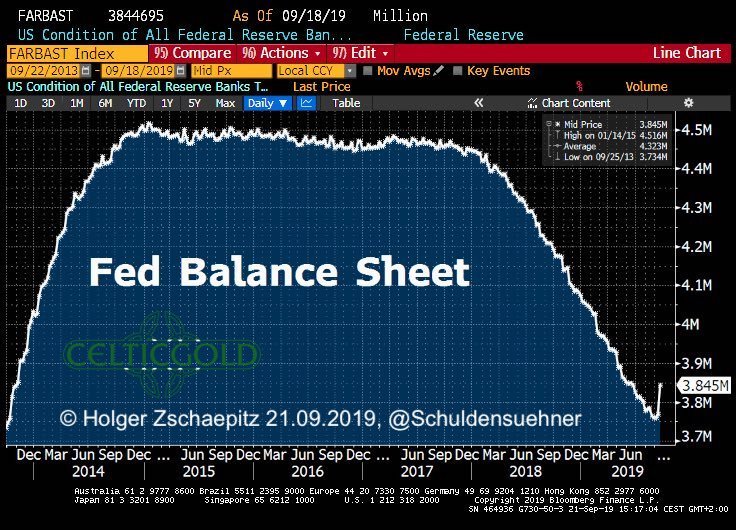
Source: Holger Zschaepitz
Although the US Federal Reserve has already cut interest rates twice this year, the centralbankers had to intervene massively in the money markets the last two weeks to stabilize the so-called repro rate. Up to US$75 billion was pumped into the system several times during the last two week! By October 10th, the FED wants to provide another US$75 billion a day for overnight stays. Thus, the “Quantitative Tightening” launched by the FED since the end of 2017 has come to a definite end. In order to absorb the stumbling financial markets, the central bankers have to massively expand the balance sheet again. For gold, these are ideal conditions.
Looking at the charts, the bullish trend is intact and the strength of the bulls is obvious. If gold is indeed tinkering with a cup & handle formation, the uptrend will accelerate in the coming months. Then gold could actually see the US$1,800 mark by January. Here, however, I do not only expect the end of the run up but also the beginning of an approximately two-year and painful correction with price targets in the range of US$1,500 and probably even US$1,350 – US$1,380.
Short-term and below US$1,480 on the other hand, the previously relatively shallow pullback will gain momentum and might trigger price targets of US$ 1,450 and US$1,380.
Source: www.celticgold.eu
If you like to get regular updates on our gold model, precious metals and cryptocurrencies you can subscribe to our free newsletter.

