


Long silver – when and why?
On the first of this month we posted live in our telegram channel a silver long entry for the 60 minute and the daily time frame. Prices didn’t retrace to our desired entry level just by a hair. In this weeks chartbook we will share a way of a confirmed “late” entry technique, if such an occurrence should ever happen to you. Long silver – when and why?
60 minute chart, silver/US Dollar 10/1/2019, “the entry” :
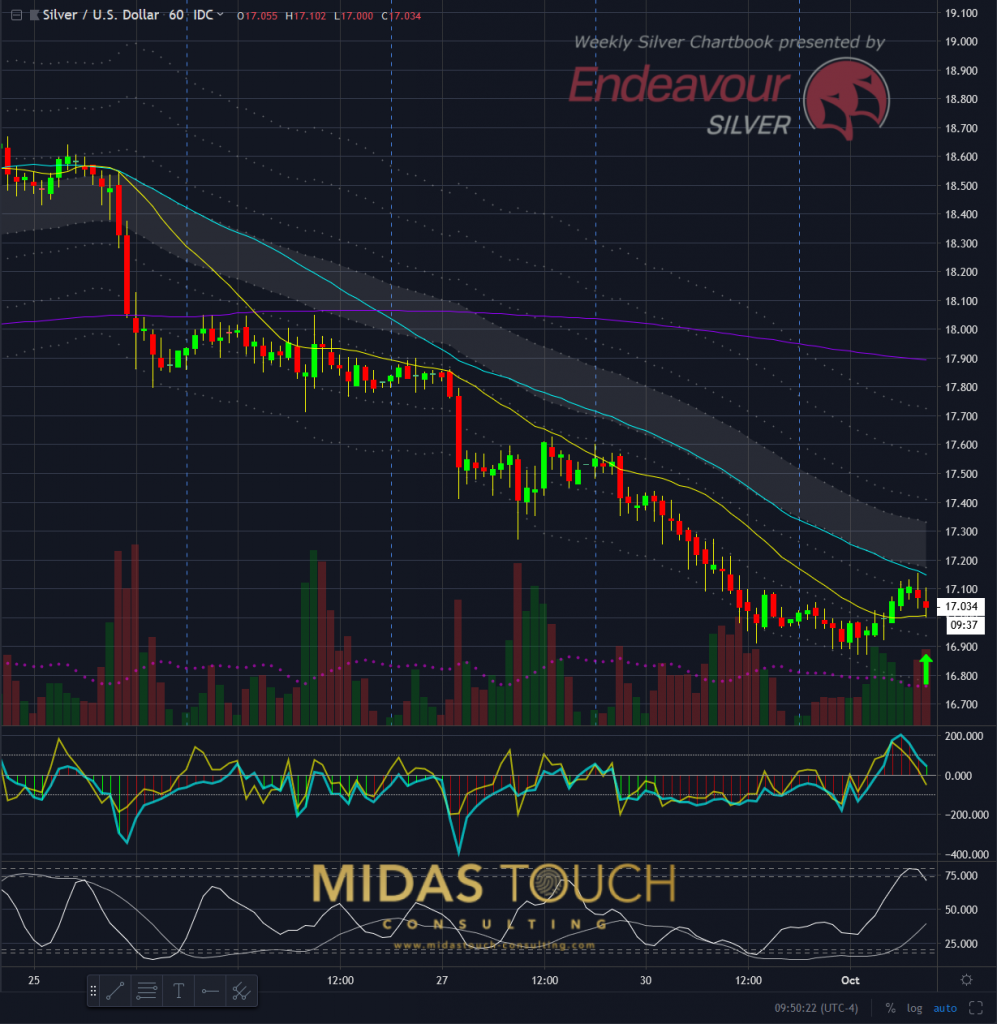
Silver in US-Dollar, 60 minute chart as of Oct 1st, 2019
The above 60 minute chart represents our silver long entry on October 1st 2019, that we posted live. We engaged into the market both on the 60 and the daily time frame since we considered this entry point significant.
Long silver – when and why? Silver, daily chart, 10/01/2019, “Why?”:
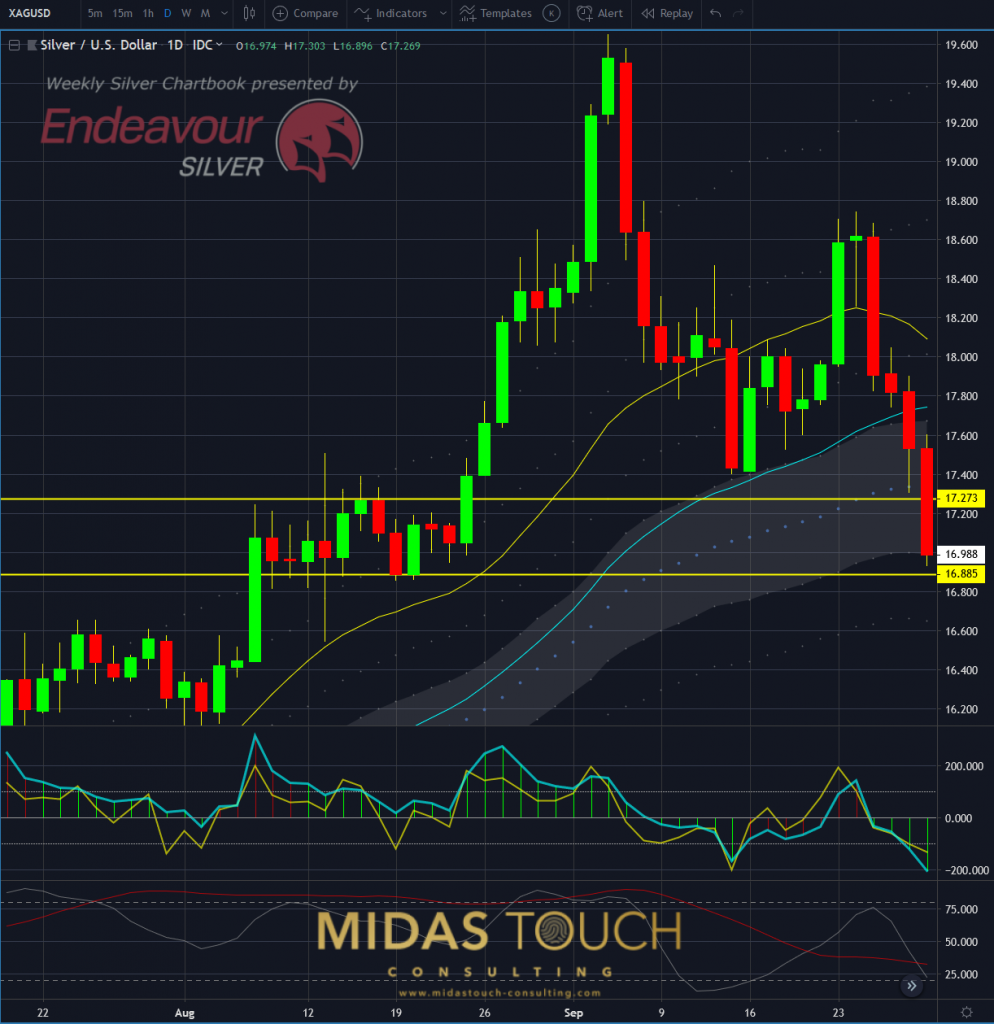
Silver in US-Dollar, daily chart as of Oct 1st, 2019
In the daily chart above you can see a preceding substantial decline of silver prices over the past four days right into a congestion zone from last August. Unfortunately so our desired entry level marked in the lower horizontal yellow line did not get reached. Lows of the day on October 1st were $16.896 and our limit order was set at $16.885.
Missing out of a significant opportunity by literally a cent in this case can be very frustrating. Emotions evoked from such occurrence could lead to wrong entry management. It is important to have a backup plan. A defined strategy for a possible “late” entry.
Silver in US Dollar – October 1st 2019, 60 minute chart, “When?”:
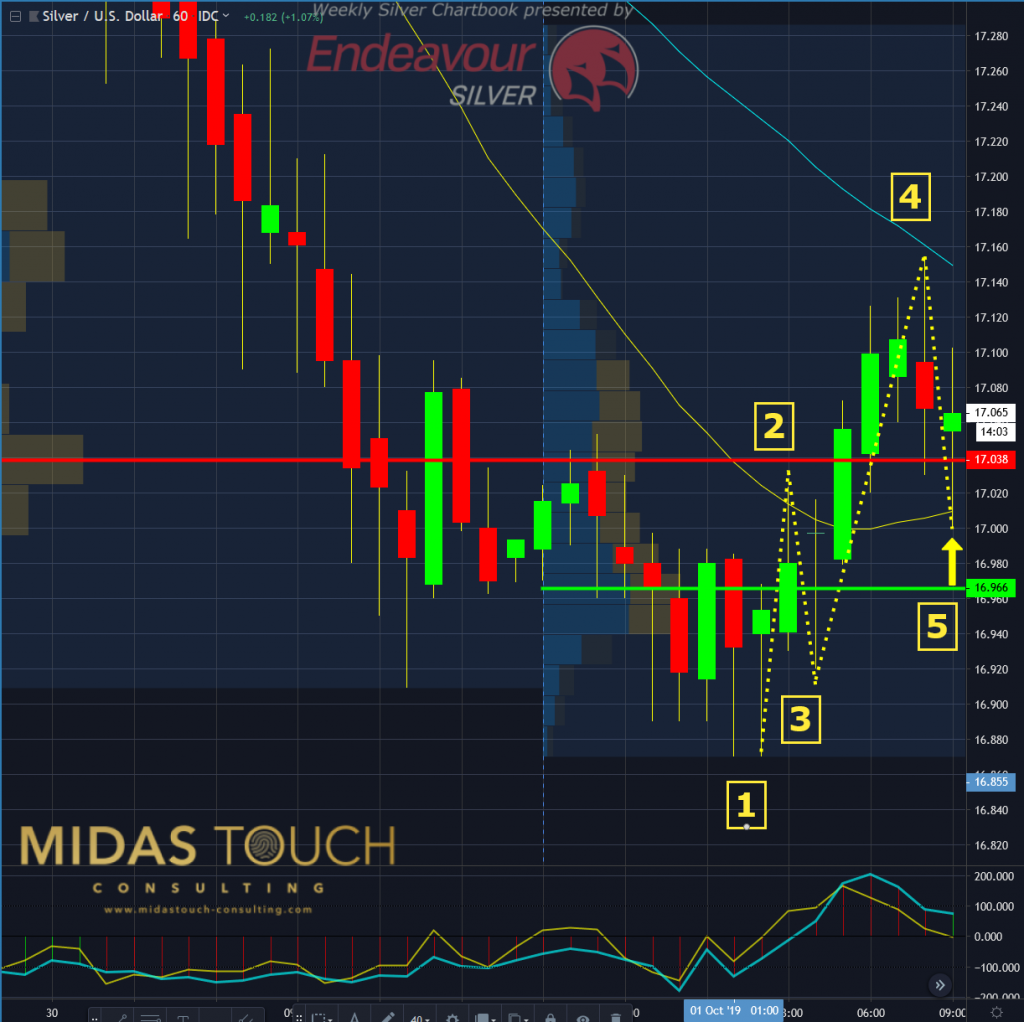
Silver in US-Dollar, 60 minute chart as of Oct 1st, 2019 b
Two days are represented in the 60 minute chart above. September 30th and October 1st (seperated by a dotted vertical blue line). The market profile indicator used in this chart shows with the red horizontal line POC (point of control, a noteworthy supply and demand zone based on significant up/down volume) of September 30th. POC for October 1st, at the time of entry, is represented in the horizontal green line.
Follow the yellow dotted line:
1. Prices move from their lows of the day through POC (Oct 1st, green line)
2. Prices bounce from POC (Sep 30th, red line)
3. Prices bounce from POC (Oct 1st, green line) and penetrate resistance (POC, Sep 30th, red line)
4. Prices retrace towards POC (Sep 30th, red line), what was resistance has become support
5. Long entry for high probability second leg up with very low risk = tight stop
Silver, 60 minute chart, 10/01/2019, taking out the risk entirely:
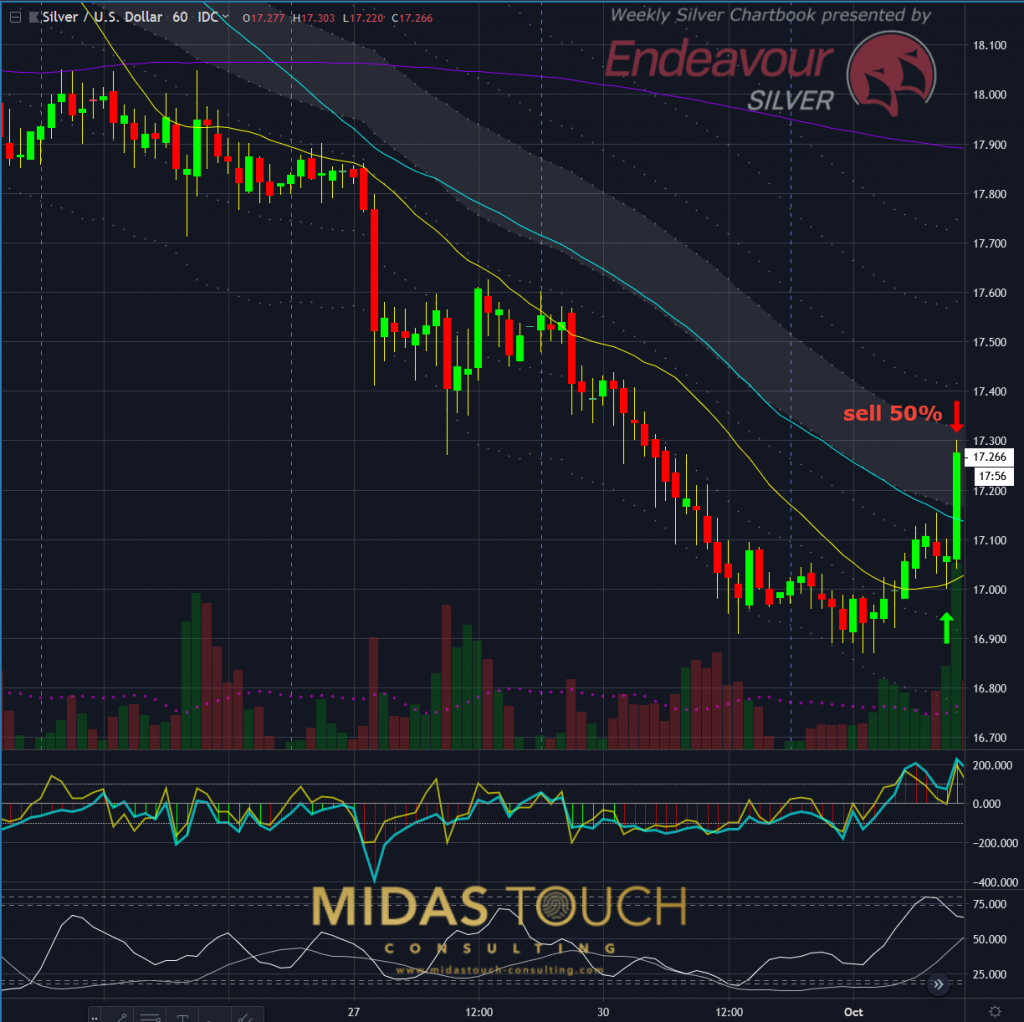
Silver in US-Dollar, 60 minute chart as of Oct 1st, 2019 c
Minutes later we were fortunately able to already eliminate risk entirely by exciting half of our position based on our quad exit strategy. Shortly after that we were able to do the same in our daily time frame position, once the upper range of the August trading range was reached.
No one can predict the outcome of an individual trade. Luckily no one has to. As long as one is right more often than not on a low risk basis, consistency in market money extraction is possible. What this requires is a tool box for each and all possible scenarios. Today’s “late entry method” is one such tool in a traders tool box to improve ones path towards success.
Follow us in our telegram channel.
If you like to get regular updates on our gold model, precious metals and cryptocurrencies you can subscribe to our free newsletter.

