Silver – Consolidation before the summer rally
After a strong rally lasting several months, the price of silver reached its highest level since December 2012 on Whit Monday at USD 32.51. Over the last six weeks, however, silver prices have corrected back below the psychological mark of USD 30 reaching a low at USD 28.55. Nevertheless, the bears were not able to create any strong selling pressure, as premiums on physical silver in Shanghai are still above 13%, continuing to support the silver market. Hence, these low silver prices were only temporary and within a week silver was able to recover up towards USD 30.66 as of yesterday.
China rules the price discovery in precious metals

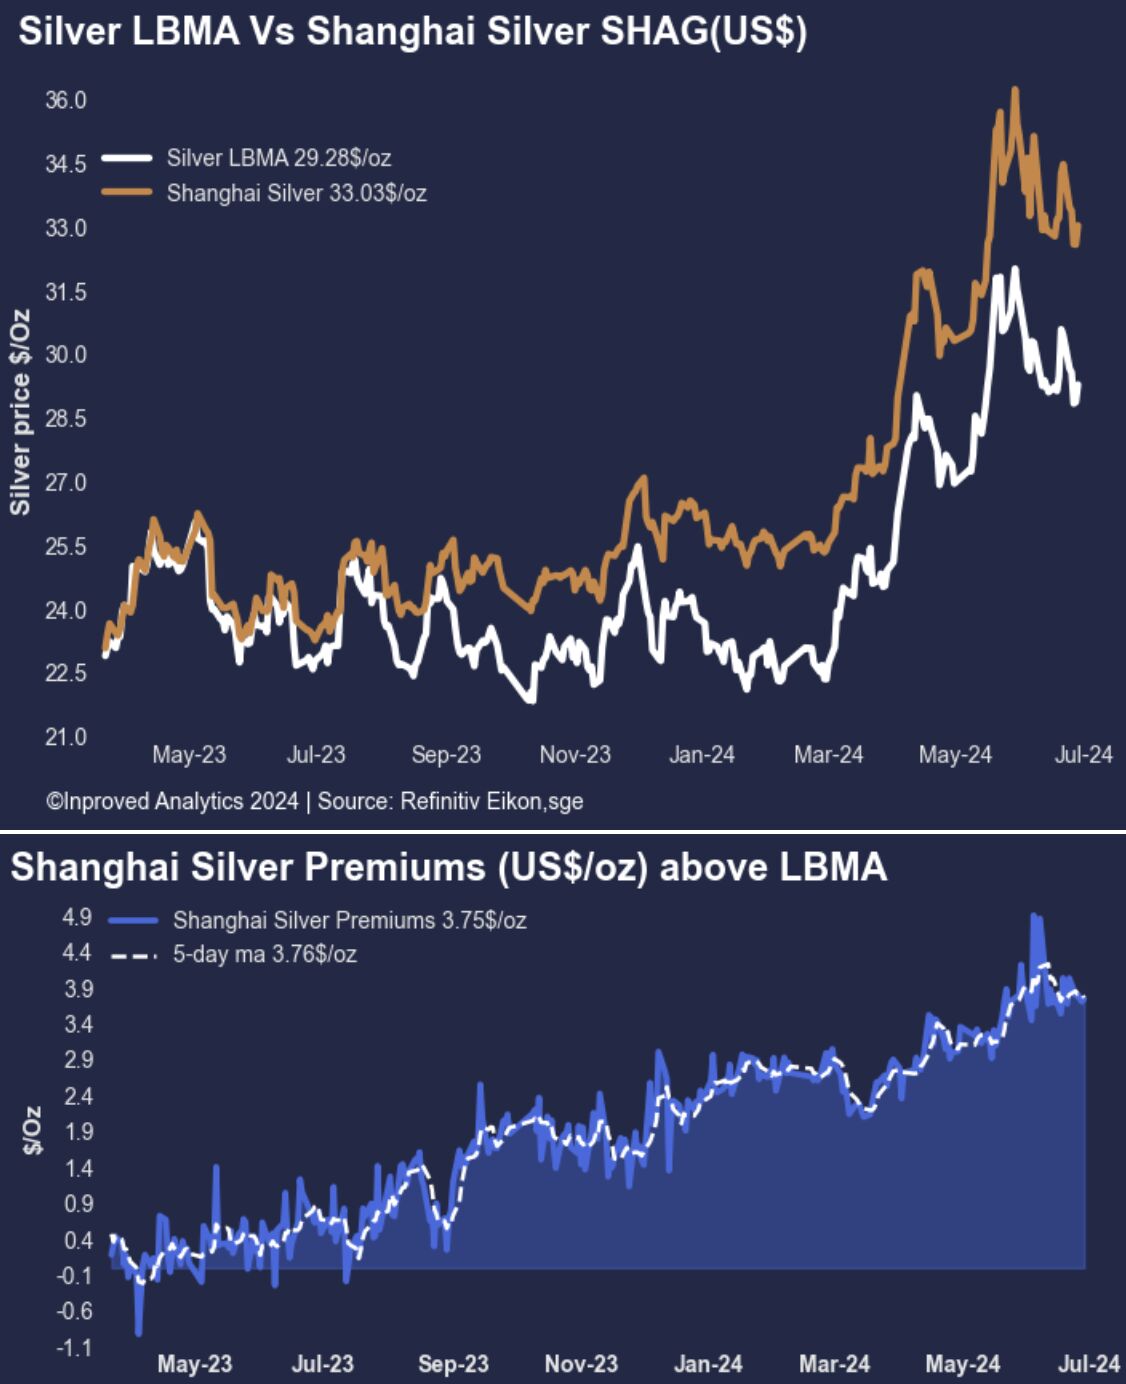
Silver LBMA vs. Shanghai Silver, as of July 1st, 2024. Source: Inproved Analytics 2024
As of July 1st, premiums on the Shanghai Gold Exchange for physical silver remained at USD 33.03, almost USD 4 per ounce, well above the world market price and thus above Western silver prices. This still indicates strong local demand and limited availability of physical silver in China. The persistently high premiums in Shanghai have already supported the strong rise of gold prices since October 2023 and have also forced the accelerated uptrend in silver since the beginning of March.
In particular, strong industrial demand from the solar industry in China and India has decimated physical stocks on the Chinese market. This development could in principle lead to a “short squeeze” on the COMEX at any time, as the high premiums in China create arbitrage opportunities and increase the flow of physical silver eastwards. Basically, the Chinese market is increasingly influencing the price discovery of silver, while manipulation on Western commodity exchanges through unbacked paper silver is coming under increasing pressure.
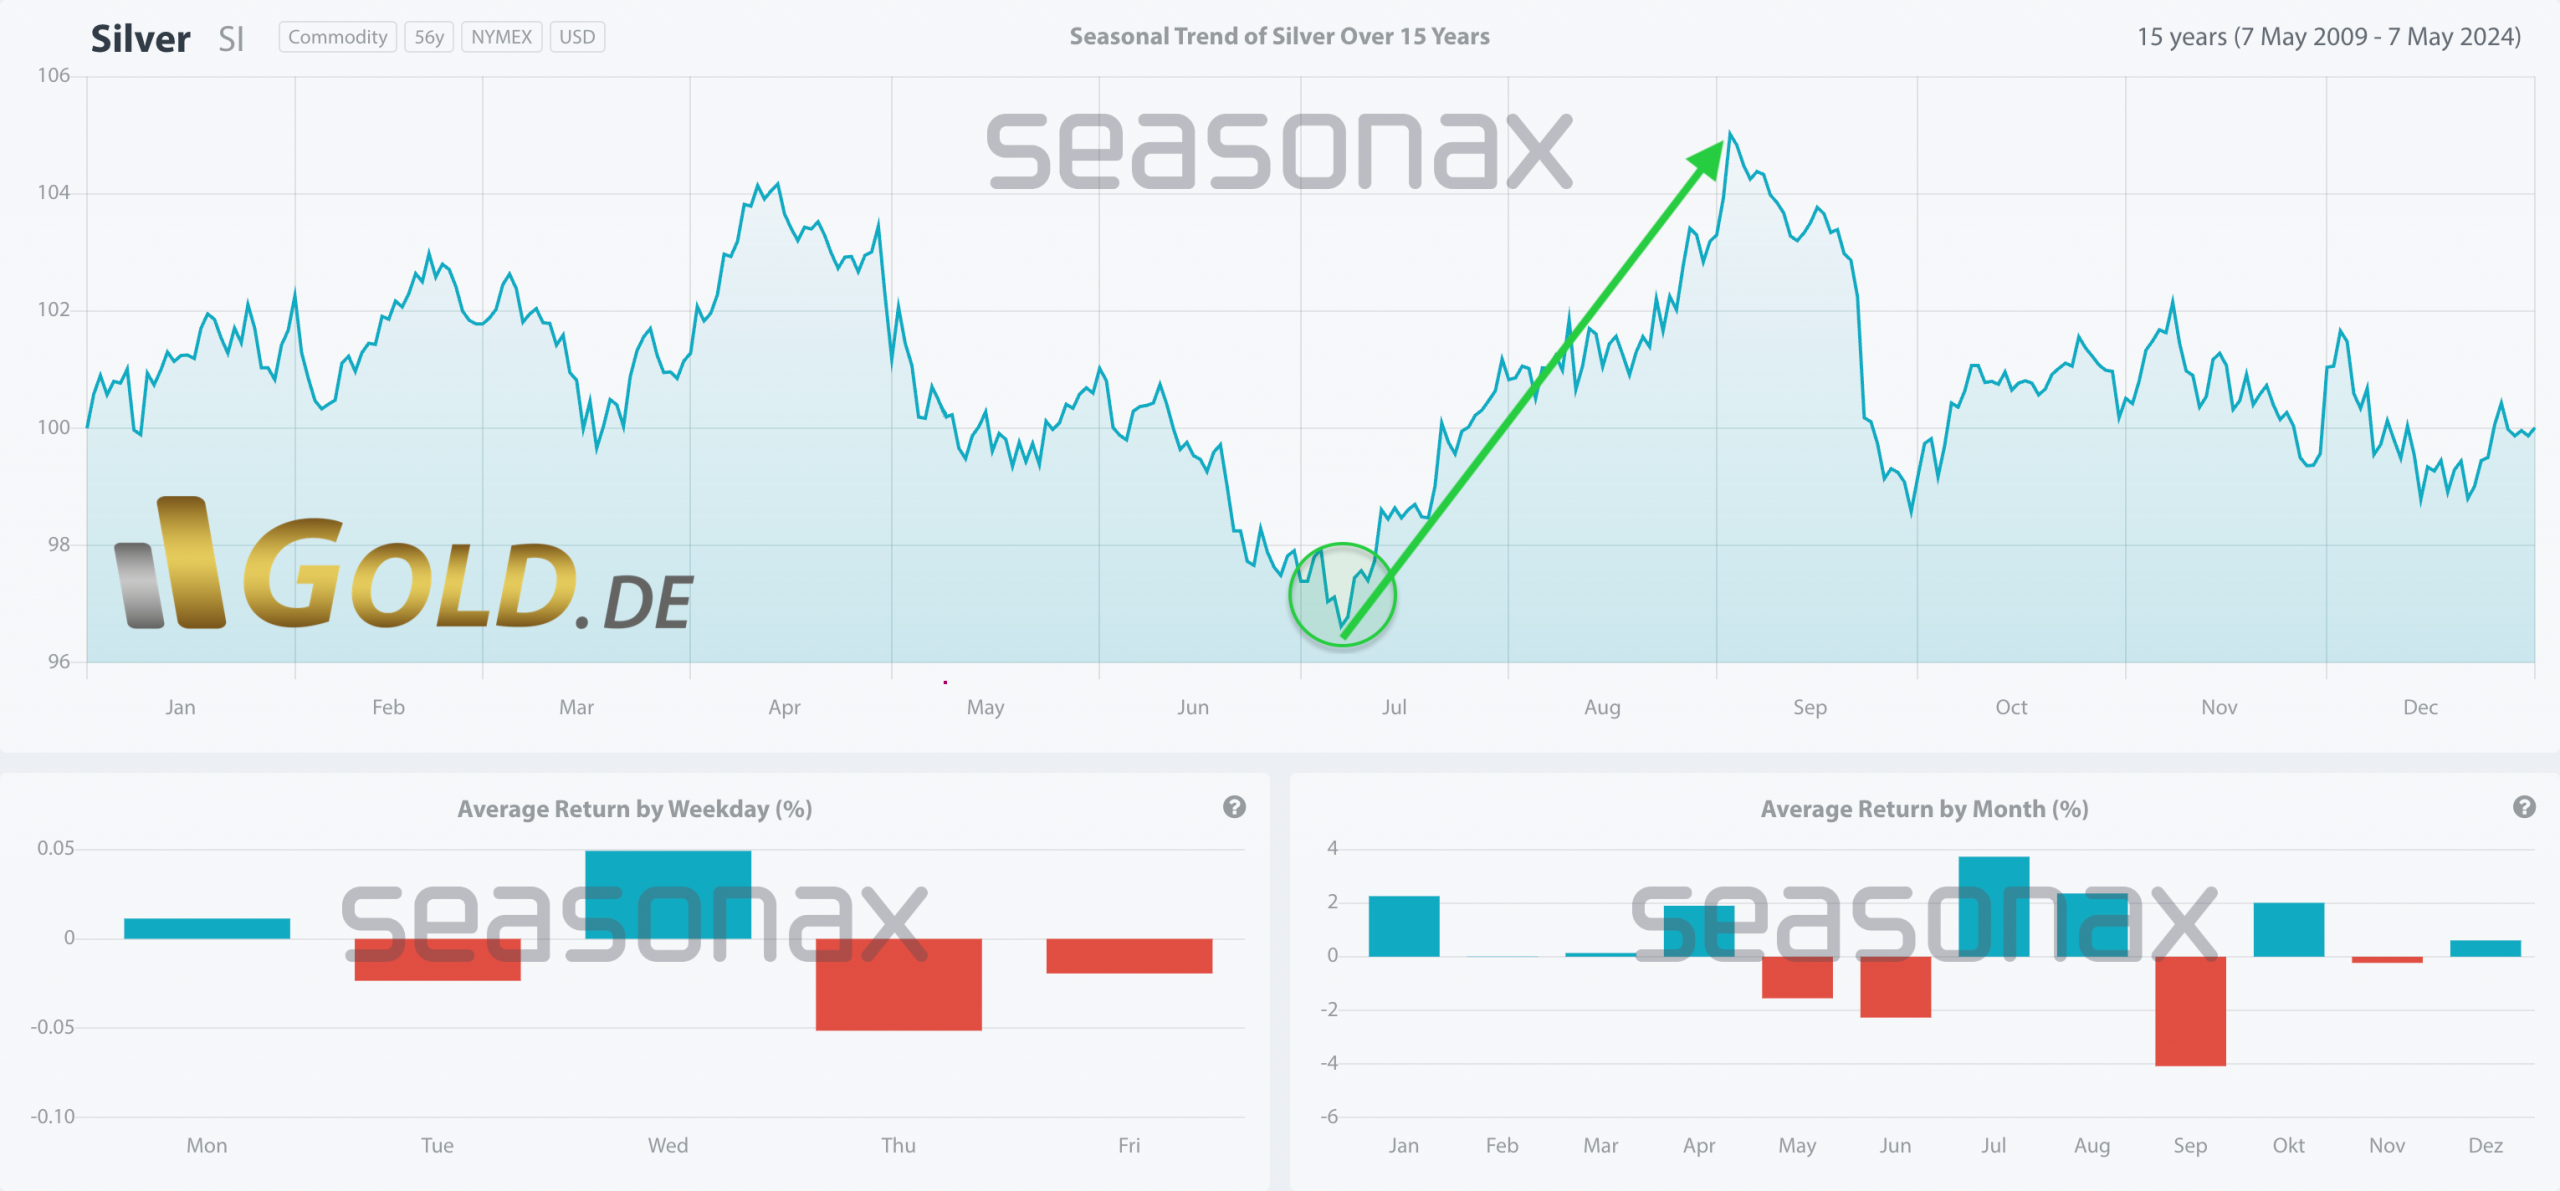
Nevertheless, this should not lead you to blindly switch to the camp of the perma-bulls. Even with this strong fundamental driver behind it, the price of silver can and will experience ups and downs. The overall rather unfavorable seasonality of the precious metals could continue to prevail until late autumn. In July and maybe August, the sector might experience a summer rally though.
A 2008 style liquidity crunch would hurt everything except the US dollar
Given the increasingly unstable bubble in tech stocks, major disruptions in the financial system could also lead to liquidity bottlenecks, which would then temporarily put pressure on everything except the US dollar. Only when the Fed has to rush to the markets’ aid again by cutting interest rates and expanding the money supply will precious metal prices likely explode.
The current US monetary policy, however, remains cautious and not expansionary after eleven interest rate hikes in a row and an interest rate pause since July 2023. Instead, new liquidity came primarily from government spending programs and economic stimulus packages that were pumped into the US economy through fiscal policy. This factor will probably continue to weaken until the US election as the current administration is step by step becoming a “lame duck” with less influence and limited time left while focus will narrow in on the campaigns for the presidential election in November.
We therefore continue to maintain the patient and rather cautious approach we have gradually adopted over the past two and a half months, both from a macroeconomic and seasonal perspective.
Silver in US Dollar – Daily Chart

Silver in US-Dollar, daily chart as of July 4th, 2024. Source: Midas Touch Consulting
Since February 28th, starting from a low of USD 22.27, silver had experienced a significant upward movement within a five wave structure. This uptrend reached a peak of USD 32.51 on May 20th, after which the rally has either been temporarily interrupted or concluded. Since this high, silver prices declined by 12.14%, reaching a low at USD 28.56 on June 26th. Although this low was slightly lower than the previous low of USD 28.65 on June 13th, there was no follow through to the downside. In fact, the bears were not able to generate strong downward momentum and selling pressure.
Hence, as long as the broad support zone between approximately USD 29 and USD 28 can be defended, a tricky but very healthy consolidation at elevated levels can be assumed. However, if silver prices break through this support, the technical outlook would increasingly turn bearish. A breach of this support would further reinforce the active sell signal on the weekly chart (not shown), potentially leading to a prolonged correction lasting at least another two or three months.
Silverbulls have to bend the upper Bollinger Band
Most recently however, silver bulls have made a comeback as silver prices have recaptured the psychological resistance at USD 30 and have pushed quickly higher towards USD 30,66. This bullish price action has activated a new buy signal from the slow stochastic oscillator on the daily chart as of last Friday and still indicates potentially more upside. Yet, at prices slightly above USD 30.30, silver bulls facing strong resistance in form of the upper Bollinger Band (USD 30.53). The two Bollinger Bands are moving parallel and likely are defining a sideways range. This pattern is even clearer on the daily chart for gold and limits gold at around USD 2.360ish.

Silver seasonality over the last 15 years, as of June 27th, 2024. Source: Seasonax
Overall, the silver market seems to be in need of further consolidation. However, the seasonal component suggests that there will be an important low starting in July, from which a significant upward movement could begin. We might have witnessed this low last week on Wednesday. In that case, gold and silver are likely to see a nice rally over the coming weeks. As of now, we doubt that it will take gold much higher than USD 2,400ish and silver much higher than USD 32.50ish, though.
Silver in Euro – Daily Chart

Silver in Euro, daily chart as of July 4th, 2024. Source: Midas Touch Consulting
On a euro basis, our target zone above EUR 30 has so far been missed. Instead, silver prices have slipped down from their uptrend channel and were testing the important support zone at EUR 26.75. Since the slow stochastic on the daily chart has turned up from oversold levels with a clear buy signal, the downside risk should remain very manageable for the time being. In fact, our anticipated rally into the area around EUR 28.50 is already playing out. We could imagine more back and forth as the upper Bollinger Band at EUR 28.36 on the daily chart is a strong resistance. But overall, silver in Euro might remain strong during July and maybe even into August.
Conclusion: Silver – Consolidation before the summer rally
After silver had taken the lead in the precious metals sector at the end of April and stormed towards USD 32.50, the situation has calmed down considerably in the last six weeks. Only after that healthy pullback the bulls are now showing up again.
During the pullback, the gold/silver-ratio was able to recover clearly in favor of gold from values of 72.7 to 80.5. However, as gold and silver have bounced over the last six trading days, silver has outperformed gold which has pushed the ratio back down towards 77.7.
Overall, the bounce since Wednesday, 27th of June, is sending some positive signals, which might signal the start of a multi week recovery, at least. Especially silver’s seasonal pattern suggests the beginning of a typical summer rally. Most likely, metal prices will not break out to new all-time highs but a bumpy rise towards approx. 31 to 32.50 US dollars is conceivable for silver, while gold might be able to rally towards and slightly above USD 2,400.
Analysis initially published on June 27th, 2024, by www.gold.de. Translated into English and partially updated on July 4th, 2024.
Feel free to join us in our free Telegram channel for daily real time data and a great community. If you like to get regular updates on our gold model, precious metals, commodities, bitcoin and cryptocurrencies, you can also subscribe to our free newsletter.
Disclosure: This article and the content are for informational purposes only and do not contain investment advice or recommendations. Every investment and trading move involves risk, and readers should conduct their own research when making a decision. The views, thoughts, and opinions expressed here are the author’s alone. They do not necessarily reflect or represent the views and opinions of Midas Touch Consulting.


