


After the storm
When the bitcoin market reached the ten thousand mark and then even climbed higher, everybody woke up. Volatility went up and the media gave more attention than usual to the crypto markets. Sharp declines followed and the stirred up emotions within market participants and market observers caused turmoil within them. In our last weekly chart book we shared tools on how to weather a storm like this with more ease. When there is confusion and uncertainty there is also opportunity. Let us share today on how we fared after the storm to exploit new opportunities.
The following entries and exits are all documented in real time in our live Telegram channel.
After the storm: Daily chart of BTC/USDT, 3rd of July 2019, aggressive buying and quick risk reduction:
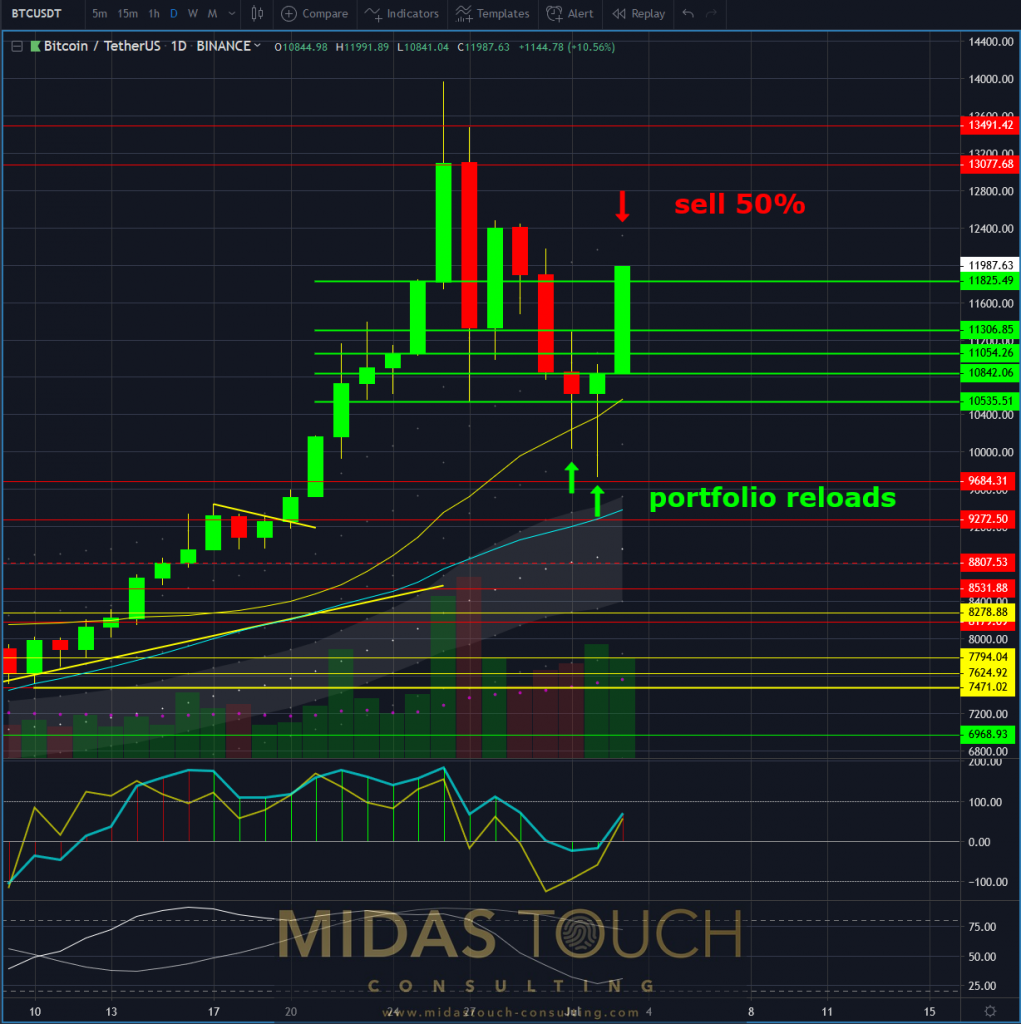
Bitcoin in Tether US, daily chart as of July 3rd 2019
While most are still stunned, it is appropriate to execute ones plan with conviction. We had reduced capital to market ratio by 82% over a course of few weeks on this very bullish run from US$3,150 to almost US$14,000, to lock in substantial profits on the overall portfolio. At the same time only a few days later, we were ready to take an aggressive bite into the market again.
On July 1st, when prices declined back to the 10k support, we started nibbling with reallocation of 55% cash to market ratio. By July 2nd we were back in the market with 75% exposure.
The next day prices soared and we reached our first target zone to take half off and immediately locked in profits. Most of all this was a complete risk elimination as we raised the stop to entry levels for the remainder of the position.
BTC/USDT, daily chart- 07/03/2019, “the calm”:
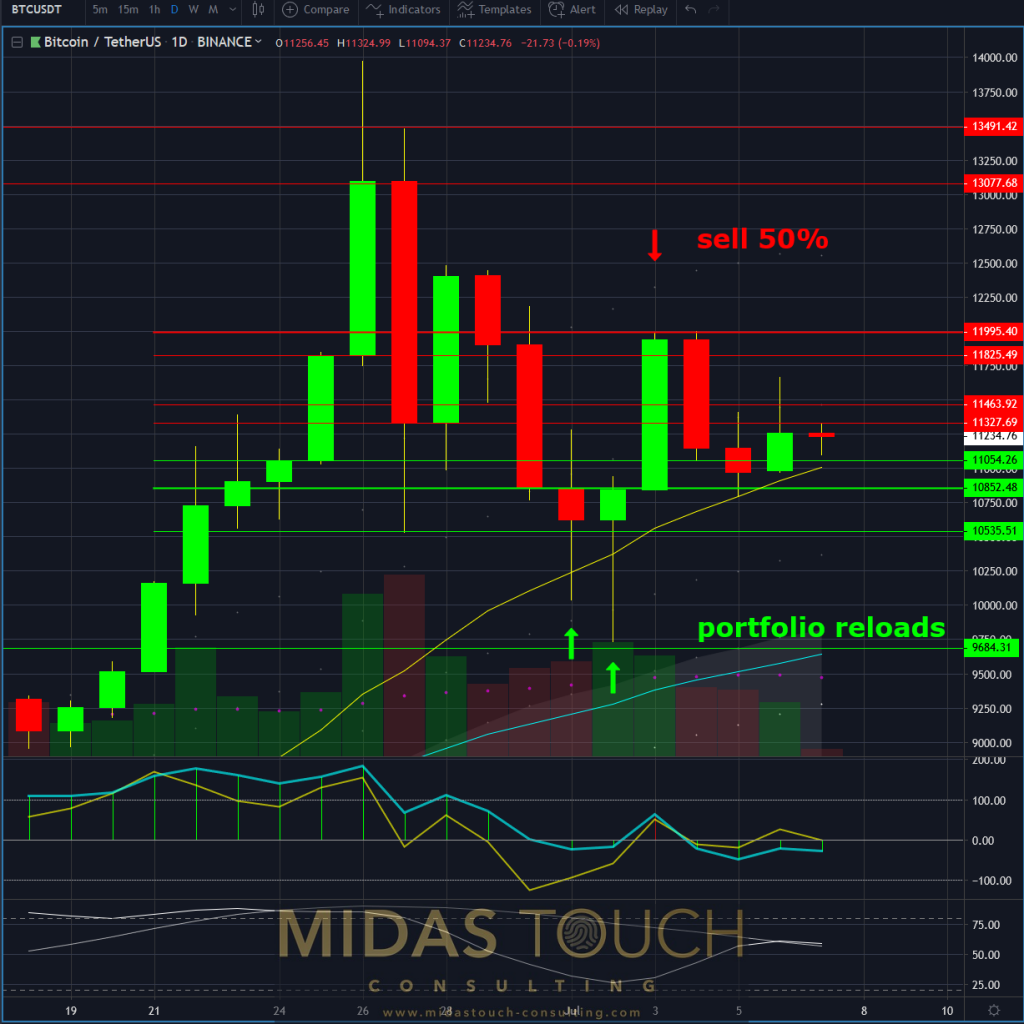
Bitcoin in Tether US, daily chart as of July 7th 2019
Why were we so confident in this trade even though not expecting follow through? The answer is twofold! For one, statistically there is more often than not one counter reaction after the storm before it calms down. Secondly, we were in the good fortune of the 4th of July being a holiday in the US. Pre-holiday trading is atypical and we would like to share a strategy that is quite useful to apply on the prior day to all holidays.
After the storm: 60 minute chart of BTC/USDT – July 3rd 2019, breakout zone from US$11,412:
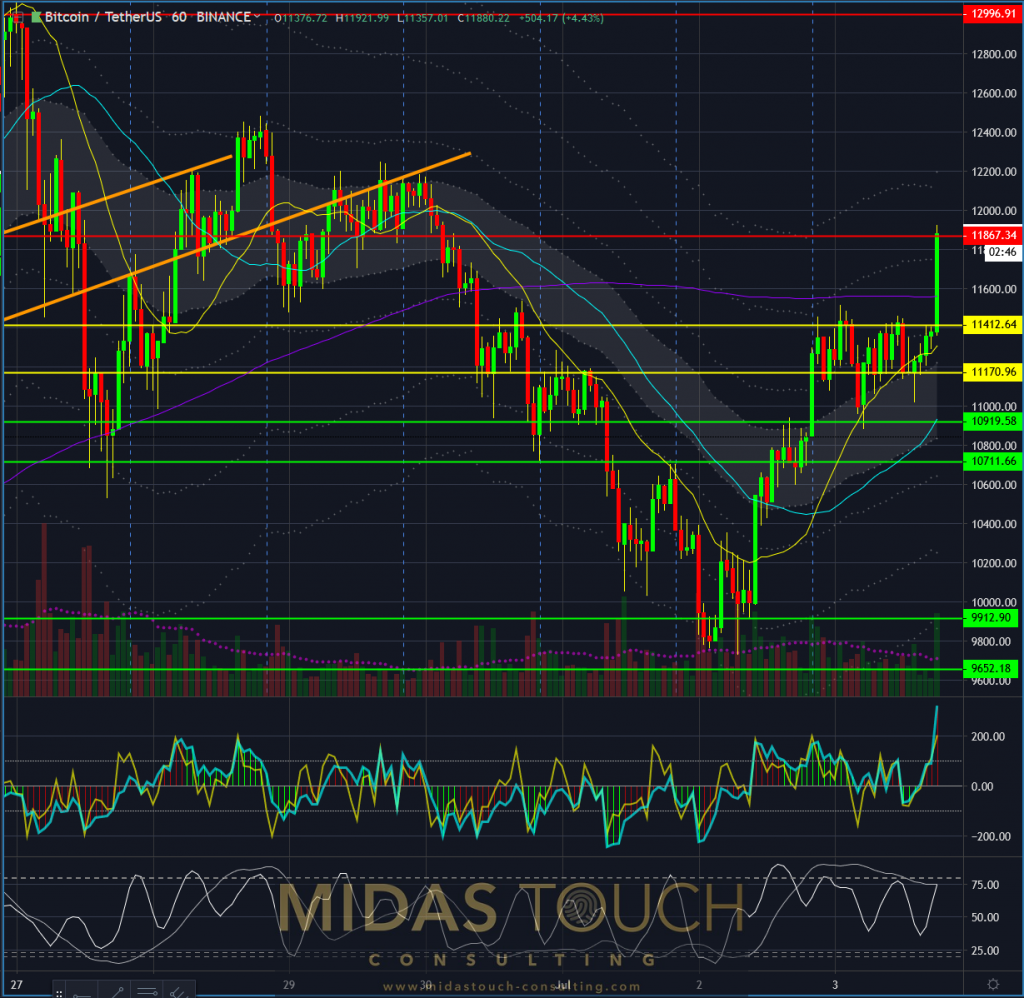
Bitcoin in Tether US, 60 minute chart as of July 3rd 2019
The sixty minute chart shows late in the day a possible breakout zone for possible short squeeze.
15 minute chart of BTC/USDT – 07/03/2019, lower time frame synchronicity:
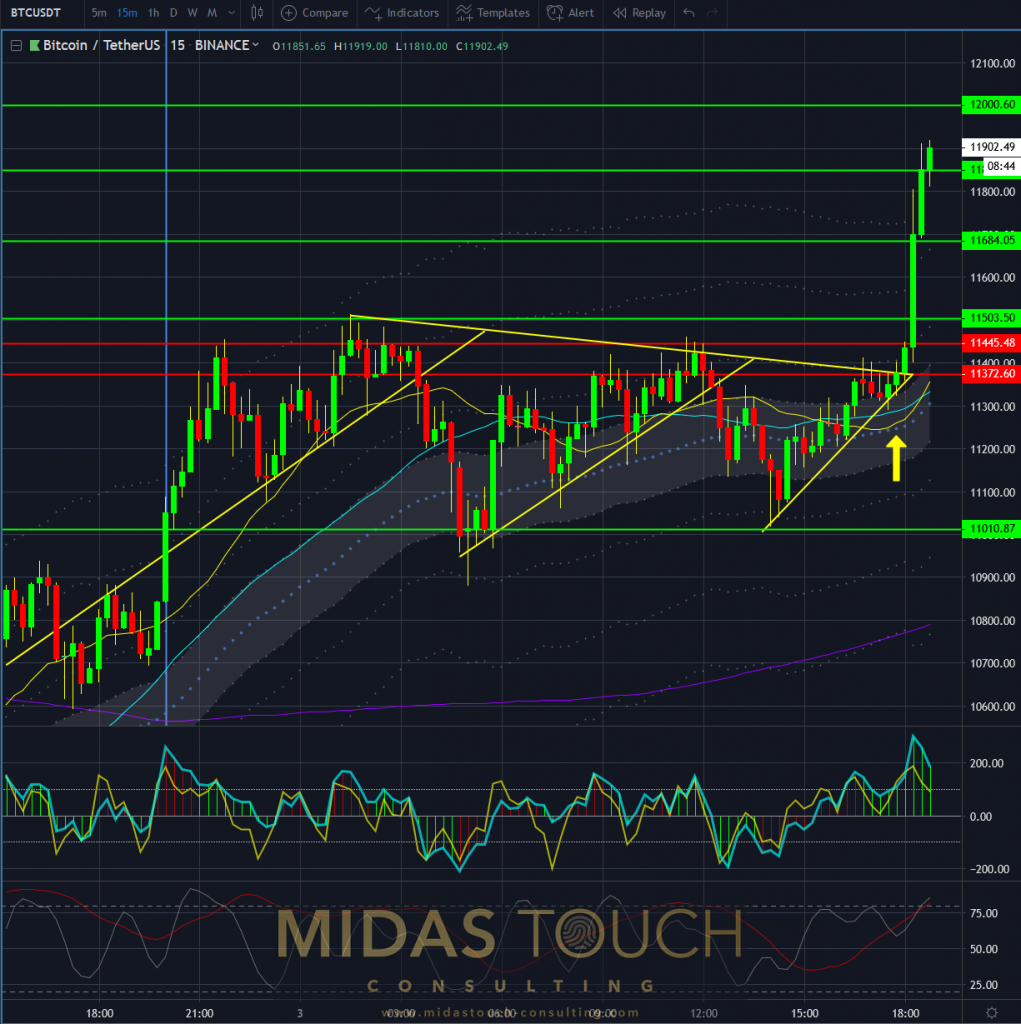
Bitcoin in Tether US, 15 minte chart as of July 3rd 2019
On the lower 15 minute time frame an opportunity presents itself to enter anticipated early into this possible breakout formation with extremely low risk and a great risk reward ratio.
Chart of BTC/USDT – 07/03/2019, early in on possible short squeeze:
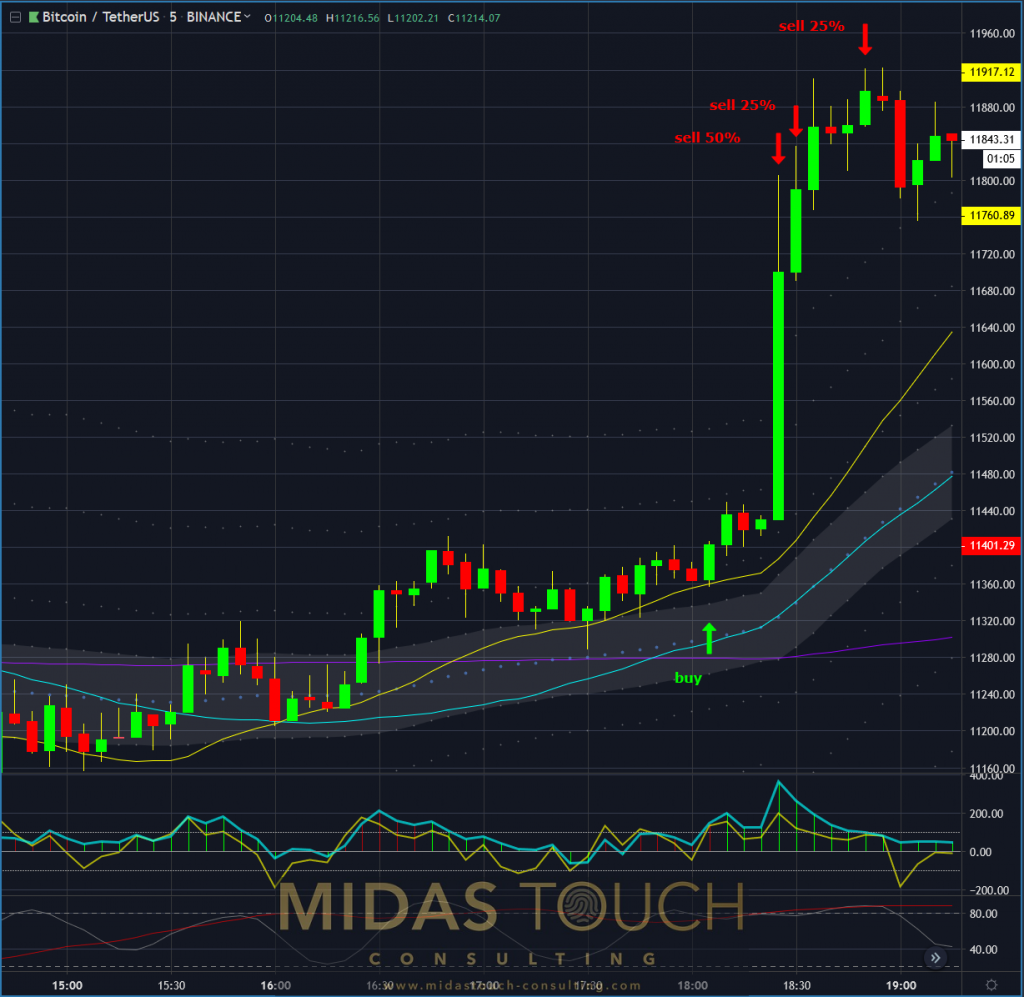
Bitcoin in Tether US, 5 minte chart as of July 3rd 2019
Catching a 550 point move on BTC with a less than 50 point stop or in other words, taking a trade that has a 1:11 risk/reward ratio is a ‘no-brainer’. These opportunities are rare in a high hit rate trading system. The abnormality of a high probability short squeeze on preholiday trading days allows for such gifts of the market. But of course, you need to be aware of this statistical edge!
It isn’t important if you believe the folks tail of traders rushing to their cars and airplanes to reach vacation destinations and as such these short squeezes do exist.
What is important is that once a statistical edge has been exploited in theory it needs to be added to ones arsenal and traded once it presents itself in the market.
All charts timely posted in our telegram channel.
If you like to get regular updates on our gold model, precious metals and cryptocurrencies you can subscribe to our free newsletter.

