


Short Squeeze and Maximum Adverse Excursion
When markets come to the forefront in news they are most of the time volatile. This means more participants, more volume, wider ranges, simply – everybody shows up. This causes emotions and struggles with a lot of different market participants and these emotions trigger even the astute trader. Now if you trade more typical markets where you have an uptick of volatility each time there is a federal reserve meeting taking place, you can simply plan to stay sidelined and avoid money exposure. (The FED meets eight times a year, approximately every six weeks). If you are participating in the crypto currency markets, volatility is such a big part of this speculative market niche, that it is wise to rather find ways of how to trade these larger range environments because they are frequent. We want to point out two important “abnormalities” that come to the forefront in these times of all time frame participants meeting at the same plain field. The short squeeze and maximum adverse excursion (MAE).
On June 26th at 10:30 eastern time we posted in our live Telegram channel, that we reduced total cash exposure to the market by 30%. A drastic move on a total portfolio exposure. Ninety minutes later the market exploded for one last time to the upside reaching annual highs to collapse shortly after with a violent drop of more than 2,000 points. The following day the bitcoin market had reached at its daily lows a total loss of more than 24 percent. Within a very short period of time the entire market had lost a quarter of its worth! In these times trading behavior of the market changes quickly and dramatically.
Daily chart of BTC/USDT, 27th of June 2019, we called the top right in time:
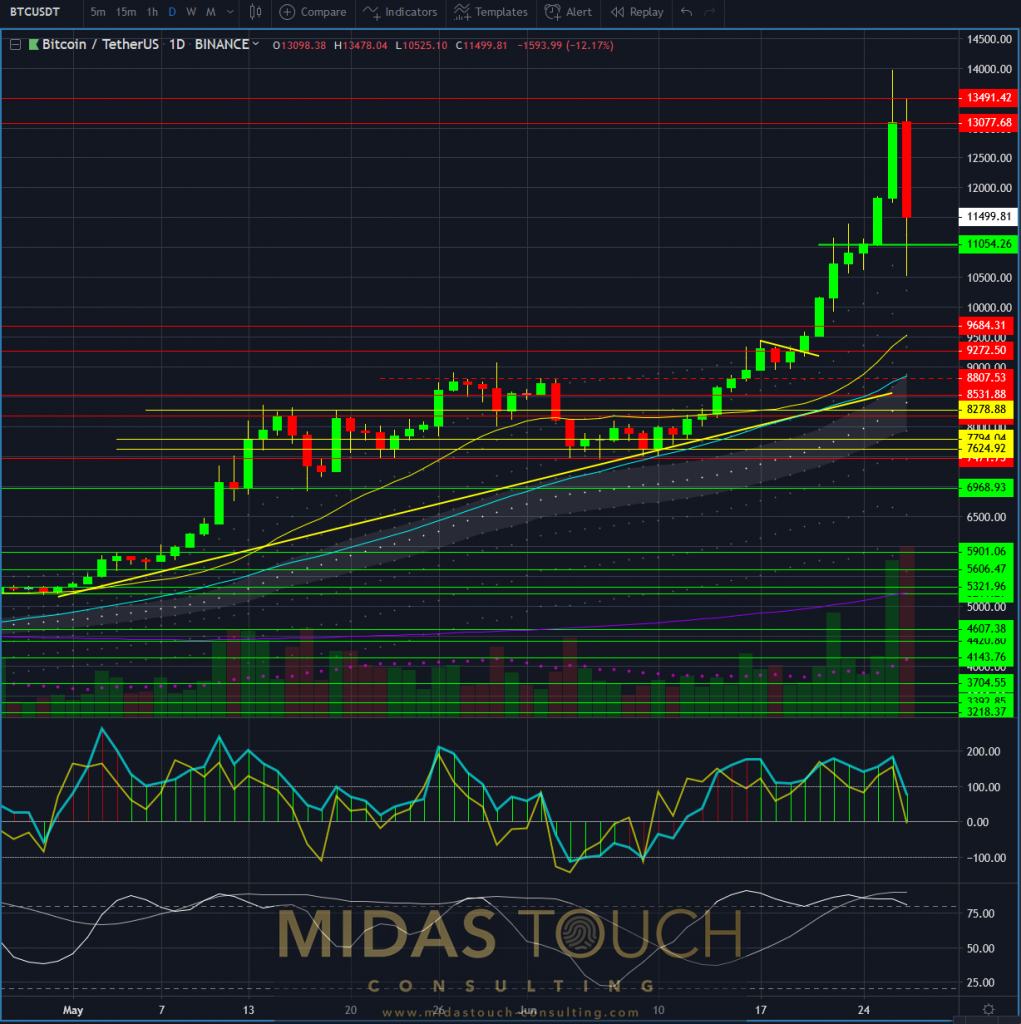
Bitcoin in Tether US, daily chart as of June 27th 2019
Market play reflects the human condition of dualism. Most struggle in daily life with up and down, yin and yang, good and evil, the endless list of opposing pairs. We do similarly in the markets. Here it would be directional and range, indicators and oscillators, single trade versus sample size, and all the other dichotomies that make trading so very difficult.
In today’s publication we are differentiating between lagging and leading markets. A non volatile market is lagging. This environment allows for precision and tight stops. It has a low probability in a successful turning point ratio. It needs to be traded anticipatory. Most of all it is counter intuitive and requires conditioned behavior to overcome obstacles.
A volatile market is leading by nature. Turning points are choppy and require wider stops. Once through the struggle phase, a larger than typical reward distance is granted and prices lead. The turning point success rate is high. The market swings. As such it feels intuitive to trade such markets.
Maximum adverse excursion (MAE) is one way to measure the expected size of stops to be used to be in alignment with the turning point size.
MAE describes the maximum loss suffered by an individual trade before it turns into a wining trade. Most software back testing packages offer this value but we recommend actually hand back testing. In short the average of a larger sample size based on extended range and volume of volatile environments in the past, guide towards the stop size to be used next time around volatile times are to be traded within. Simply take a bit larger number of a stop size than the MAE value is.
It is time well spent to look into this subject a bit further on your own. It can truly provide an edge where most struggle to adopt to switching from fixed stop sizes in calmer waters to giving more room when things get going. One simply needs different tools for different environments.
One exception to the intuitive behavior of a volatile environment is the short squeeze.
With a market share of two thirds to three quarter of all execution done by computers, one needs to know when to step aside as an individual since computer speed outperforms the individual execution capacity.
Luckily in this case it is fairly easy to spot if you know what you are looking for. In the following three charts we are pointing out a short squeeze that occurred on 6/27/2019. Identify of how clean looking this channel looks on the various time frames, to good to be true. And that’s exactly what it is… Generated by buy and sell programs of computers! You do not want to fade such an up creep, even if it feels like it is collapsing every minute.
5 minute chart of BTC/USDT – 06/27/2019, short squeeze channel:
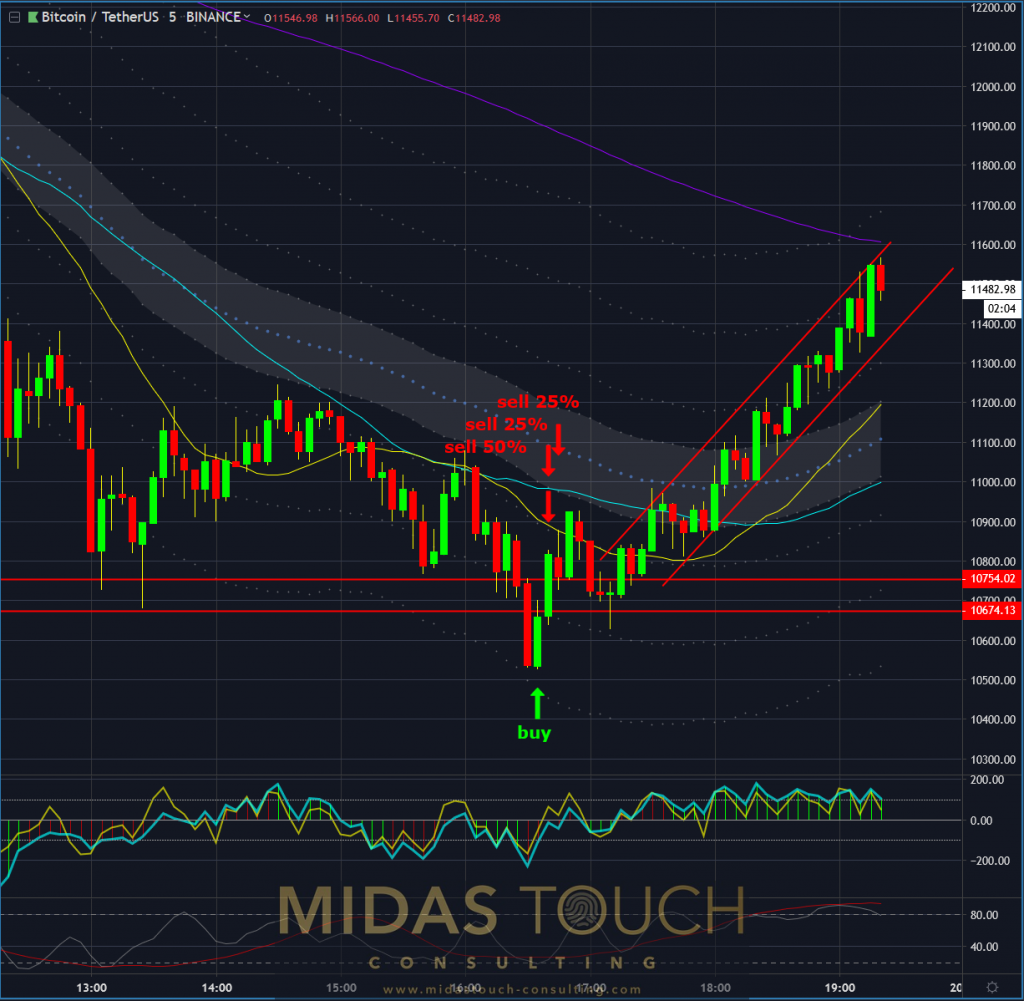
Bitcoin in Tether US, 5 minute chart as of June 27th 2019 a
5 minute chart of BTC/USDT – June 27th 2019, at a closer look this nearly one thousand point move is just to clean:
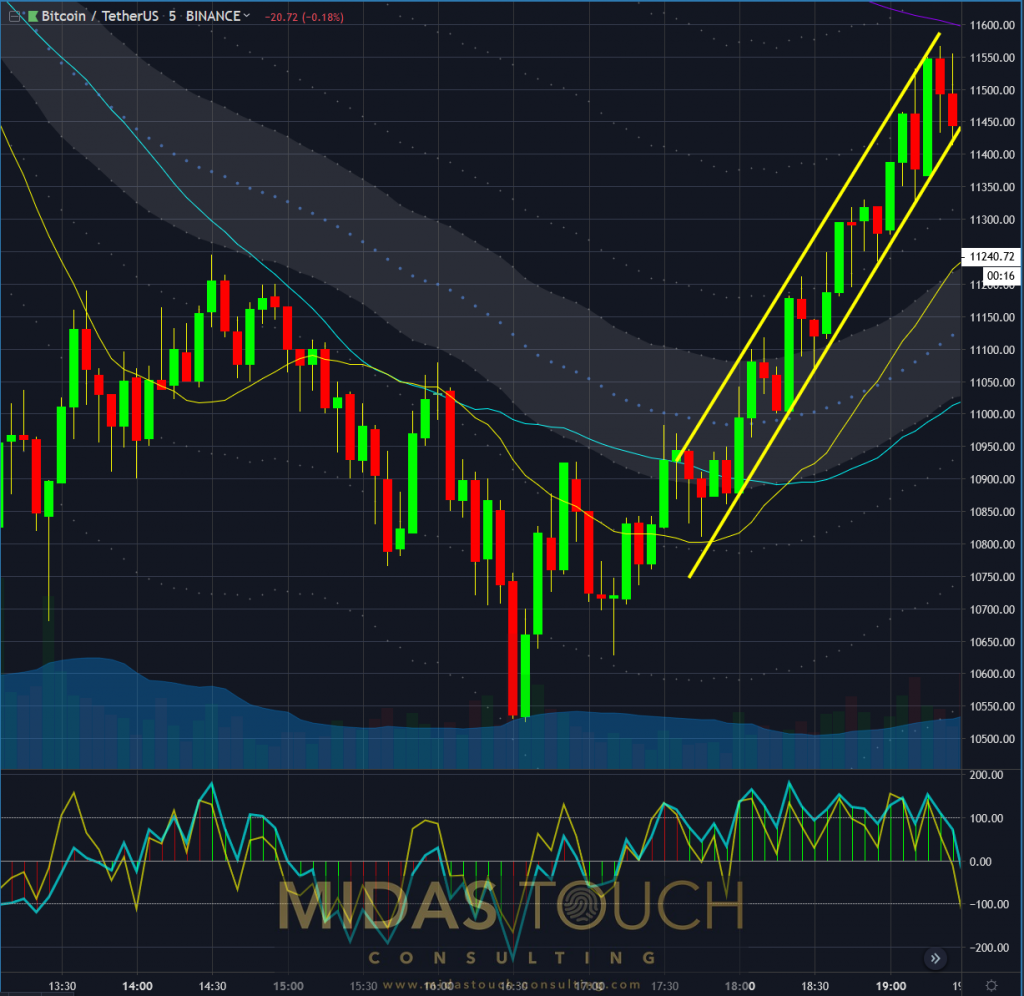
Bitcoin in Tether US, 5 minute chart as of June 27th 2019 b
15 minute chart of BTC/USDT – 06/27/2019, after a long day of bears controlling the market, shorts are getting squeezed:
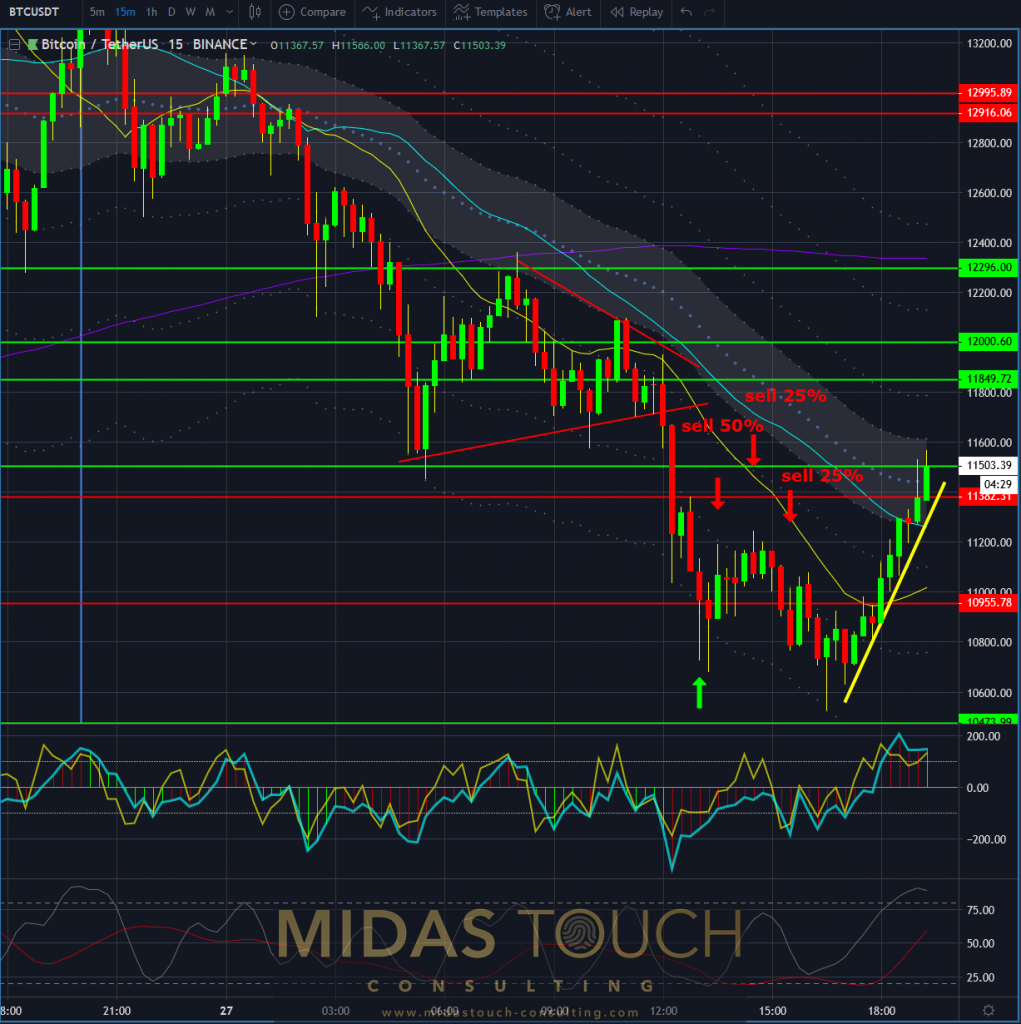
Bitcoin in Tether US, 15 minute chart as of June 27th 2019
It is the too clean lines that give these program trades away. Avoid, if you want to keep risk on the low end.
“When in doubt, stay out” is great advise. A milder version of this saying is “when in doubt, step a time frame higher”.
We adhere to both trading rules. If too much action and too much noise are overstimulating a trader’s mind, it is best to remove yourself and get a clearer view what the more dominant market players are perceiving as their edge.
Weekly chart of BTC/USDT – 06/29/2019, the bigger picture, “shifting tides?”:
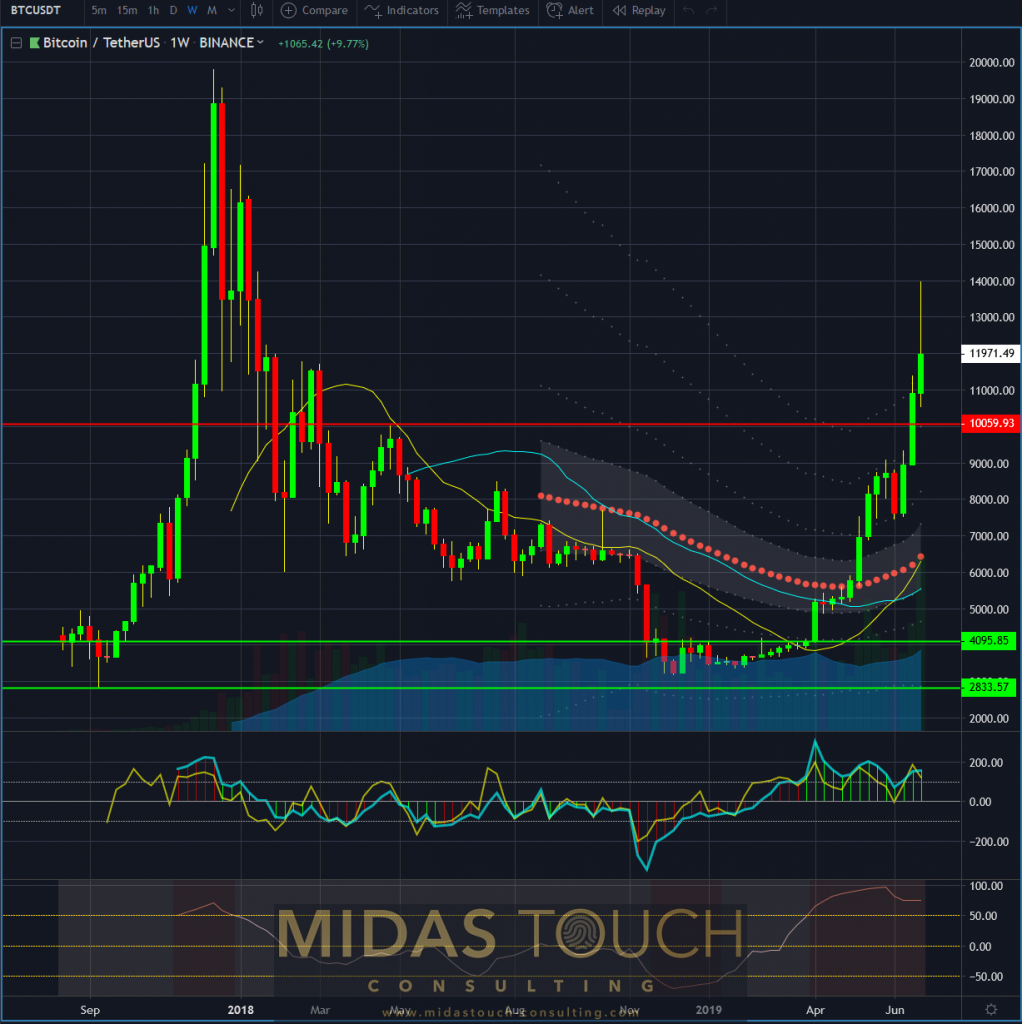
Bitcoin in Tether US, weekly chart as of June 29th 2019
It is extremely hard to utilize market newsletters. For truly integrating a market picture from an outside source, trust and confidence are core principles. We are trying to illustrate what tools we are using, and in which form we are applying them, to support your market play. Only with a clear view of principles used, and absolute transparency, we can truly provide value to our readers. In today’s publication we hope to have provided inspiration that with a bit of extra work anybody can sharpen their toolbox for the next battle. We wish for you to prepared for market participation at times when the density of emotions flaring up in a volatile environment, make most just freeze up and observe, even so great opportunities unfold themselves.
All charts timely posted in our telegram channel.
If you like to get regular updates on our gold model, precious metals and cryptocurrencies you can subscribe to our free newsletter.

