


Review
Since the low on December 15, 2018 at US$3,127, Bitcoin has managed to stage a spectacular recovery in recent months. With a high of US$13,887 reached on June 26, 2019, the most important and largest crypto currency has more than quadrupled within just six months!
In the last two and a half weeks, it has pulled back sharply to $9,620 before increasing to $13,195 US dollars, but so far the June high has not been exceeded.
Technical Analysis, ABC Correction or New Highs?
Source: Tradingview
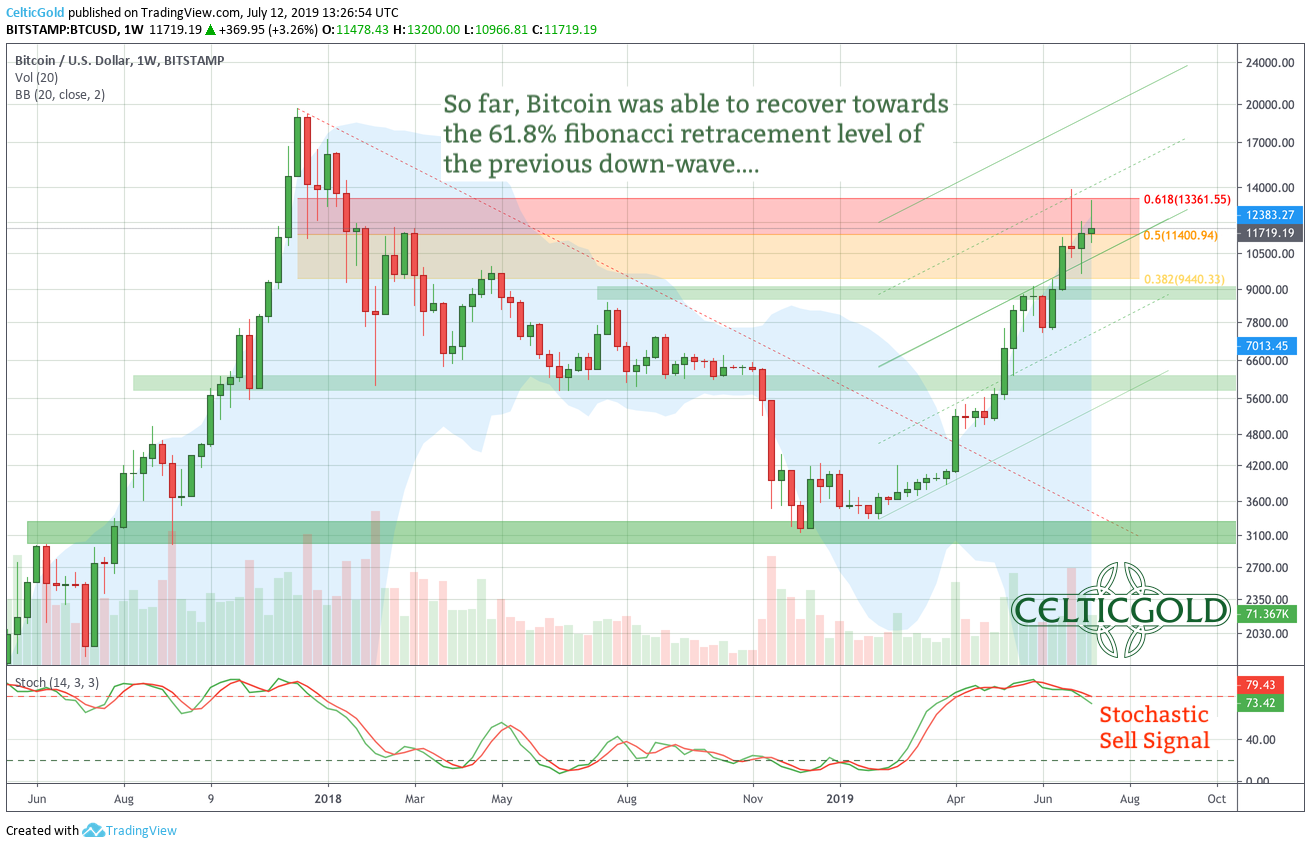
On the weekly chart, the wild ride of Bitcoin is clearly visible. Although the moves are huge in both directions, from a longterm perspective Bitcoin keeps progressing steadily upwards.
With the recent price spike to US$13,887, pretty much 61.8% of the previous downswing has been recovered. At the same time, it has created a natural resistance zone where savvy investors have taken profits and reduced their long positions.
In the big picture, the sharp recovery in recent months is without question bullish. If the high of US$13,887 is exceeded, then US$15,000 and the all-time high of $20,000 are realistic and may be achievable this year.
On the other hand, if the sell-signal on the Stochastic Oscillator breaks down, a multi week to multi months sideways consolidation or a sharp setback in the direction of US$7,000 – US$ 8,000 could be expected. The weekly chart is without question overbought and actually needs to cool down. Yet above US$6,000 and especially above US$9,000 the bulls remain in control.
Source: Tradingview
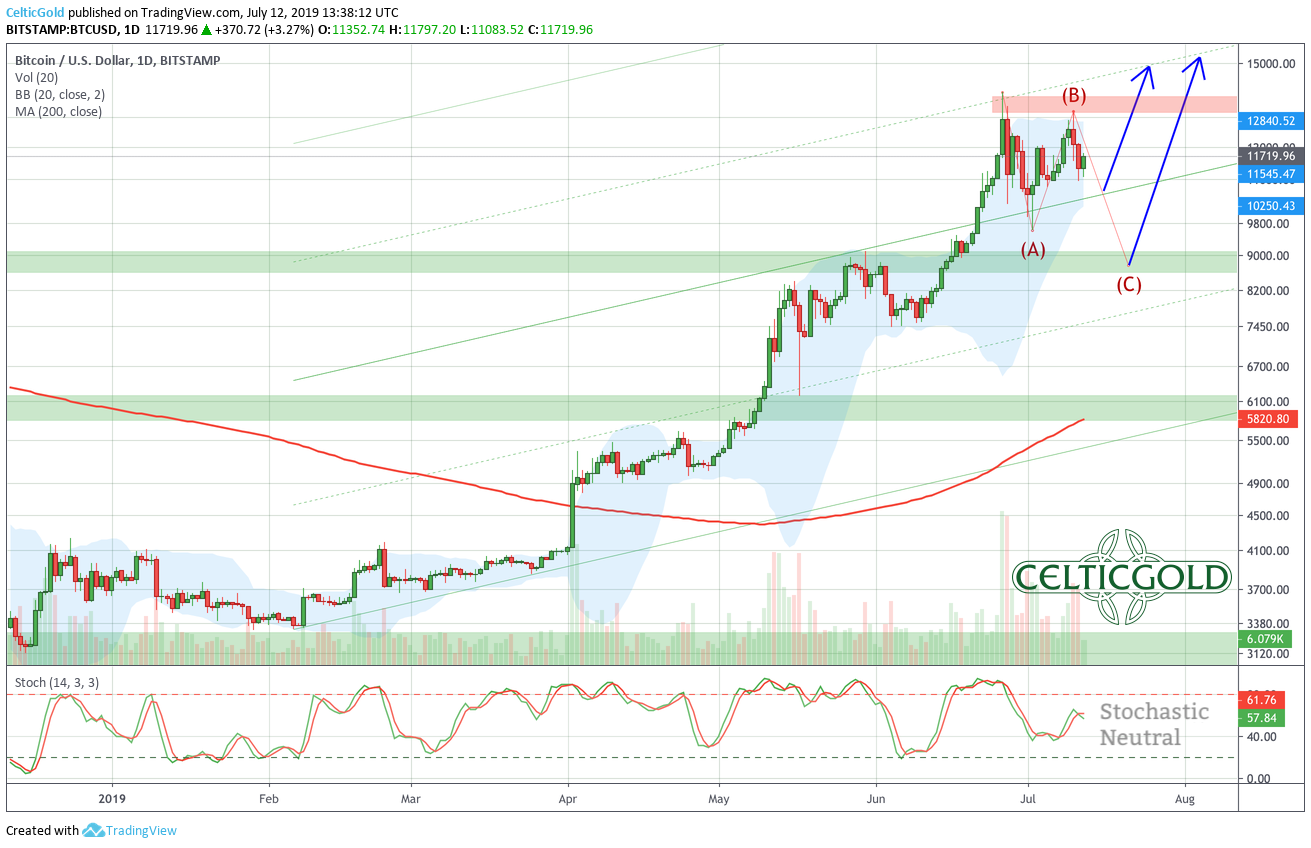
On the daily chart, the multi-month upward movement has recently faltered. Since peaking at US$13,887 two and a half weeks ago, Bitcoin is correcting from the sharp rise, though it is still unclear whether the $9,620 low is the true low of that correction. It could also be an ABC correction due to the three-part recovery wave to US$13,195 and the subsequent sharp sell off. In this case, points A and B would be defined already. The final low at C might then be found in the area of the support zone between US$8,800 and US$9,200. Alternatively, the lower Bollinger Band (US$10,250) could also be a target area and stopp the bears already.
After the clear sell-signal two and a half weeks ago, the stochastic oscillator now is more or less neutral and currently does not provide a clear statement. The lower price high (US$13,195) is confirmed by lower oscillator values.
But really unfavorable is the large gap to the 200-day moving average (US$5,820 US dollars). Although is is rising steeply, the line runs miles below the current price action. Although things are happening much faster in the crypt world, the laws of gravity do apply as well. In this respect, the great distance definitely warns us to be careful.
Overall, the short term picture in Bitcoin warns of a correction. Of course, a push of “just” US$2,000 would immediately change the situation back to super bullish. So far, however, the completed pattern weighs heavily. The continuation of the upward movement could therefore be delayed significantly. A decline to US$9,000 and in an extreme case even towards US$7,000 should be taken into account.
Commitment of Trades Report For Bitcoin
Source: Barchart
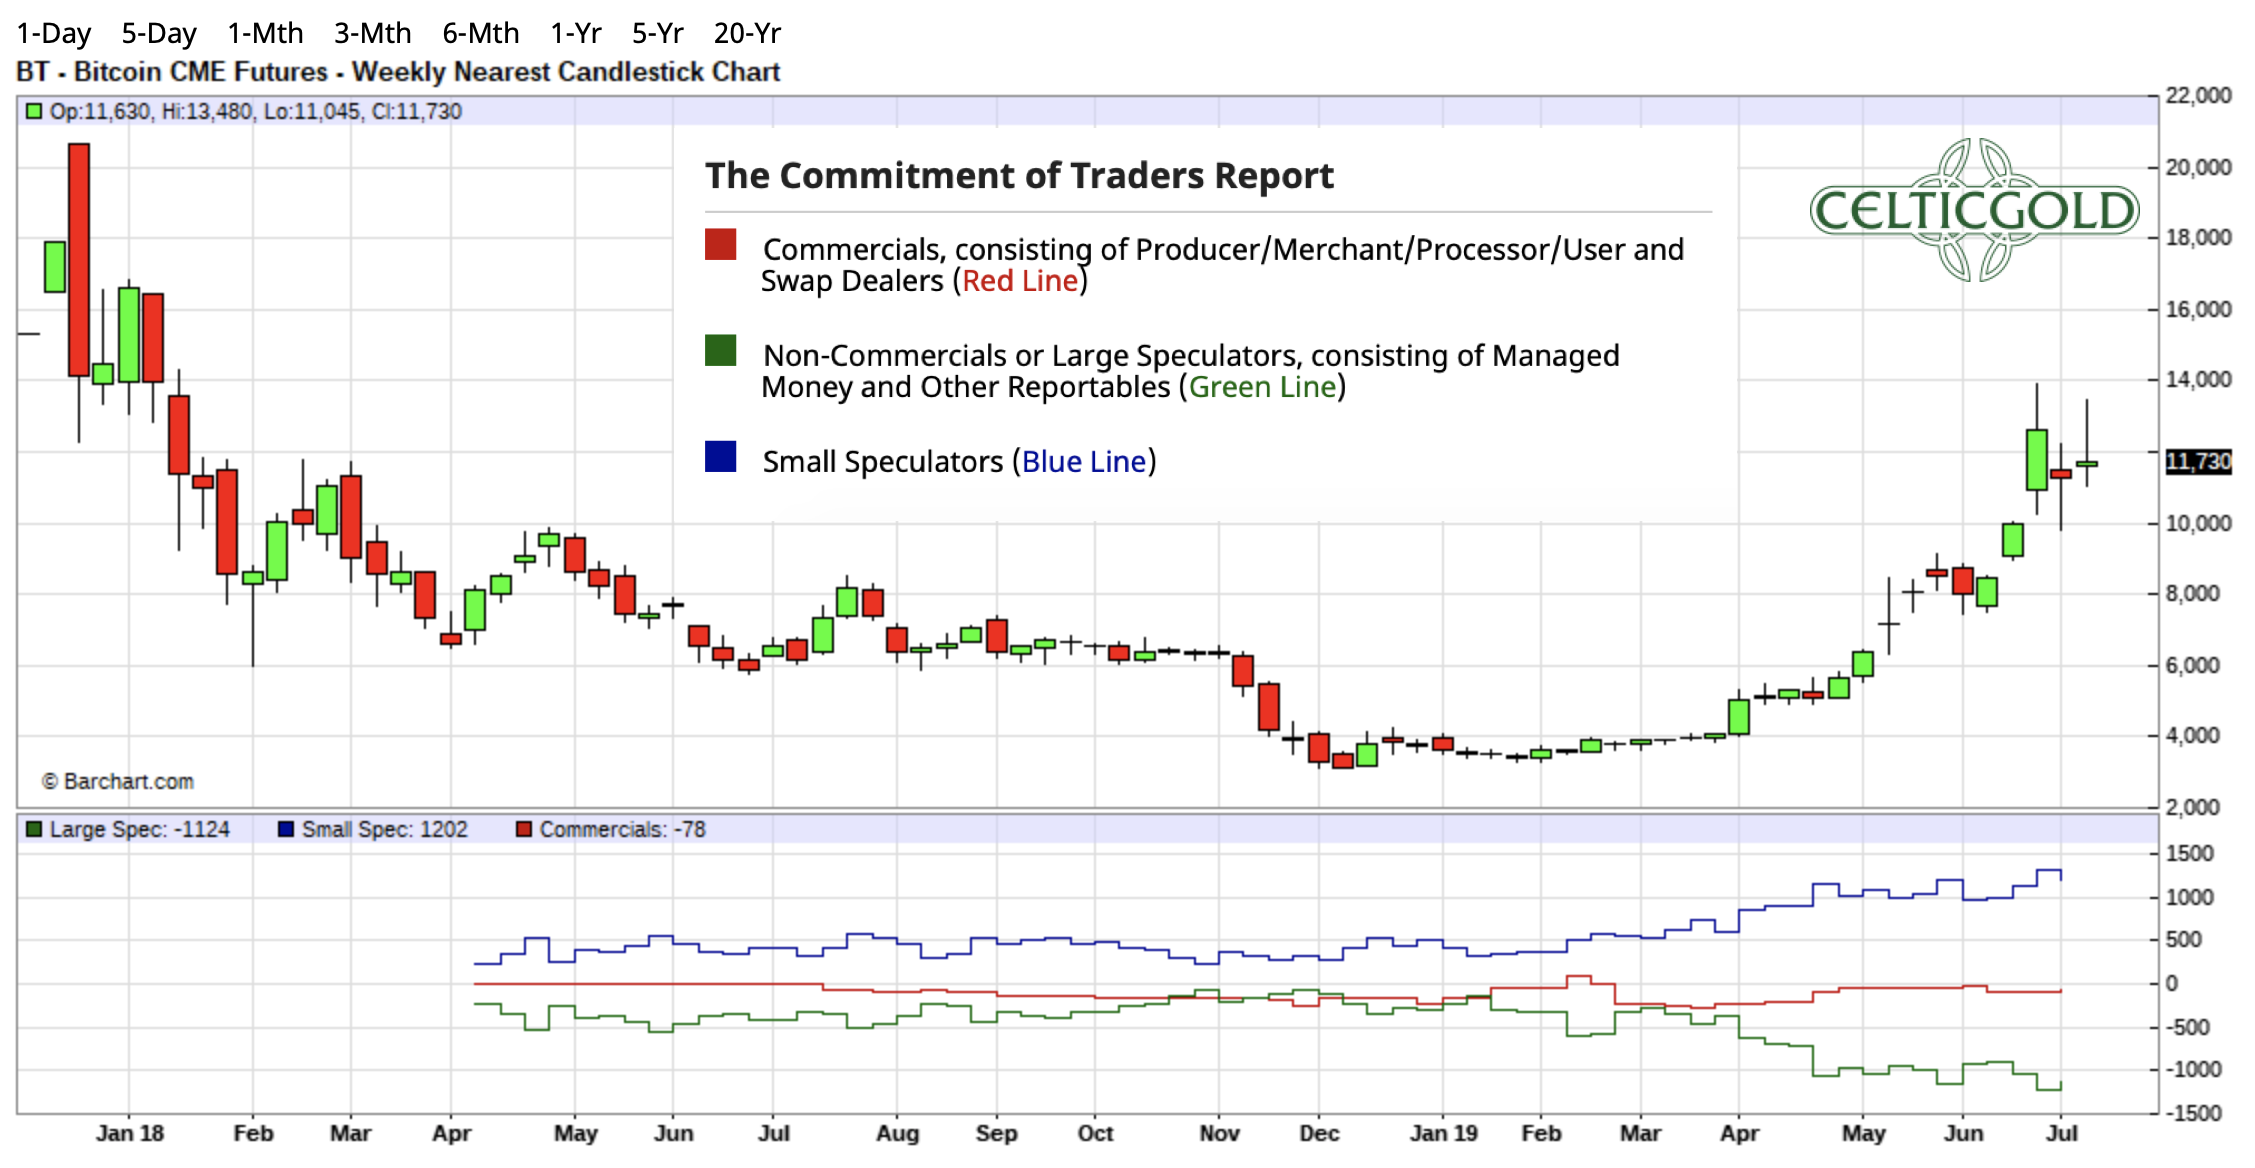
Bitcoin has been trading on the futures markets since December 2017. The all-time high at $20,000 was achieve right at the first trading day of the futures contract!
In general, large players in particular use the futures markets for their speculation. On the gold and silver futures market, the game between the commercial traders (banks, producers, smart money) and the big trend following speculators (hedge funds, etc.) is well known. For the Bitcoin market, however, only a few data series are available to analyse.
Nevertheless it is noticeable that especially the small speculators (the smaller private traders) have been expanding their long positions since the spring of this year, while the big hedge funds speculators have taken the other side. The commercial traders however are not yet very active in the bitcoin futures market, since there are not as many derivate products for Bitcoin available and thus there ain´t positions that they would have to hedge via the futures market.
From an analytical point of view perfectly positioned for the Bitcoin rally, however, was the group of “Other Reportables”, which is not listed individually in the normal COT report. This group was heavily positioned on the long side at the beginning of the April rally and has now moved massively to the short side over the last few months. If this group is right, Bitcoin will go through a deeper correction in the coming weeks and months.
Sentiment For Bitcoin
Source: Crypto Fear & Greed Index
Source: Crypto Fear & Greed Index
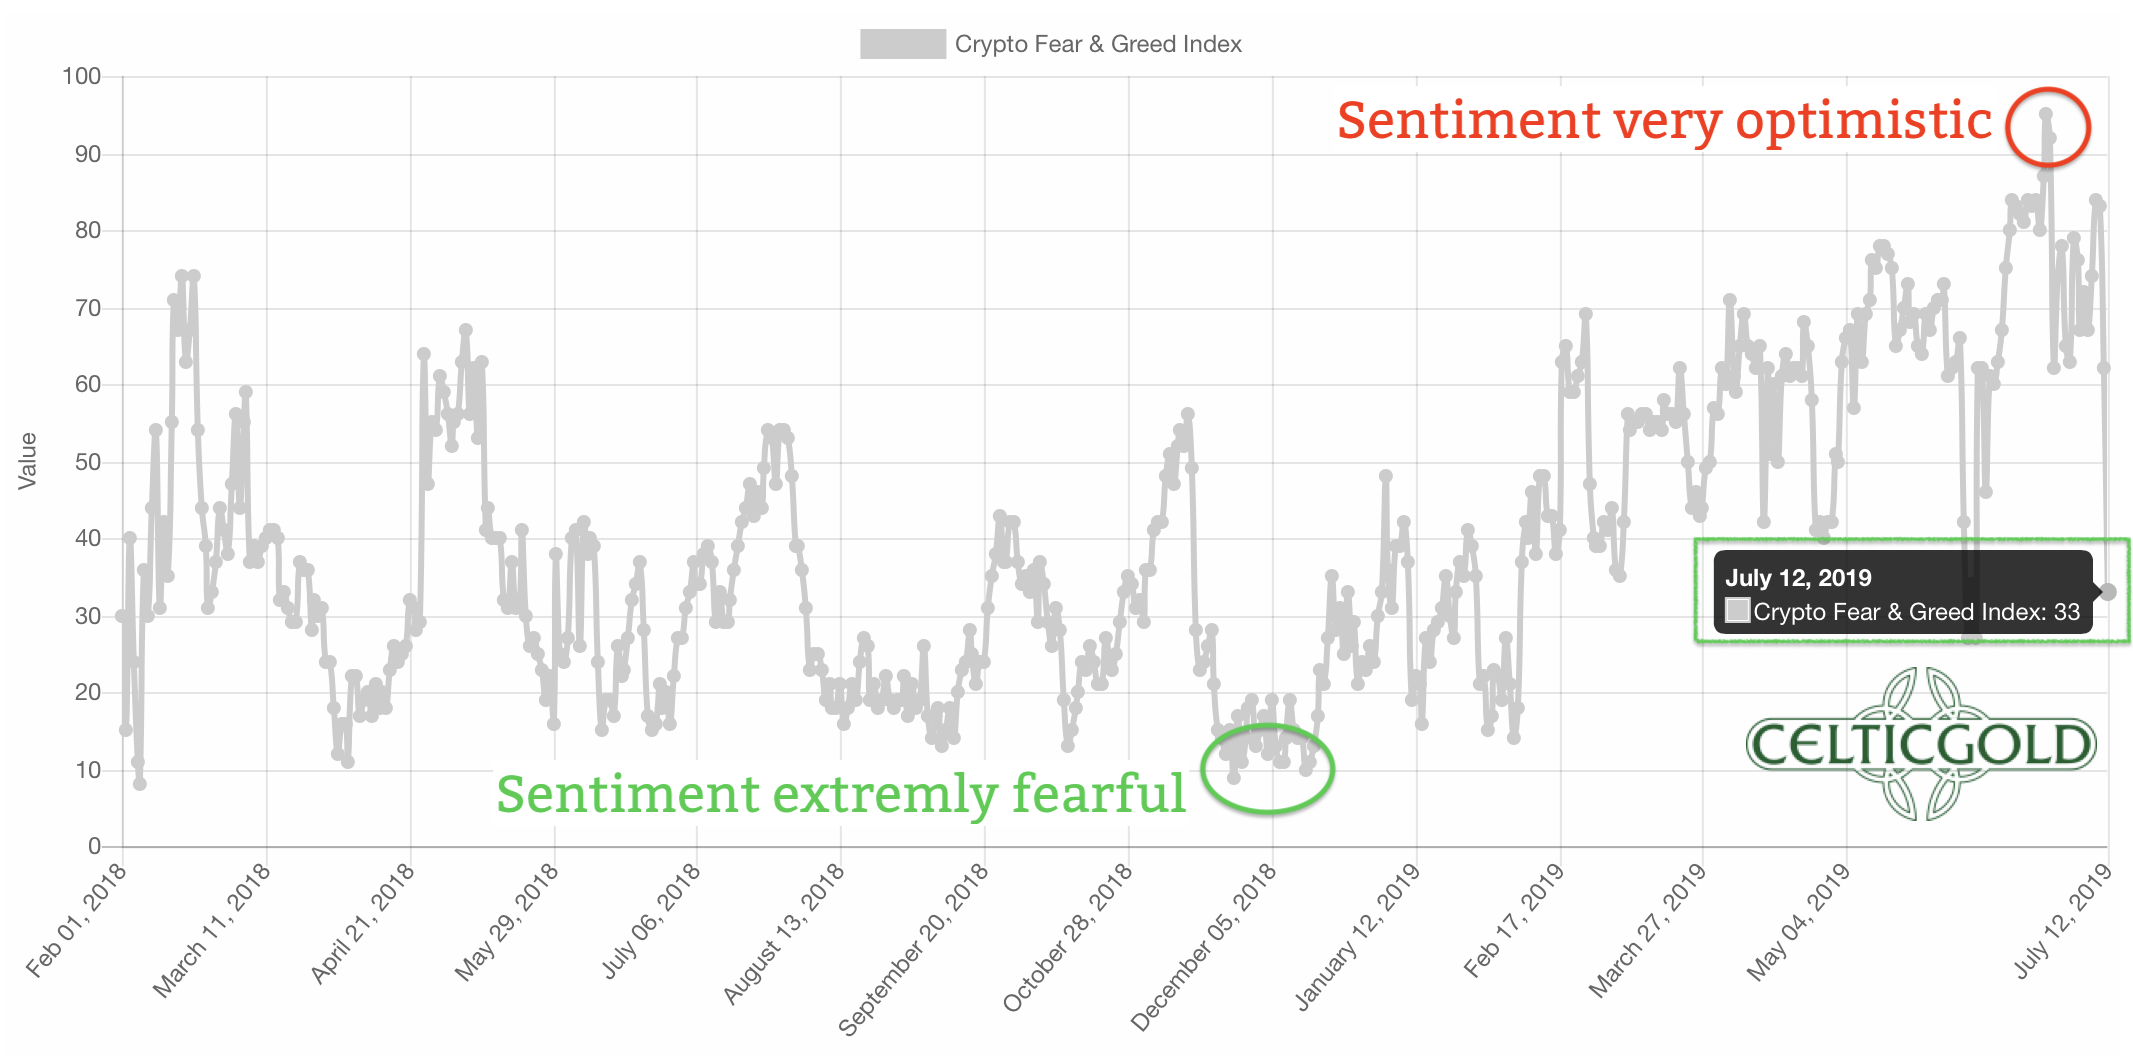
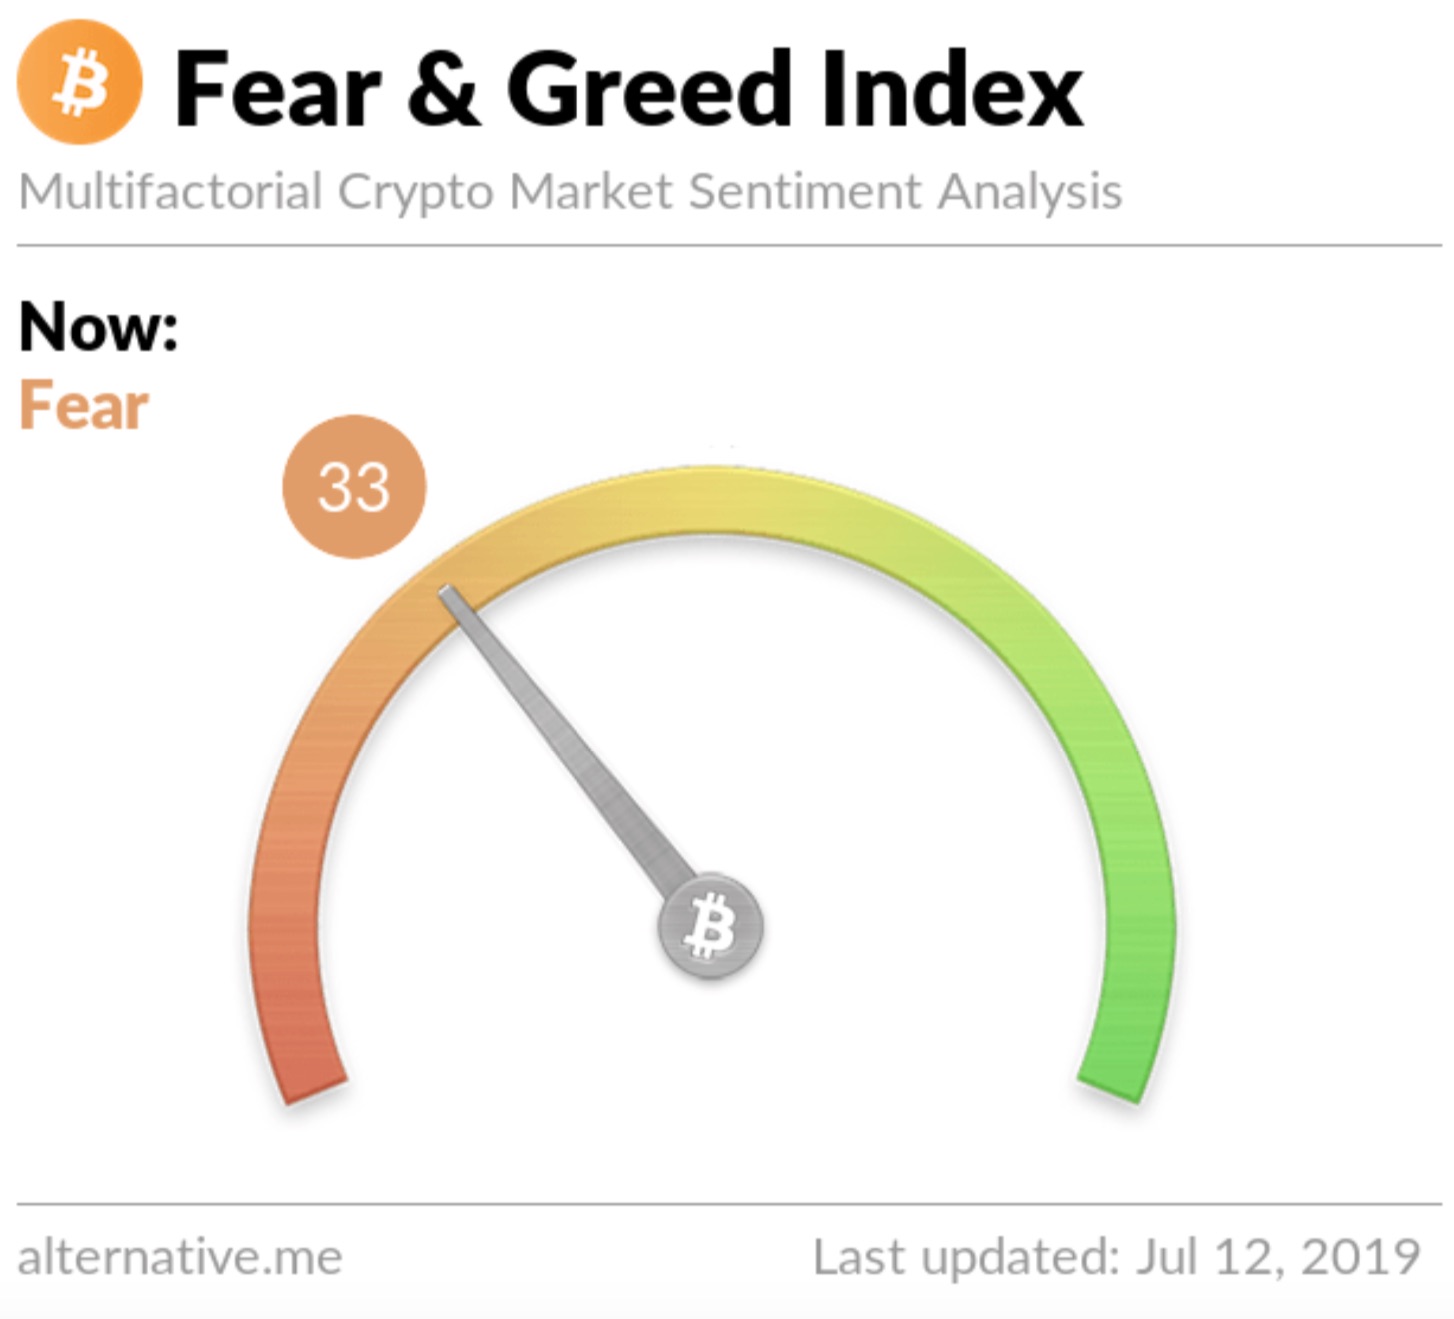
The last important extreme point in sentiment was measured over seven months ago! At that time, the mood was miserable after the price of Bitcoin had fallen from almost US$20,000 to US$3,125 within 12 months. Prices and Euphoria had plummeted into the abyss. There were no more bullish market participants anymore. That kind of sentiment level was the ideal starting point for a strong recovery.
Currently, bitcoin has gained much more attention due to the almost parabolic increase in June and cryptos are back in the mainstream. As a result, the number of news stories reporting the steep rise is increasing significantly. Likewise, the number of Twitter messages has also increased significantly. This naturally attracts the interest of inexperienced investors and drives their fear of missing out on the next big climb. This group of “greenhorns” usually enters near important high points.
However, with Bitcoin recently reaching the high of $13,880 the euphoria is nowhere near where it was in December 2017 at the peak. Massive speculation driven by blind greed is not (yet) detectable. At the same time, the current mood is certainly too optimistic. The setup feels more like an intermediate high.
Interestingly enough, the Fear & Greed Index has dropped significantly from US$13,887 to US$9,620 so that the downside risk should remain limited, despite of course the typical bitcoin volatility. If Bitcoin can surmount its recent high at US$13,800 however, a crazy bubble phase could start once again. But the price for such another sharp price will certainly be high, as the following hangover will be very painful again.
Bitcoin Seasonal Pattern
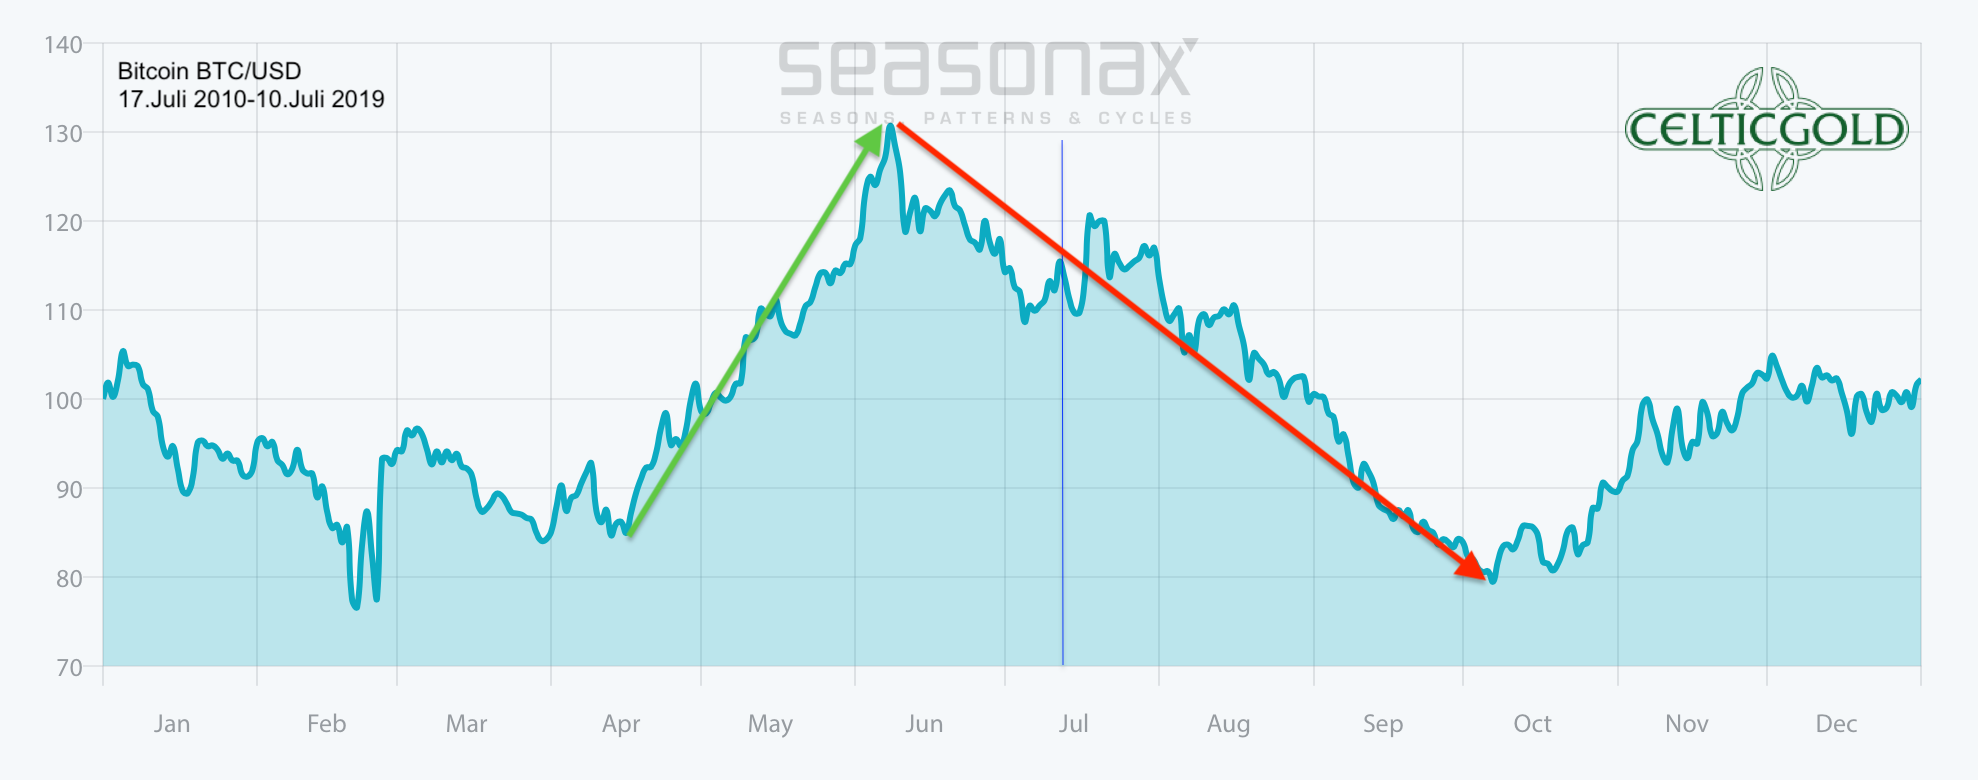
Source: Seasonax
Even though with just 10 years the evaluation period for Bitcoin is relatively short at, a typical seasonal price trend can be extracted. Due to the exorbitantly large price swings, however, this pattern can change significantly within one year.
In the current year, Bitcoin so far has followed its seasonal cycle. Accordingly, the recent top at US$13,887 would now be followed by a down wave extending into October. The 4th quarter should then bring a renewed uptrend and higher prices.
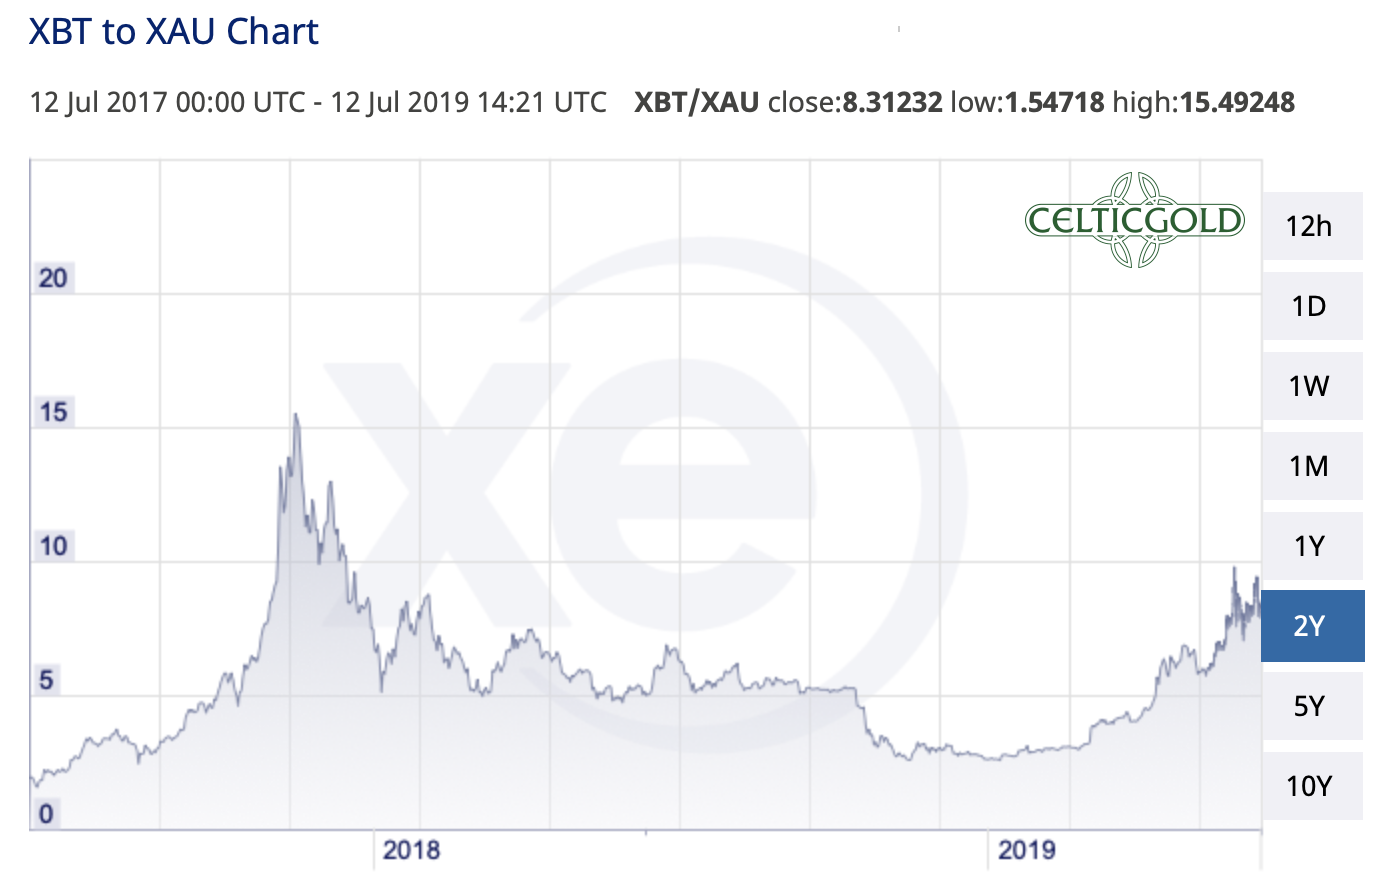
Bitcoin vs Gold
Currently, a bitcoin costs more than 8.3 ounces of gold. In a long-term comparison, the ratio is approaching the highs of the 4th quarter in 2017. Conversely, one ounce of gold currently costs “only” 0.12 Bitcoin!
The favorable gold valuation in Bitcoin currently speaks for an exchange of Bictoins into gold. Of course, you should be invested in both asset classes. But Bitcoin is currently overvalued, while the price of gold likely has more potential. Especially if you’re considering its recent successful breakout of a six-year bottom building phase!
Source: XE
Conclusion and recommendation
After a strong recovery rally, there are clear signs that Bitcoin now needs a breather. Basically, Bitcoin could continue its high-altitude flight at any time due to its “wild and free nature”. The rapid cooling of the sentiment argues supports the bullish case.
However, at least from the short-term perspective, it is very difficult to come up with a decent risk/reward ratio at current price levels. As well, commitment of trades and the weekly chart together with the seasonal cycle point towards a correction.
Investors should therefore be patient and use the next major pullback into the range of US$7,000 to US$9,000 for new investments and long trades.
Anyone who wants to diversify some of their significantly more valuable Bitcoins will certainly not make a mistake to swap a part into physical gold at the current price of 0.12 BTC for a one ounce of gold!
Source: www.celticgold.eu
If you like to get regular updates on our gold model, precious metals and cryptocurrencies you can subscribe to our free newsletter.

