


Know what to look for!
While playing the market it is imperative to consistently look for edges. Markets change and as such one needs to be on ones toes. In a recent publication of ours we mentioned the change of the bitcoin market due to new market participants. Each time one suspects such changes to have taken place or being in their initial stages, it is advisable to review your system and question your edges. At the same time looking for abnormalities or newly establishing repetitive structural market behaviors could bring a new edge to add to your arsenal. Over time this process of ‘extracting hidden gems’ becomes second nature and assures the market participant to be ahead of the crowd. Therefore, you need to know, what to look for!
Let us share one of those recent behavior changes of the bitcoin market. It might be useful for your own approach towards crypto currency trading/investing!
Timing entries and exits can be a tricky endeavor. Good timing allows for less slippage, lower risk and ideally a higher probability of the desired turning point.
The next three bitcoin charts show daily starting times on hourly charts right before the start of significant moves. It also highlights the size of moves in points.
In studying these three charts you will find that the bitcoin market has found itself now more aligned with the US index futures market in regards to market participation time of day. The study shows similar times when the market turns and a larger move occurs. These times are the typical first and last hour for the futures market, 09:00 to 10:00 am eastern standard time and 03:00-04:00 pm eastern standard time. It also points out the typical 12:00 reversal time.
In addition you will find that turning points occur frequently at the end of each trading day (20:00 pm eastern standard time). These are marked with blue vertical lines in the charts below. This is due to high bot trading participation which determines much of its calculation based on final day calculations.
All of this points towards the mentioned market participant changes refereed to in our weekly chartbook from May 11th this year.
Hourly charts of BTC/USDT, 13th to 30th of May 2019, showing starting time and size of market move in points:
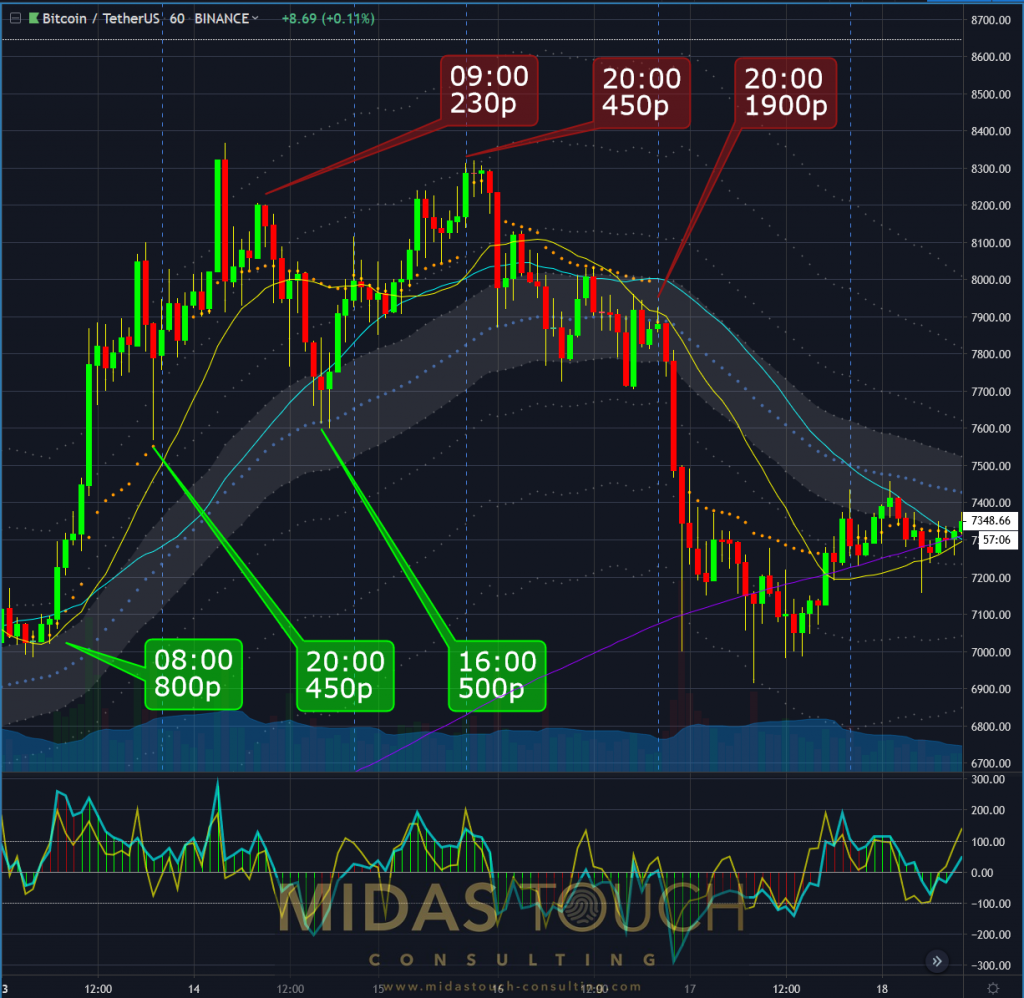
Bitcoin in Tether US, hourly chart as of May 30th 2019 a
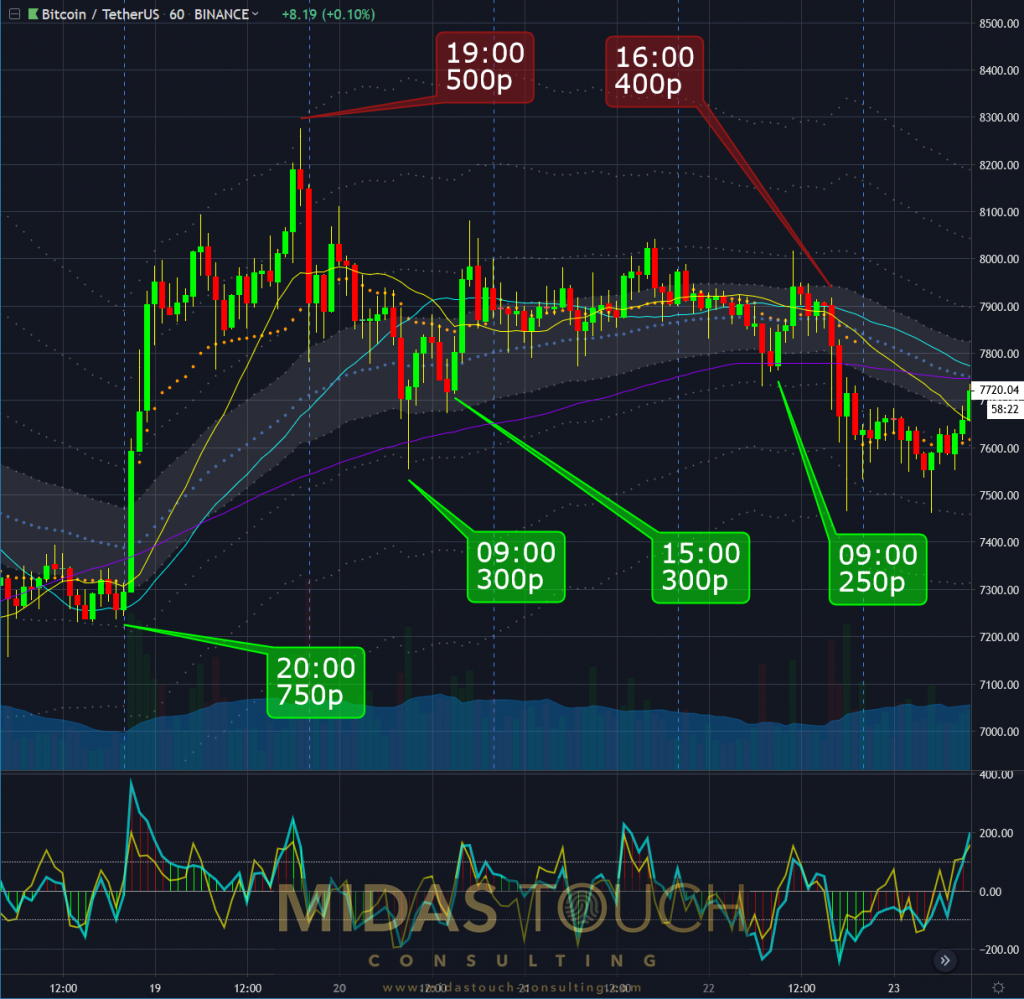
Bitcoin in Tether US, hourly chart as of May 30th 2019 b
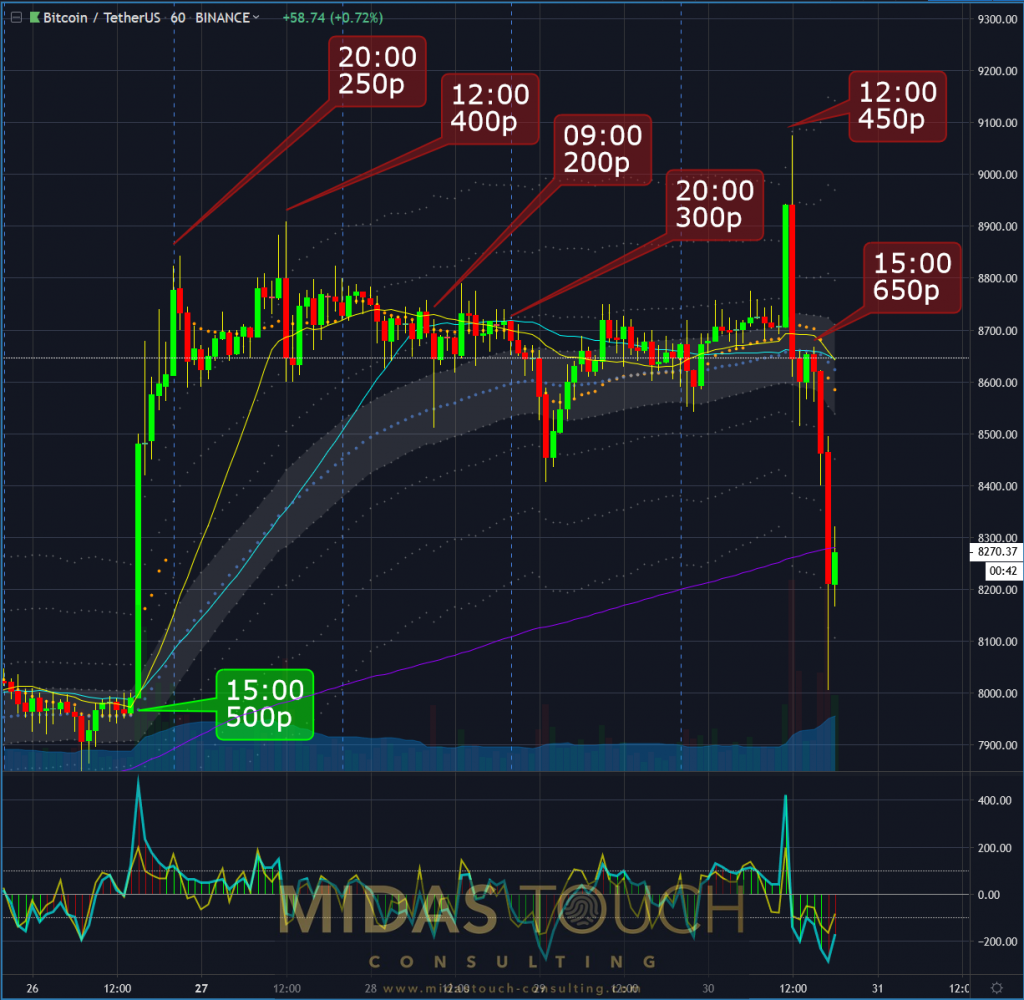
Bitcoin in Tether US, hourly chart as of May 30th 2019 c
Information like this helps to know what to look for and to time your entries and exits. It also makes time slots available to find high liquidity in the bitcoin market to avoid slippage. One can also calculate ones risk appetite with this sort of data.
In the crypto chartbook of last week we advised to reduce the total portfolio exposure. We have further reduced our market exposure and posted this action live in our Telegram channel.
The timing of these actions has been supported by the above mentioned model.
BTC/USDT 5 minute chart 5/30/2019, precise 12:00 pm EST reversal time before a US$1,075 point price drop:
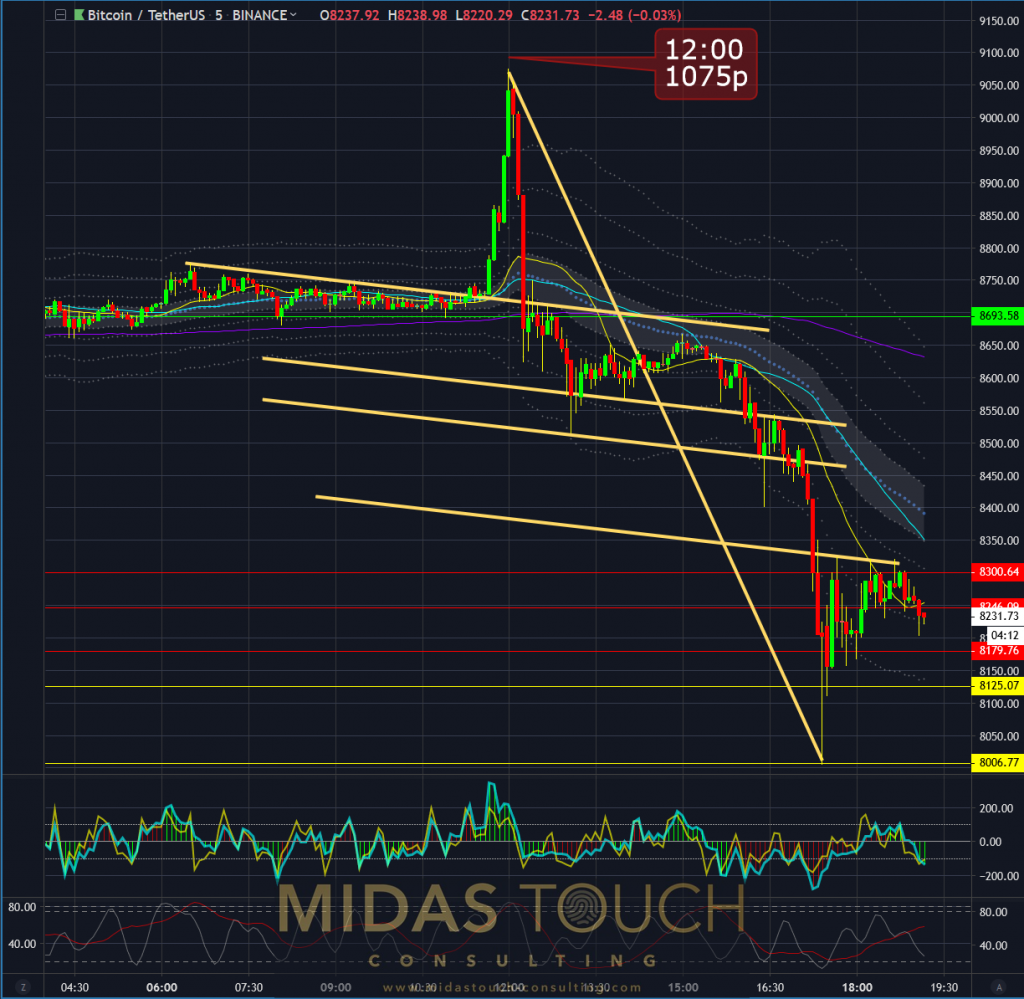
Bitcoin in Tether US, 5 minute chart as of May 30th 2019.
The weekly chart is now supportive of this exposure risk reduction and starts to confirm last weeks anticipatory move of taking first profits off the table.
Weekly chart of BTC/USDT – 5/30/2019, price advances running out of steam:
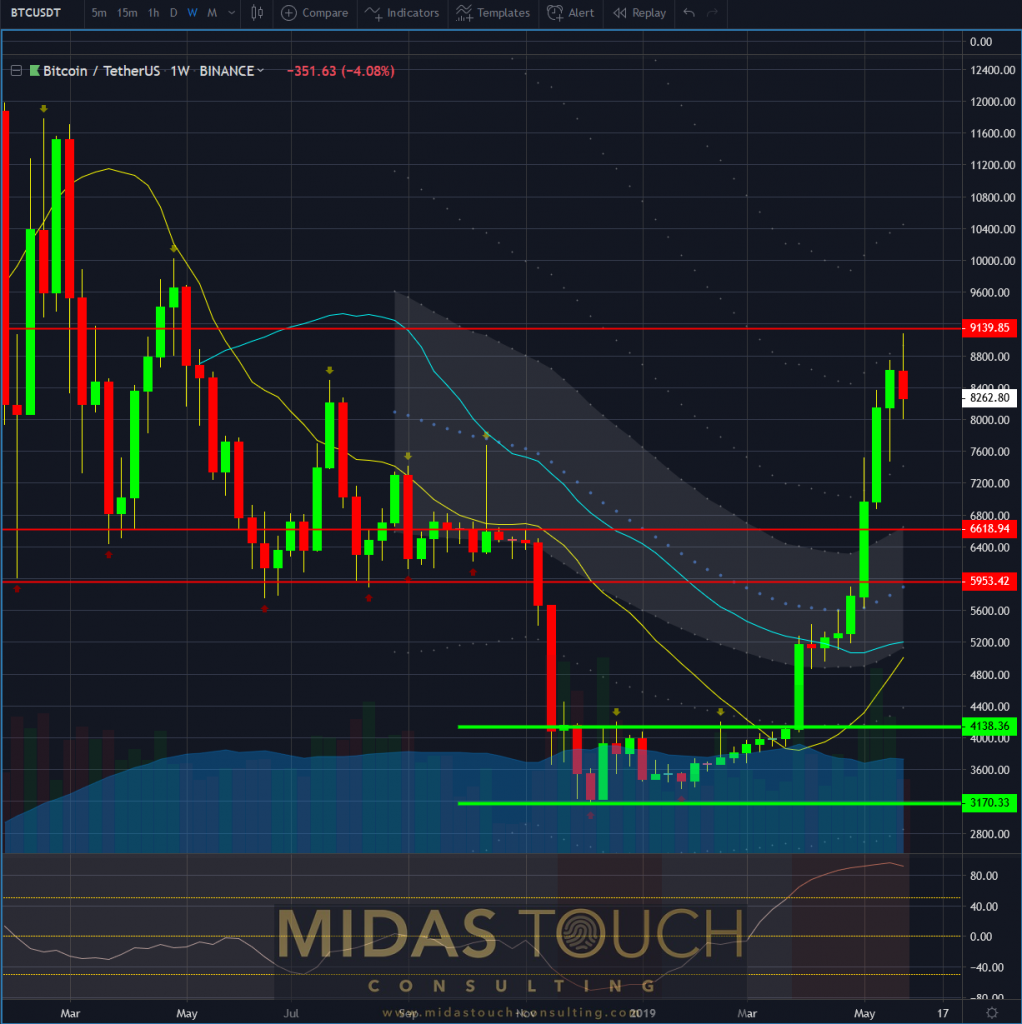
Bitcoin in Tether US, weekly chart as of May 30th 2019.
All charts timely posted in our telegram channel.
If you like to get regular updates on our gold model, precious metals and cryptocurrencies you can subscribe to our free newsletter.

