


100% Return
We are not sure of how the reader thinks about this, but in our books doubling ones money in 5 month, on a relative low risk investment, is a big thing. Where else can you make in this time span a 100% return? Not in the real estate market. You probably have to go to the casino and bet it all on red. We know the risk on that one. This can not be called investing or trading, it’s called gambling and you most likely lose all your money. But if you have put your money around the 15th of December last year in a bitcoin investment, you just hit the 100% return mark. And we urged to do just that back at the time in our chartbook from last December!
Yet, this current chart-book is not about the past of course! Much more it is about the future!
So whoever bought bitcoin within the last 5 month and hasn’t sold it yet is a winner right now. Who are these winners? In our humble opinion it is unlikely to be mainly average investors or traders. For it being a spectacular move you have heard little to none in mainstream media. There is still talk of new lows to be made, talk that the whole blockchain idea is faulty. All those who bought in the last 5 month so think differently and may be, just may be, these buyers are actually dominantly institutions. These quiet accumulations, when you examine history and various markets, are most often dominated by large players with deep pockets. Bitcoin at this time might be no different.
One dominant factor to substantiate such a theory is that the bitcoin market has changed. We had a strong directional move but volume analysis and volatility charts are not in synchronicity to prior moves of this market. Even more strong evidence for this market maturing and players hands having changed is the fact that altcoins, which were lead by the overall bitcoin market, have separated. When comparing such changes to lets say emerging markets, or other younger markets, this is a typical sign of a change or participants.
Finally, probabilities of chart patterns and other analysis has also gone through a transformation. You haven’t heard lately fancy terms like Bart Simpson pattern or anything like that since they simply vanished. Amateurs have been replaced by professionals. It is a new game.
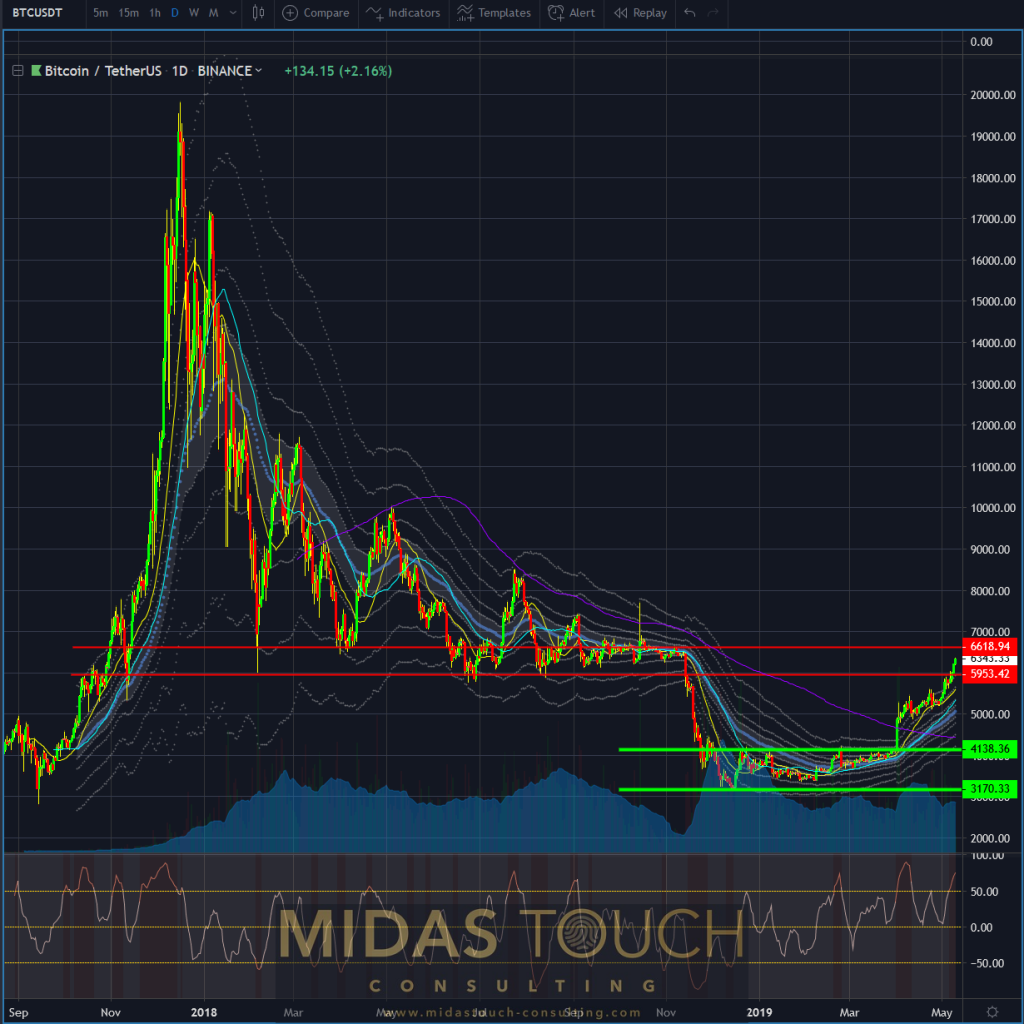
Daily chart of BTC/USDT – December 2018 lows at US$3,156 and new highs printing as of the time of writing these chart book at US$6,594:
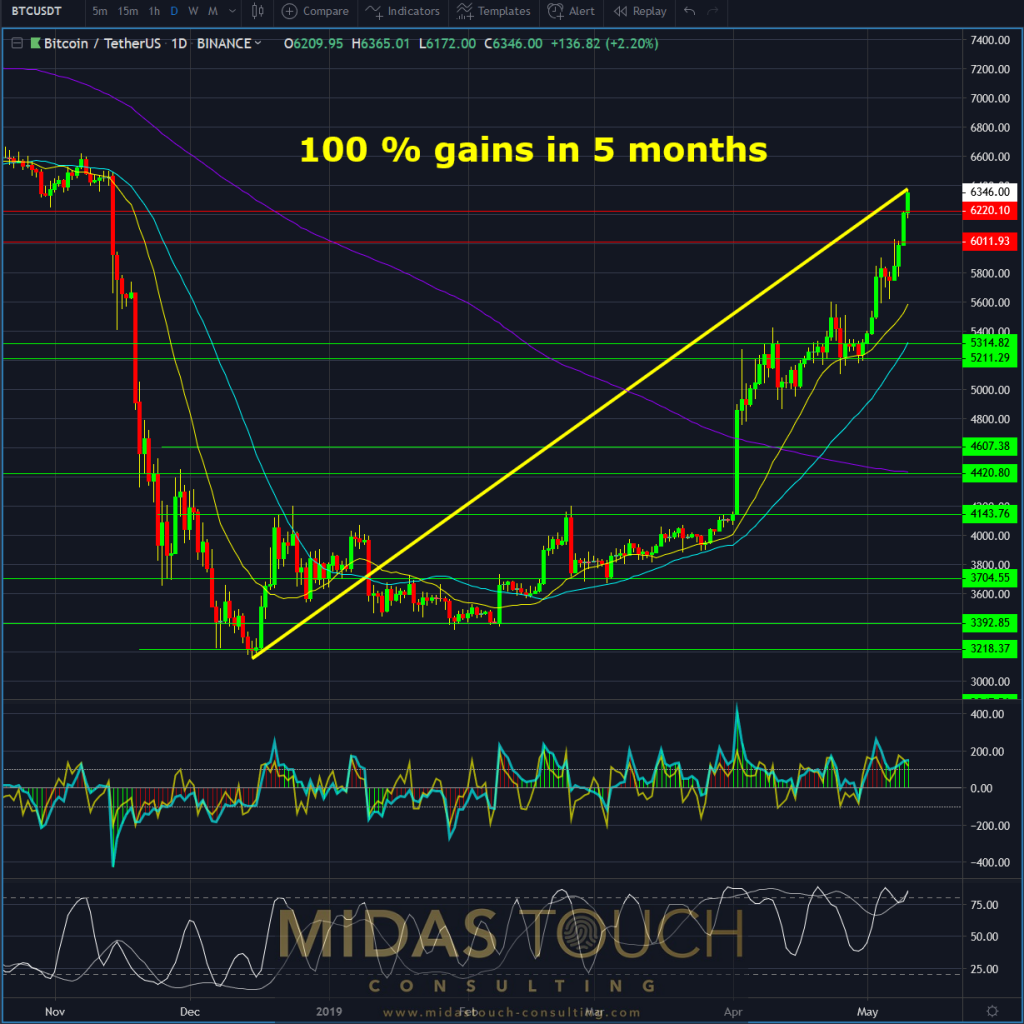
Bitcoin in Tether US, daily chart as of May10th 2019.
Looking at a monthly chart, we find surprising strength in the first third of the month of May 2019. Prices having pushed almost effortlessly through a strong distribution zone at a price band between US$5,750 and US$5,880. This long period of steep upward movements speaks for itself. It is questionable therefore, if even the US$6,385 overhead resistance will provide much of a hurdle.
Strong move in May 2019, BTC/USDT daily chart:
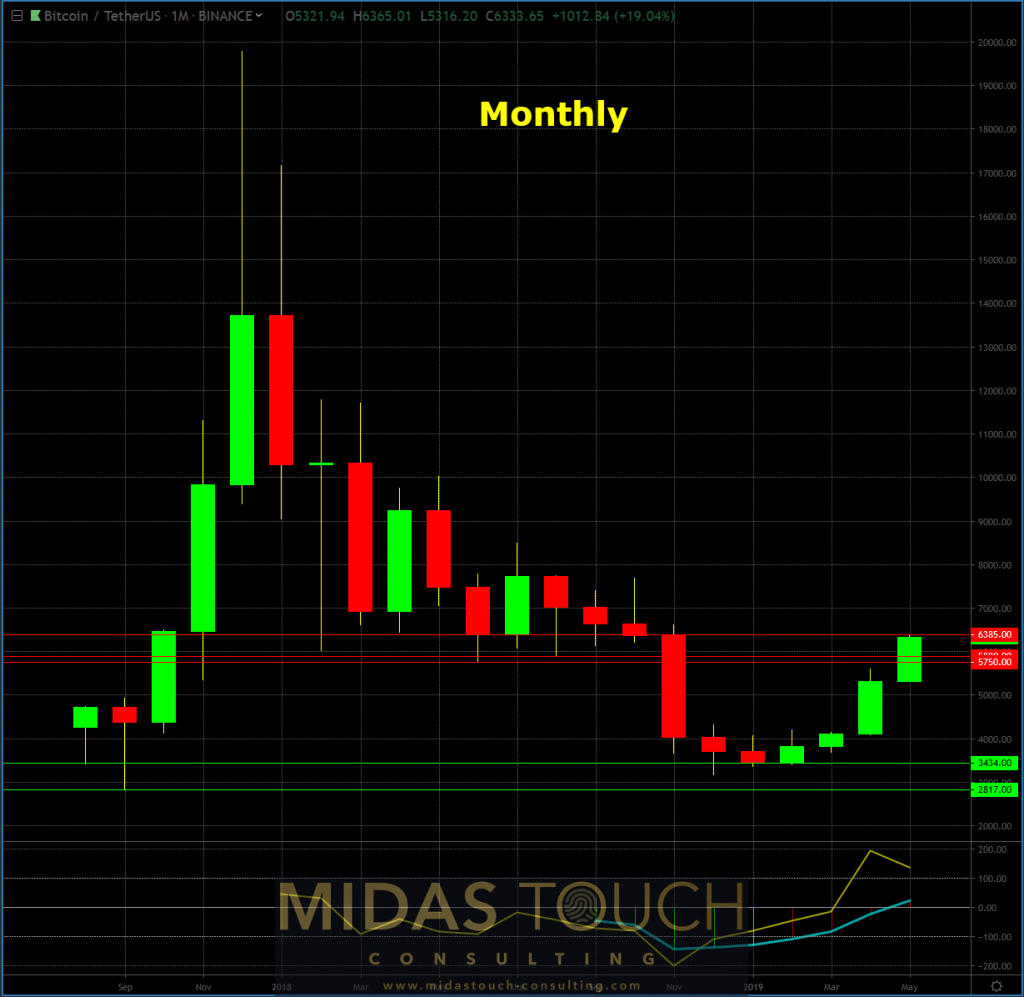
Bitcoin in Tether US, monthly chart as of May10th 2019.
A glance at a weekly chart supports the bullish theory even more. Our calculations show a 63% probability of bitcoin prices closing between US$6,178 to US$9,857 by the end of this year.
Weekly chart from May 10th 2018 of BTC/USDT – Room to move:
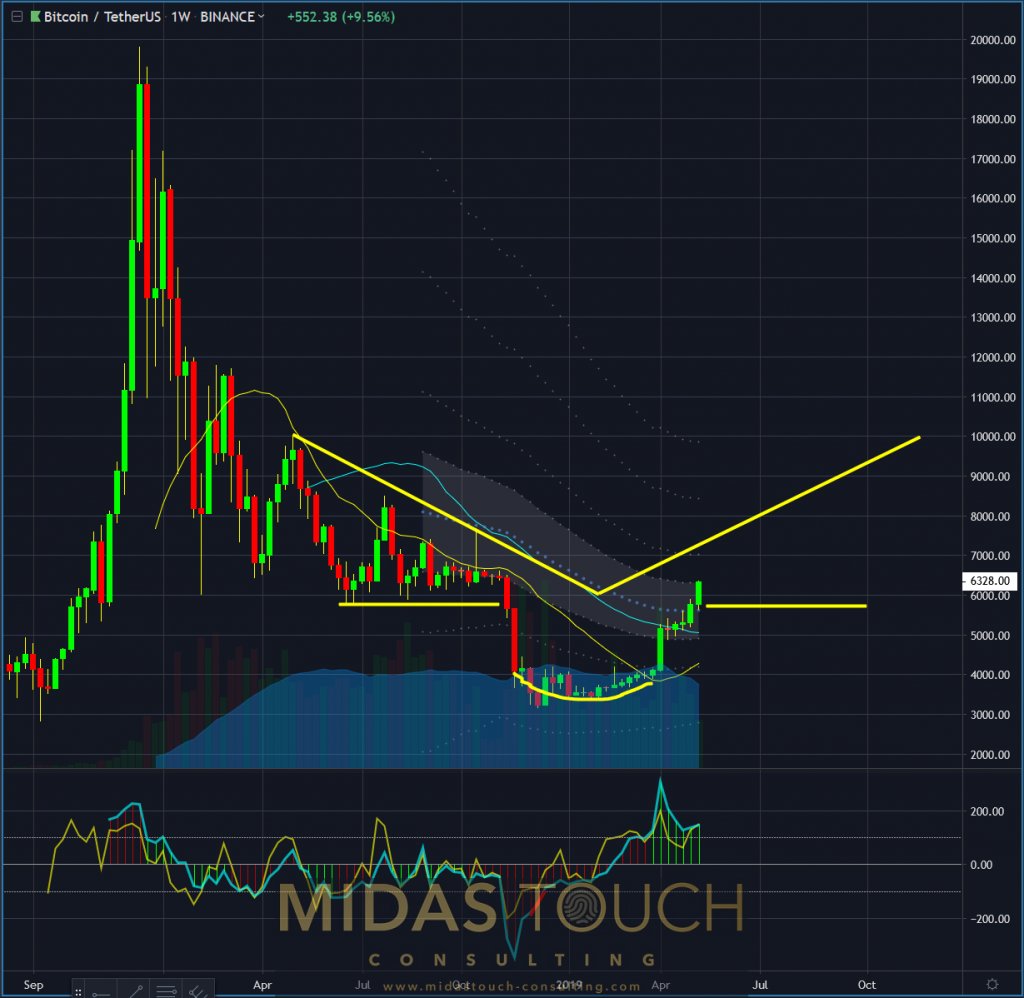
Bitcoin in Tether US, weekly chart as of May10th 2019.
What the weekly chart also reveals is a likely probability of a cup and handle formation leading to the next higher price levels. We estimated that probability at an about 56% chance. This would be the easier scenario to participate in the next leg up from a larger time frame perspective and the the longer term investors view of when to enter on low risk.
BTC/USDT – weekly chart of a probable future scenario of price development:
Bitcoin in Tether US, weekly chart as of May10th 2019.b
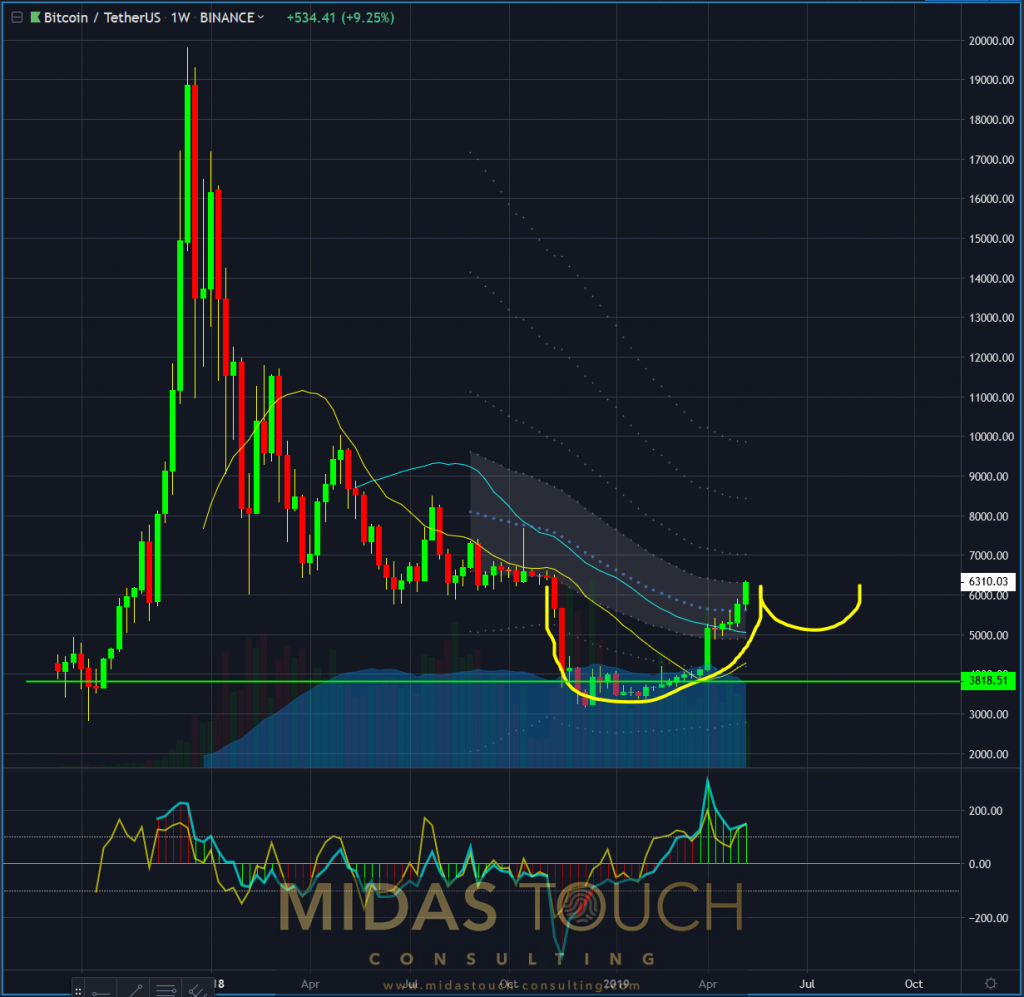
Where our predictive models see a lesser likelihood is a severe penetration of the support band between US$4,138 and US$3,170. If we should see, through most likely news driven events, prices decline this low, we expect a strong bounce prior to further declines. Therefore allowing for a “Baldwin” exit strategy of prior exposed longer term investment capital, and as such low risk investment possibilities at higher price levels.
Daily chart of BTC/USDT May 10th 2019 – 36% chance of strong declining prices without a bounce:
Bitcoin in Tether US, daily chart as of May10th 2019.b
All of this is speculation. But not all of this is pure guessing. Long term followers of our newsletter are accustomed to a fair hit rate of such prognostics. Participating in market speculation isn’t about being right each time. It is about being right more often than not.
All charts timely posted in our telegram channel.
If you like to get regular updates on our gold model, precious metals and cryptocurrencies you can subscribe to our free newsletter.

