


Value
If today’s headline would refer to the value of silver, this would be a long article. Silver’s nickname “the poor mans gold” does this precious metal not justice at all. Its amazing properties is a staple and finds itself everywhere in use in our daily life’s. Even more exciting is its increasing demand in the future as a super conductor needed in cell phones and electric cars just to name a few.
In this week’s silver chart book however, we want to point out on how to interpret the content of our newsletters. How all time frame market players can use this weekly presented information to their advantage, especially on how to extract maximum value.
Value provision by sharing principles, and in this manner providing educational value, is the obvious. This approach has built our extended fellow ship. In this publication so we want to take a very practical approach on how our low risk ideas with their weekly publication can be useful for longer term investors and shorter term market players alike.
Let us use last week´s silver chartbook as an example. You will find at the day of publication a strong call on our side to participate long term in the silver market.
Prices in Silver/USD were trading at the time at 14.40 dollar. Let’s see what the market did since then.
Daily chart of silver on May 17th:
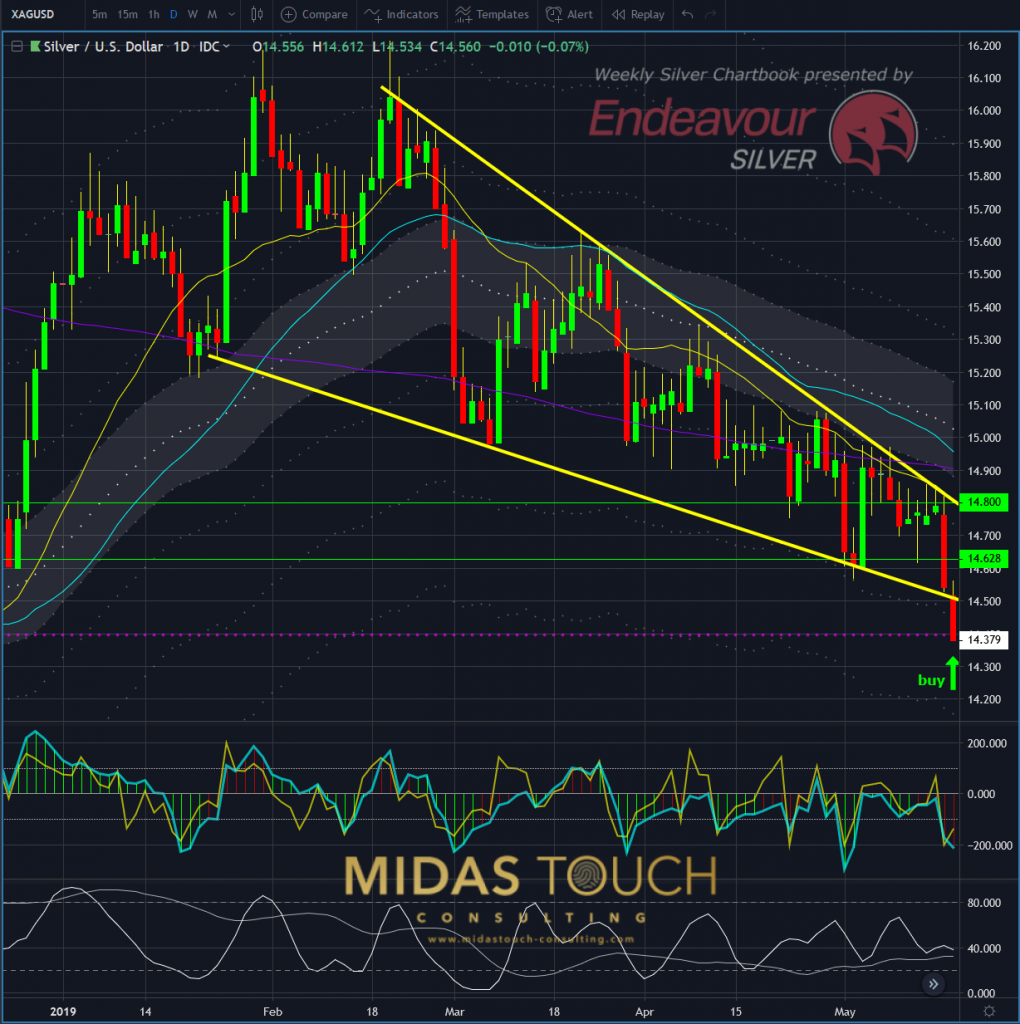
Silver in US-Dollar, daily chart as of May 17th, 2019
At first glance silver broke a bearish channel (yellow line) to the downside which of course signals a weak market!
Gold, daily chart May 17th:
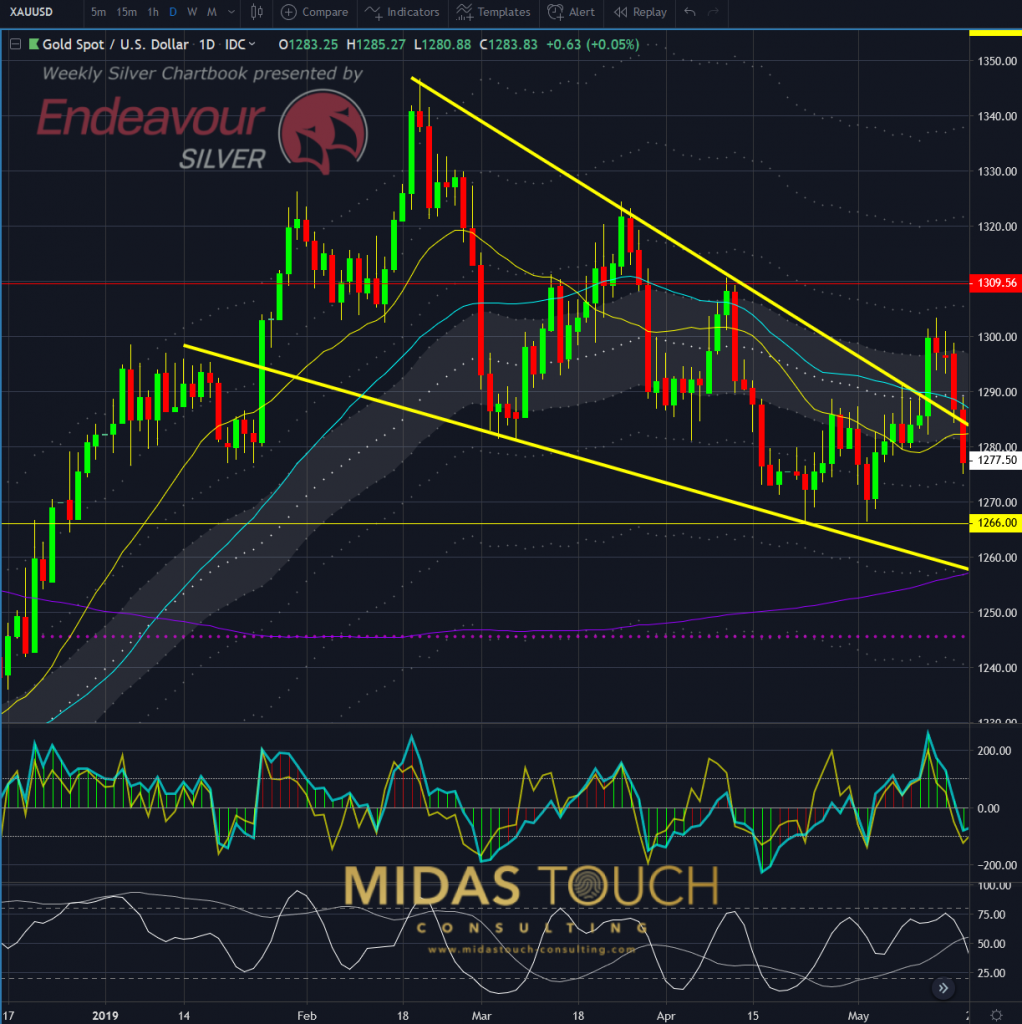
Gold in US-Dollar, daily chart as of May 17th, 2019
At the same time gold prices got just rejected at strong resistance level @ US$1,300. This too was bearish and Gold broke back into its channels range, holding prices dead in their track.
Silver, 60 minute chart May 24th:
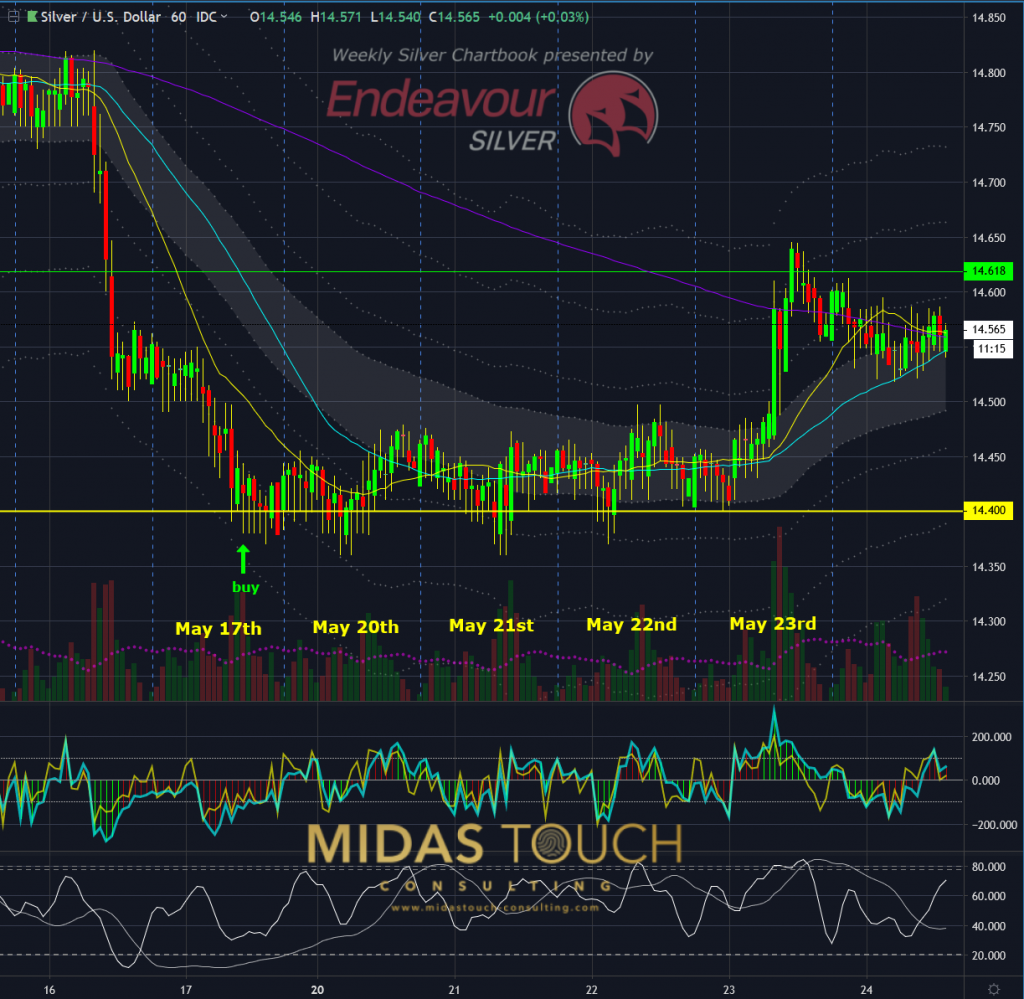
Silver in US-Dollar, 60 minute chart as of May 24th, 2019
The trader or investor following this publication had 6 days to comfortably do his or her research may it be fundamental or technical (or both) in nature and place an order at leisure.
Advancing prices after bottom building on silver, 60 minute chart May 24th:
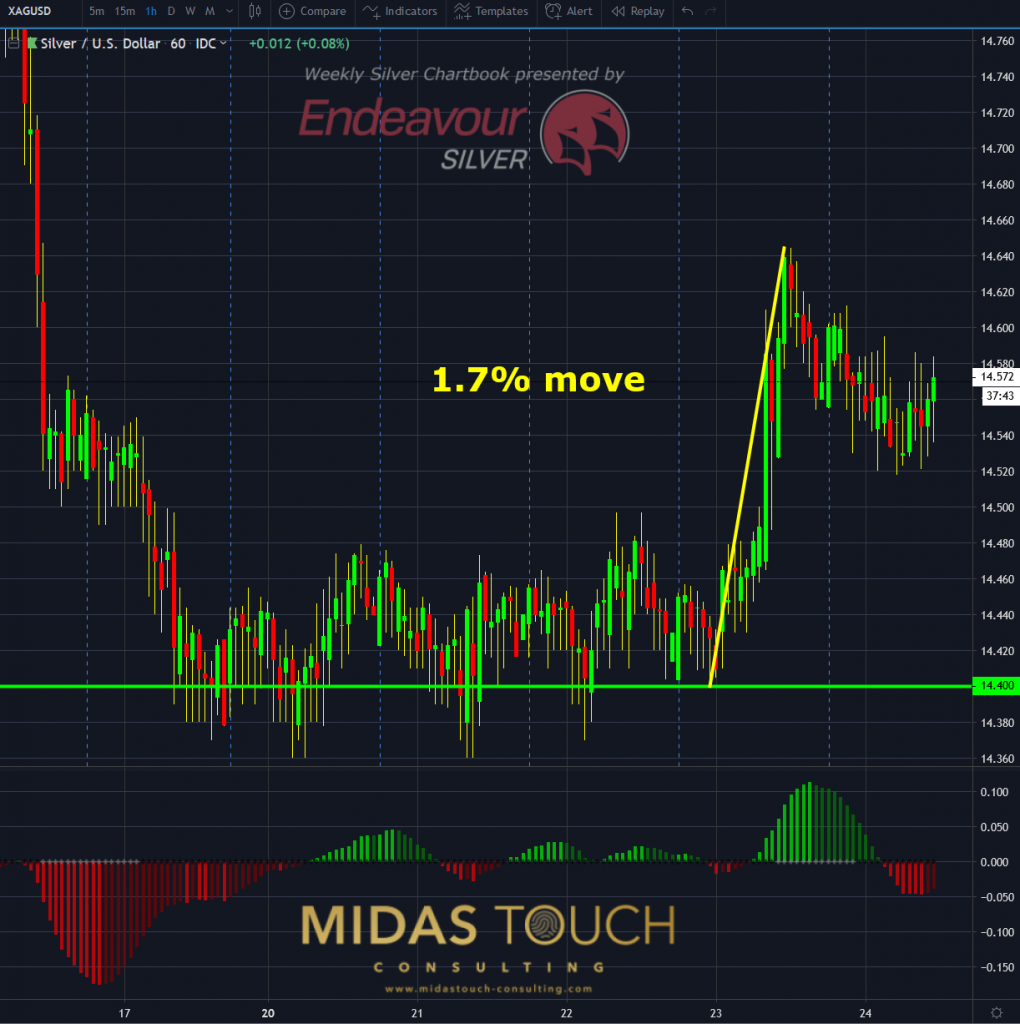
Silver in US-Dollar, 60 min chart as of May 24th, 2019 b
However, after the bottom building phase with a tight sideways trading range, silver broke higher over the last two days. This allowed for the short term or very conservative long term player to take partial profits and have exceptional risk reward ratios with a tight stop below a solid sideways range.
May be you are looking for guidance in supporting your own formed opinions and using this publications as an additional edge. Or you might be trying to improve your hit rate by extracting a principle here and there. Or you possibly might follow our signals straight up.
What we mean to say is, that no matter what your style is, no matter if it is a publication with a long term or short term outlook, you might find a morsel of truth and value in our efforts to bring true value to your investments.
We want to thank you for your loyalty and your very valuable time in reading our weekly chartbook and will continue to strive to produce content that is valuable to our readers.
Follow us in our telegram channel.
If you like to get regular updates on our gold model, precious metals and cryptocurrencies you can subscribe to our free newsletter.

