


And where from here?
Many just woke up to Crypto being back in mainstream media, after a substantial move has already taken place. Therefore of course, the most important question probably is: “And where from here?”
This can easily trigger a fear of missing out and a behavior with rushed moves into the market and chasing trades. This is not supportive to consistent returns . Mutually unfruitful behavior is frustration and ignoring future opportunities.
So let´s see what actually can be done if one missed this first leg and if there is true opportunity still available. The best start is always a clear picture. And clarity always comes from removal, and higher time frame reviews provide just that.
In a chartbook of ours from July last year we talked about seasonality and this comes into play again right now (please review). It was shown that substantial moves in bitcoin are the norm and how they are typically distributed throughout the year.
Monthly chart of BTC/USD – 2017 February to May:
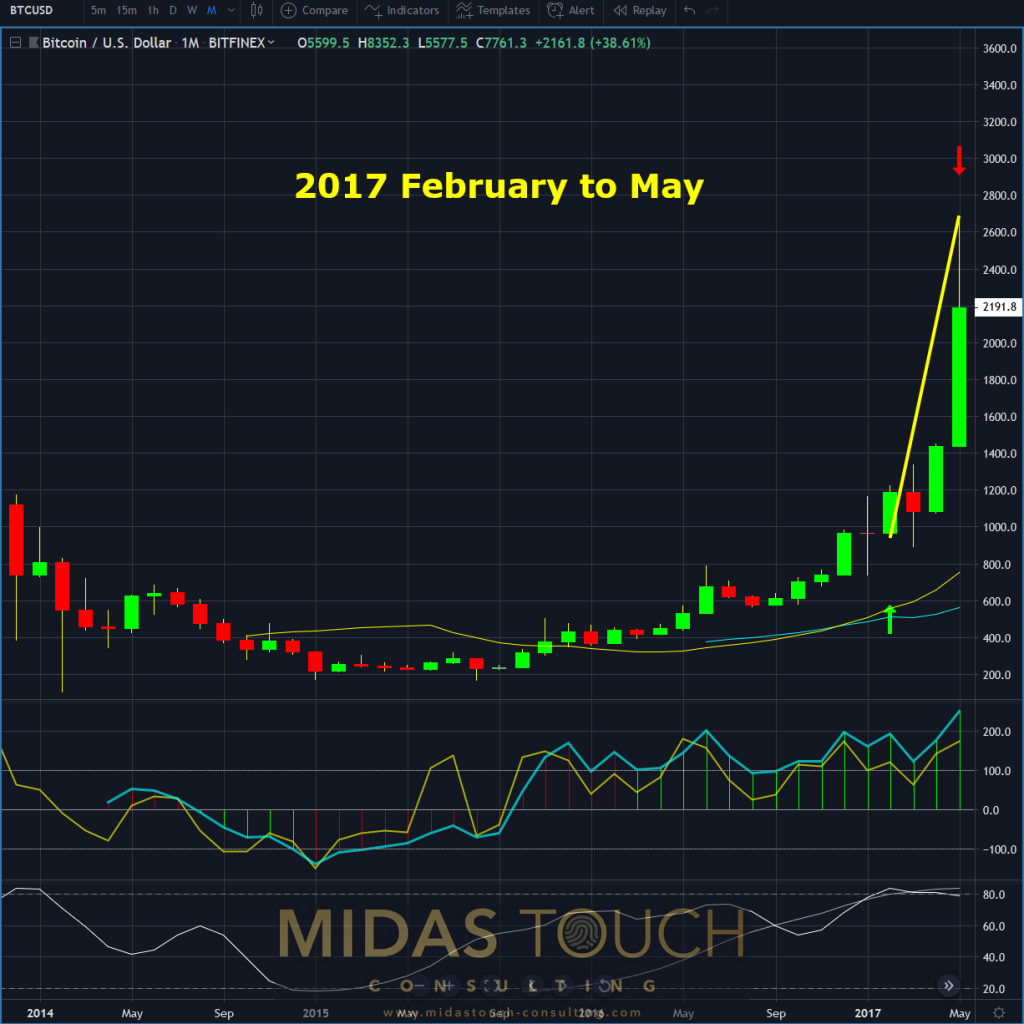
Bitcoin in US Dollar, monthly chart as of May 2017.
The chart above reveals that 2 years ago we had a mutually strong move from February to May as we just enjoyed this year.
BTC/USD monthly chart 2019 February to May:
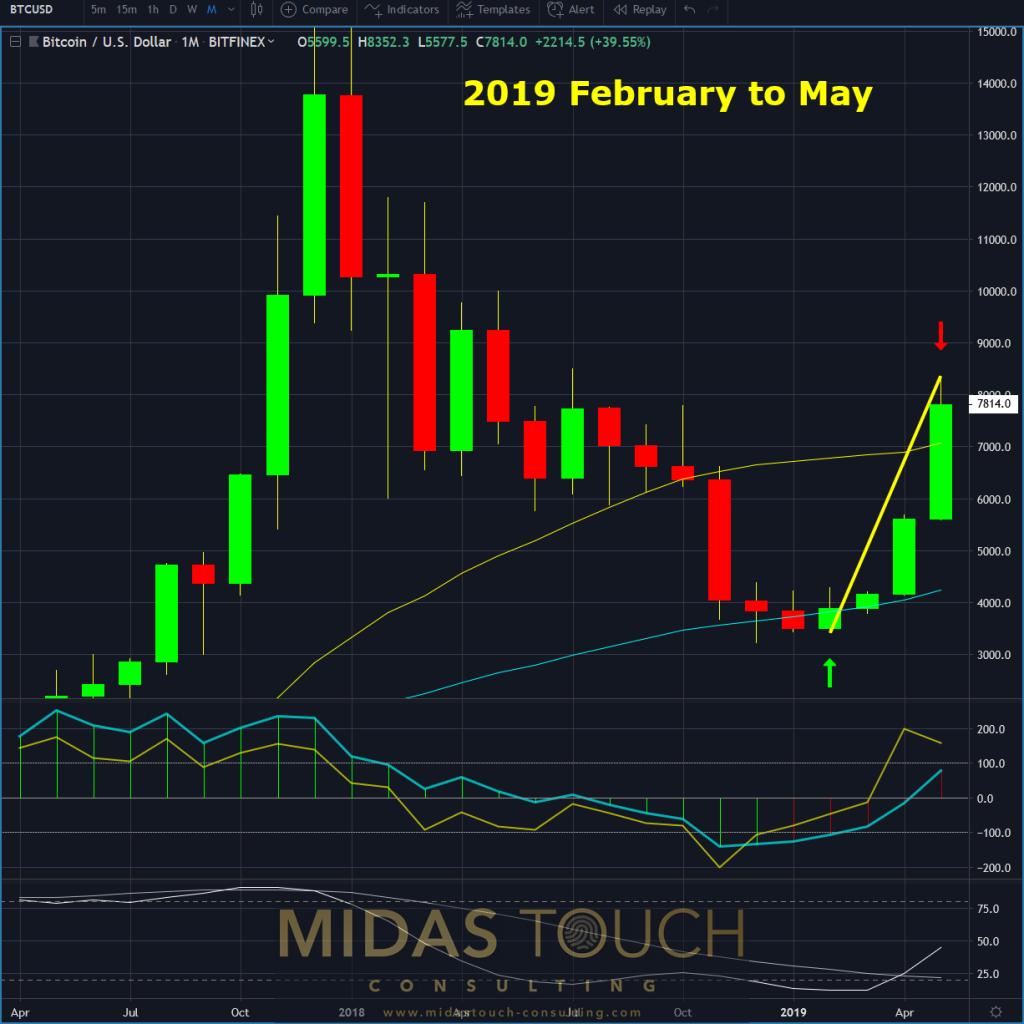
Bitcoin in US Dollar, monthly chart as of May 20th 2019.
Let´s compare these two moves:
2017 (February to May) total range: US$936 to US$2,690 = 187% actual advance: US$1,081 to US$2,191 = 103%
2019 (February to May) total range: US$3,405 to US$8,352 = 145% actual advance: US$3,503 to US$7,840 = 124%
Now, the month of May is not over yet, but we already get a pretty clear picture of how we have experienced similar advances. This brings us to the initial question: “And where from here?”
Well, this is what happened in 2017:
Monthly chart of BTC/USD – June to December, total range advance 872 percent:
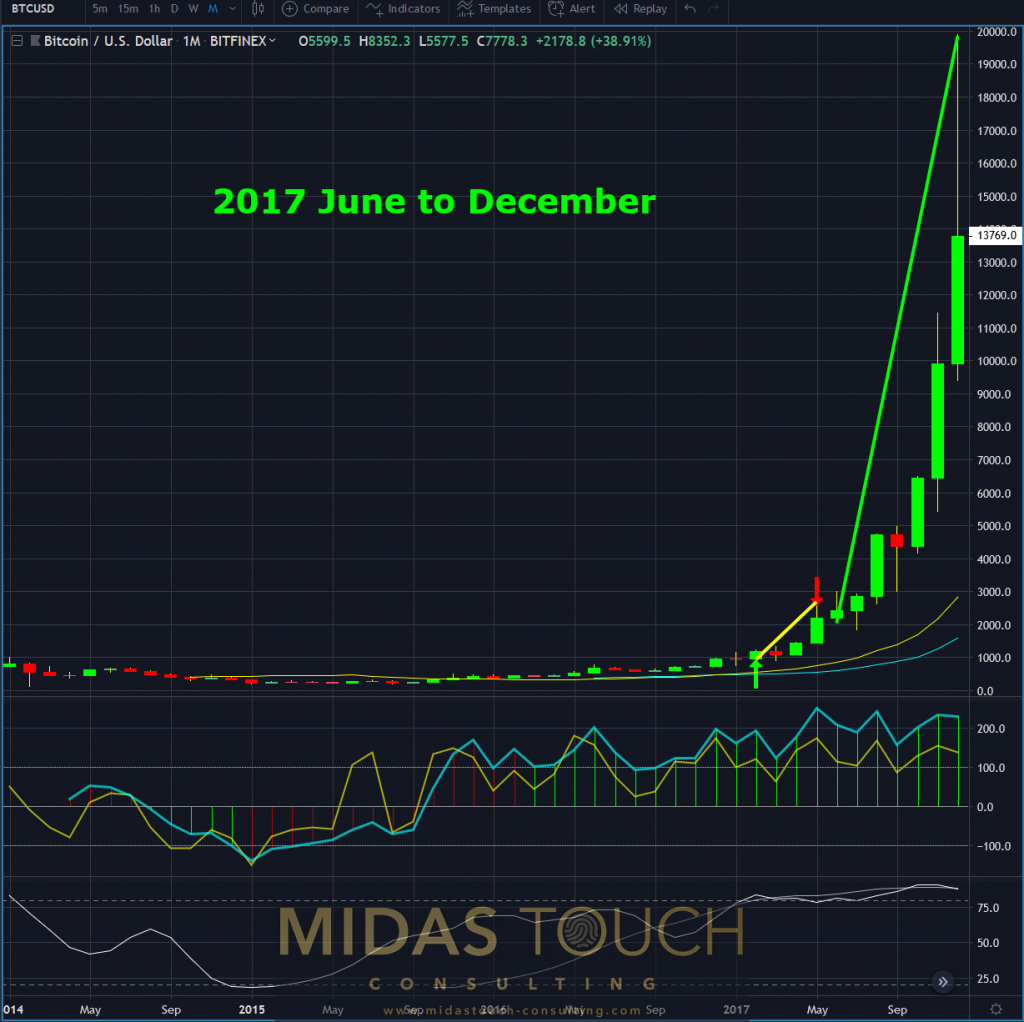
Bitcoin in US Dollar, monthly chart as of December 2017.
This not to show that we expect a similar move for this year. This is to illustrate that it is of no use to be in any way confused, desperate or frustrated if one has missed an initial move. The market is at all times full of opportunities and as such any emotional behavior is not warranted for. Plan your moves and execute on those plans.
It is also advisable to not take timing from news. They are counter cyclical to what your action should be. Setting a pattern of market review other than headlines from the papers is a good discipline.
If you combine the cyclical patterns from last year´s chartbook with this week´s advise as a guideline of possible times to pay attention to the market, you might find yourself already soon within opportunity’s reach again.
All charts timely posted in our telegram channel.
If you like to get regular updates on our gold model, precious metals and cryptocurrencies you can subscribe to our free newsletter.

