


Confluence
In last week´s chart book we illustrated a way on how to reduce risk through a reentry strategy. We are aware that each market participant has to pick his or her time frame in which to execute and hold positions. This is important from a psychological perspective to feel comfortable with ones exposure time to the market. It may also simply be dictated by work commitments and their resulting time limitations of how frequently one can observe and act upon the market. Today’s view at the market is dedicated to the long term buy and hold traders, investors and those who seek to buy physical silver. The reason for this is that we see strong evidence of confluence.
We are in the business to stack odds. The more the better. A multitude of reasons pointing towards a high probability of a likely outcome in our favor of a investment scenario – that’s what we are looking for. The higher one steps up in exposure time frame, those moments of confluence do become more scarce in frequency..
From a time perspective we are right in front of the so called “summer doldrums”. We are also aware of the fact that a strengthening US-Dollar can influence a bearish outcome towards precious metal prices. But still we believe that it is time to act.
Let us look at some charts to substantiate such a hypothesis.
Four hour chart of silver shows a rather choppy environment of uncertainty, which points towards higher time frames to avoid the “noise”:
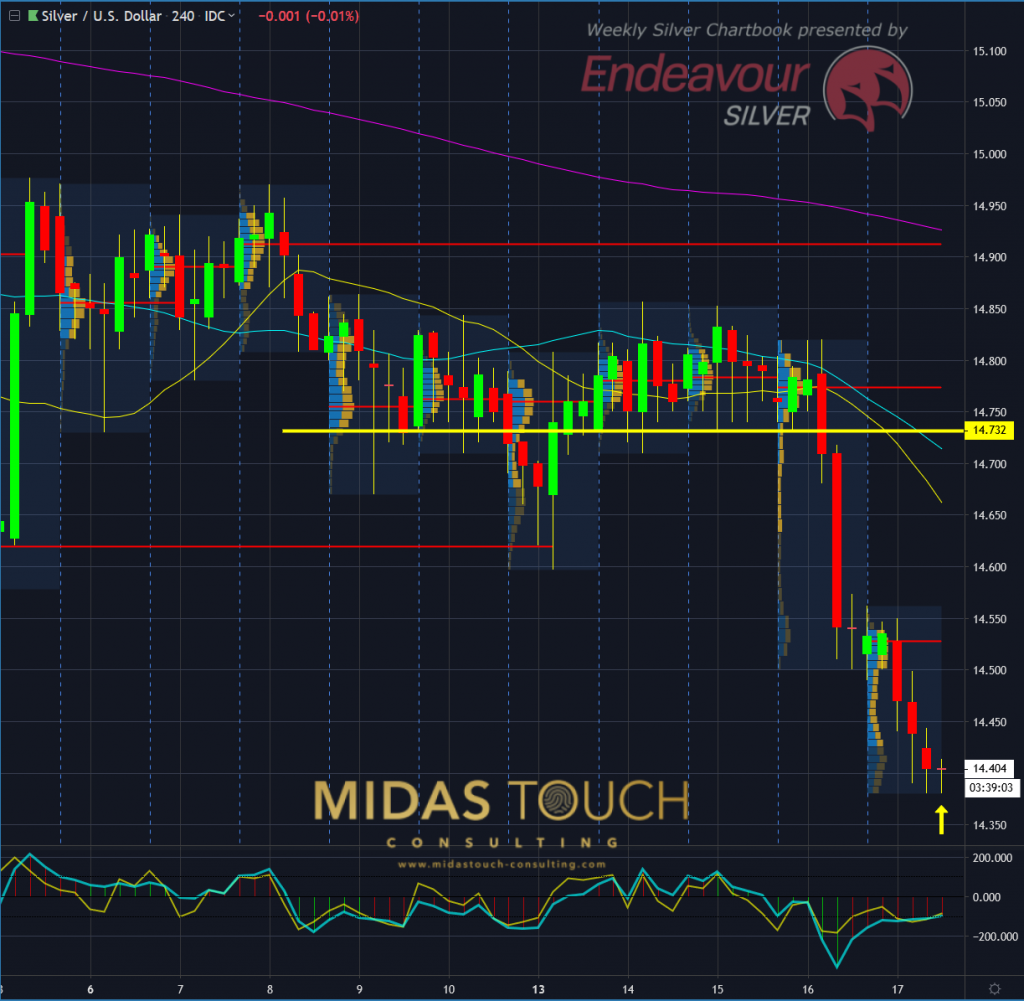
Silver in US-Dollar, four hour chart as of May 17th, 2019
Silver weekly chart, deep penetration into strong support zone on momentum (action reaction principle):
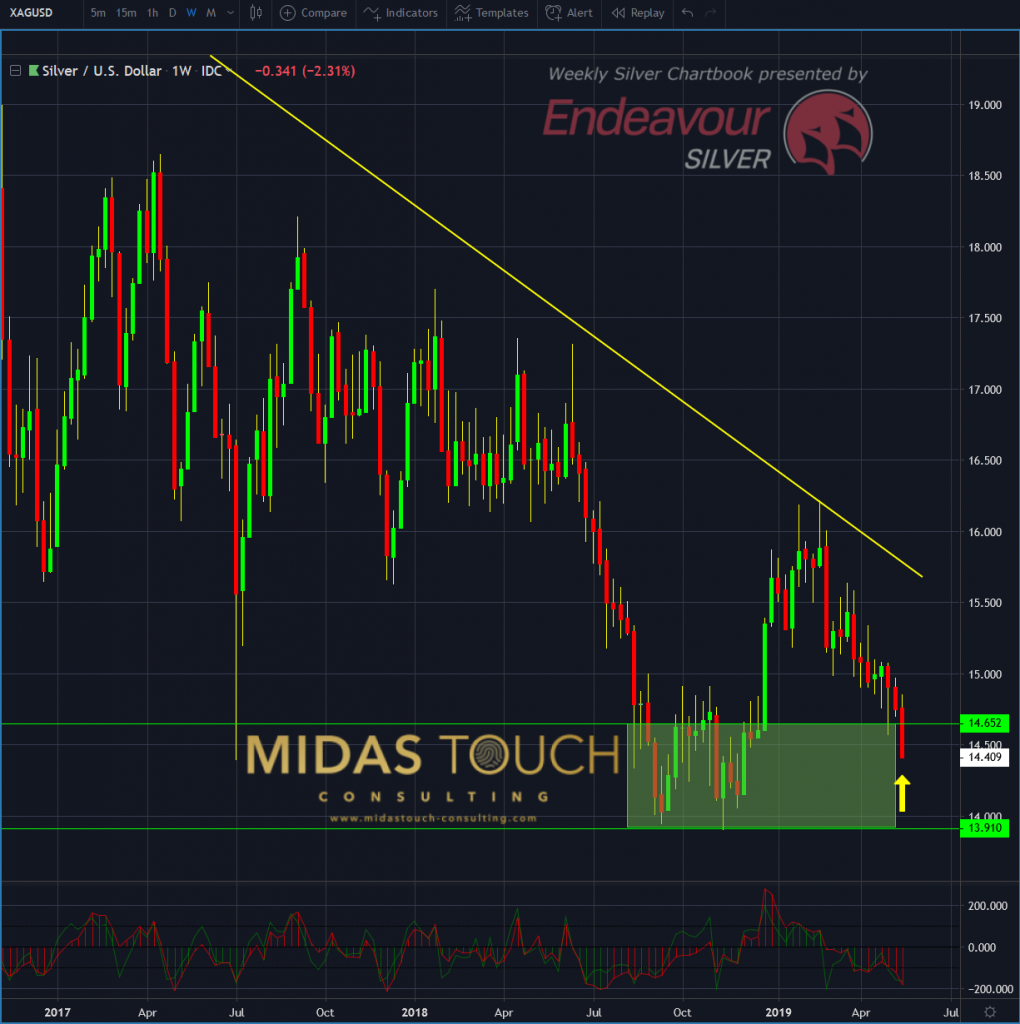
Silver in US-Dollar, weekly chart as of May 17th, 2019
Weekly trend line support on silver chart:
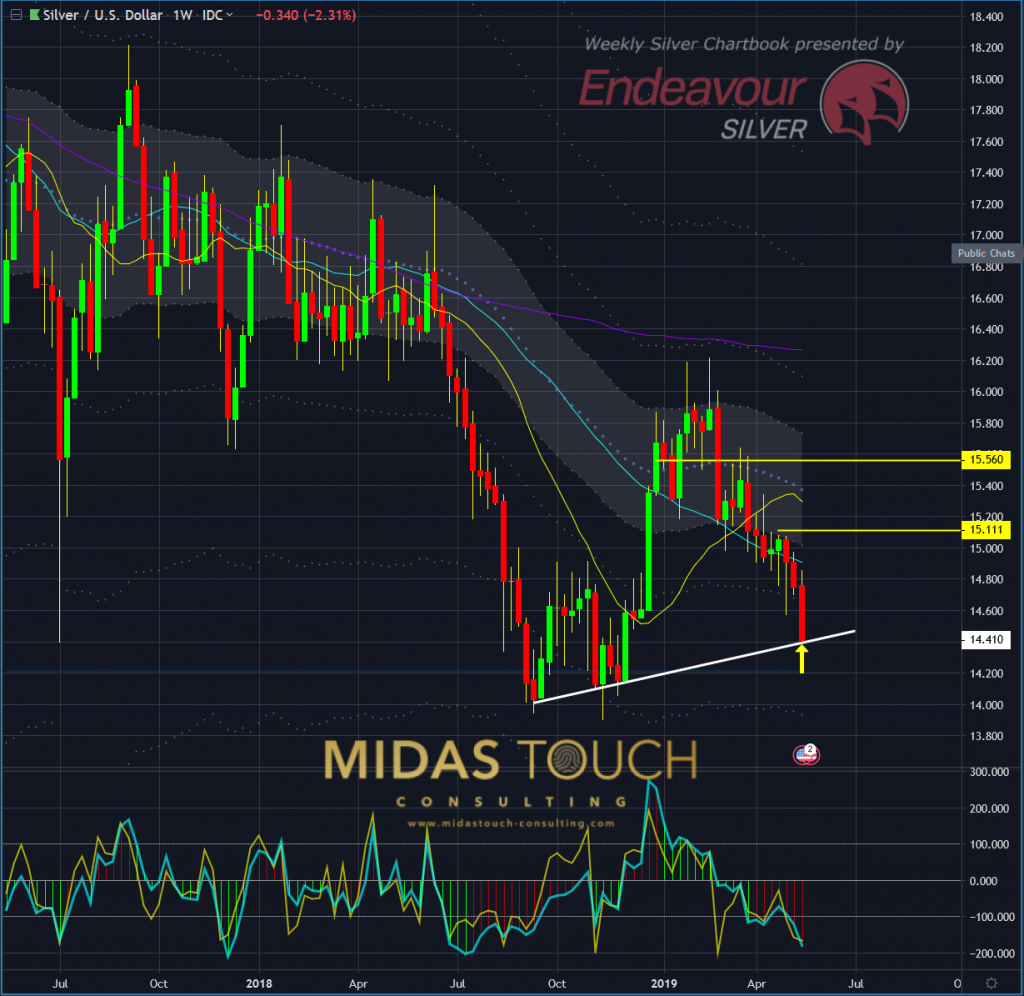
Silver in US-Dollar, weekly chart as of May 17th, 2019
Monthly silver chart, retracement harmony and upcoming time cycle completion:
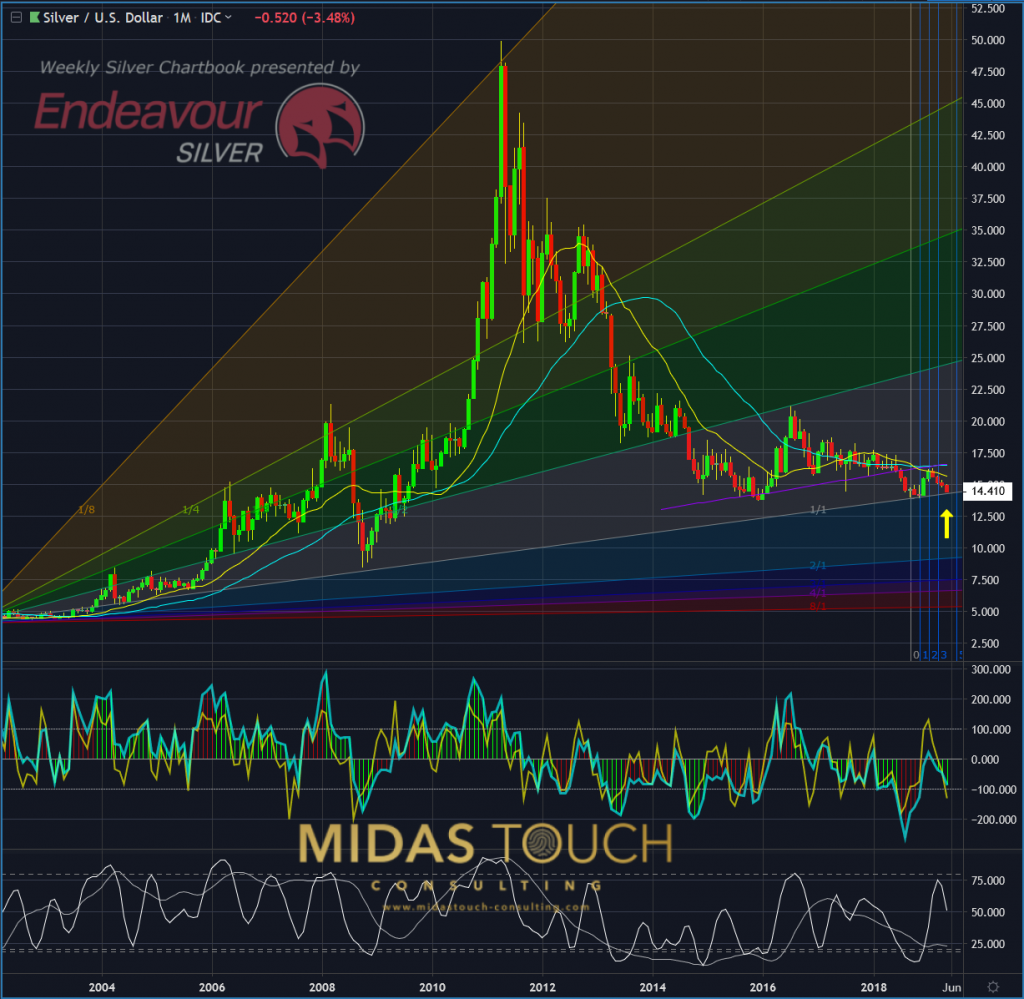
Silver in US-Dollar, monthly chart as of May 17th, 2019
Chart of silver on a monthly time frame showing clearly excellent risk reward ratios:
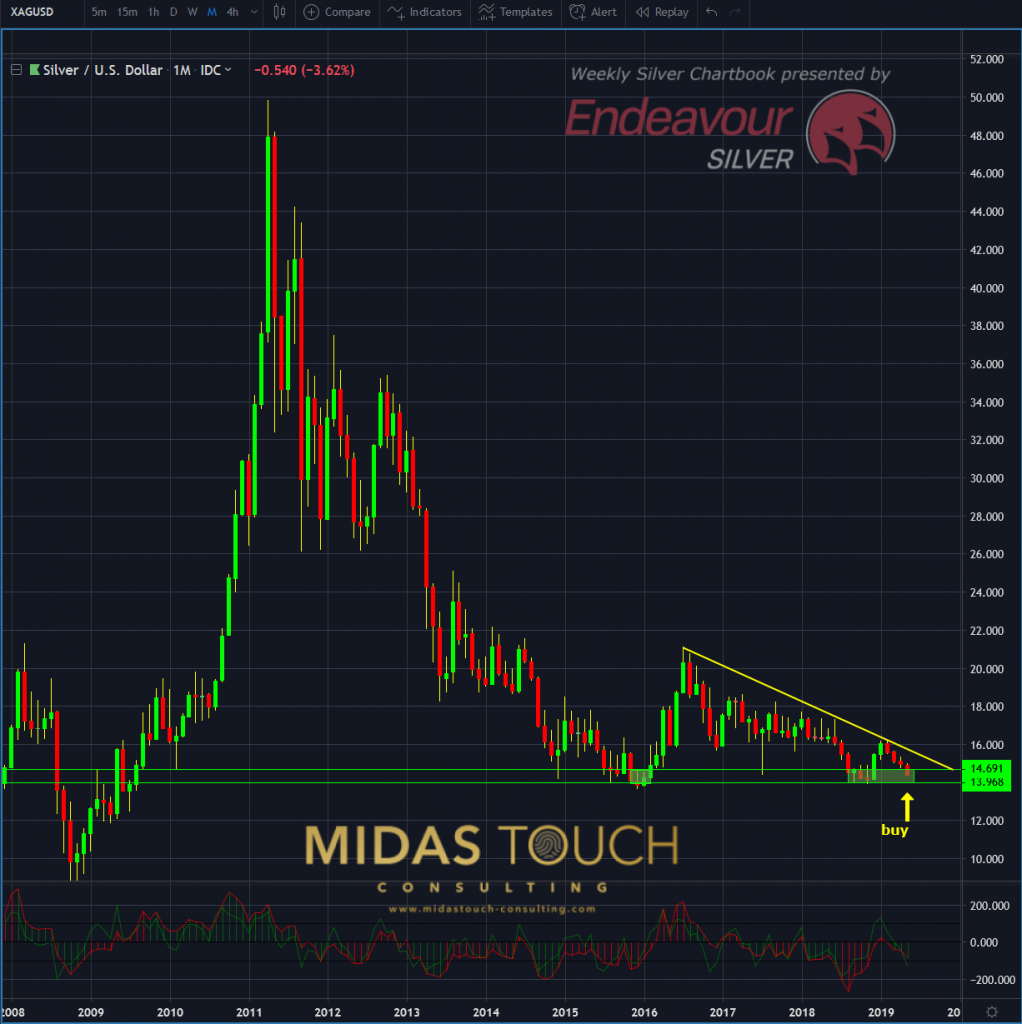
Silver in US-Dollar, monthly chart as of May 17th, 2019
From this higher time frame perspective there is evidence that exposing capital to the market right now, is a low risk move. Acquiring a portion of physical sliver here, is a proposition with possible beneficial outcome as well.
As mentioned earlier this entry is aggressive in regards to the typical cyclical behavior of the precious metal sector throughout the year. It is the preference of the investors style to hunt for bargain prices. This would be the approach of a contrarian – stepping in when sharp price declines make the average market participant exit. The alternate choice is to wait for a later point in time when prices confirm entries. In this case a break of the yellow down trend line to the upside by price (as seen in the monthly chart above).
No matter what your risk appetite might be… Whether you rather step in for the cheaper price right now or wait for confirmation… The picture that the silver market is painting here… is one of CONFLUENCE.
Follow us in our telegram channel.
If you like to get regular updates on our gold model, precious metals and cryptocurrencies you can subscribe to our free newsletter.

