


Point of interest
Many find themselves baffled by the recent action in the precious metal sector. While many awaited a quiet summer time to immerse, gold and silver are in strong uptrend since three weeks. No one knows if this move will be sustainable and how long it will last. Looking back, we swiftly took action at the lowest risk point to be positioned for this possibility at a point in time, when only a few others were looking. Consequently we already got rewarded with nice returns and find ourselves in a very low risk trade. If you have missed the evolution of this trade unfolding from its beginning you will find answers within our last few chartbook publications. Starting with the one from May 17th 2019. We find this to be a point of interest (POI) here, both in time and price behavior.
Our first long term entry on silver in mid of May this year was built upon confluence and low risk factors. Five weeks later we see more evidence of what might be at play.
Monthly chart of the gold volatility index 6/21/2019,”something is moving?”:
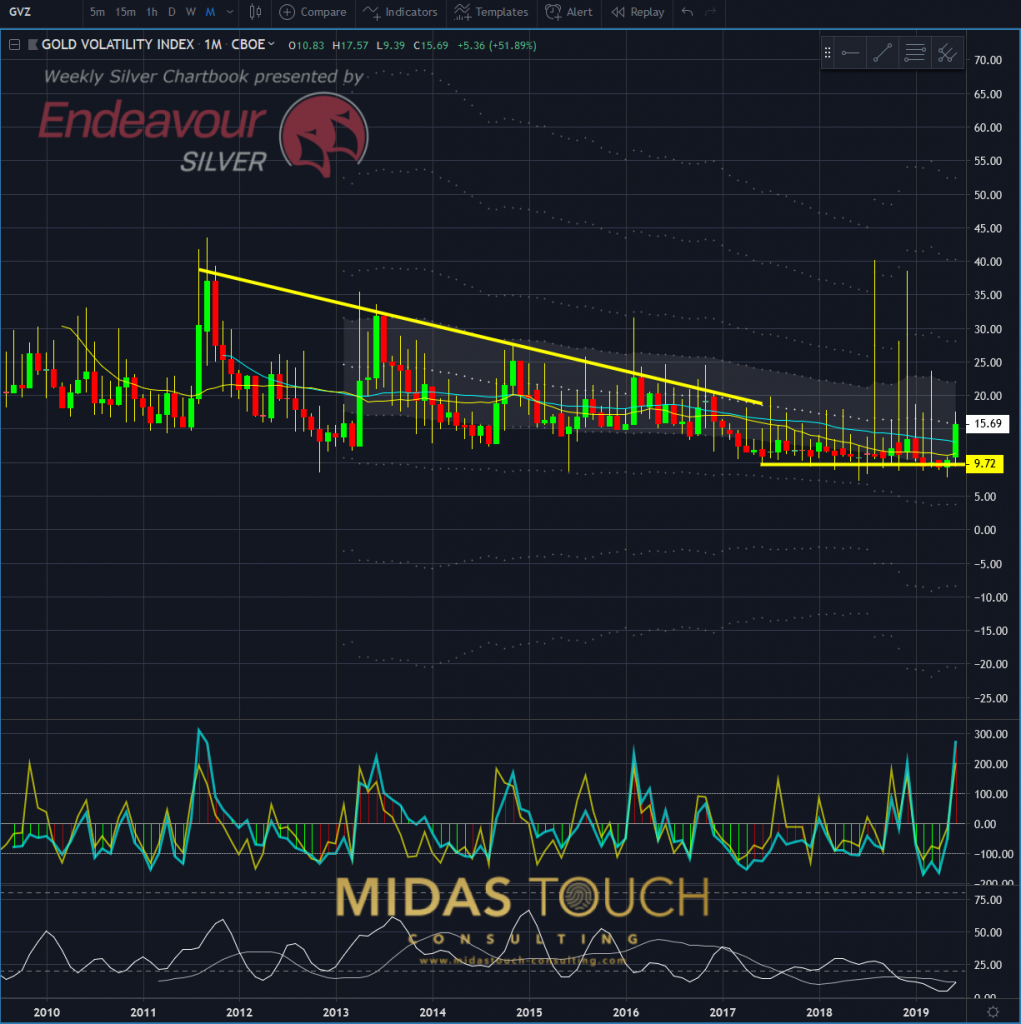
Gold Volatility Index, monthly chart as of June 21st, 2019
The chart above shows a steady decline of volatility in the gold market since 2012. Starting in June 2017, 24 months ago, volatility literally meandered most of the time below the value of ten. Something seems to rumble so within this months action (very right green candle). Volatility has increased over 50%. This leads us subsequently to the next chart.
Monthly chart as of June 21st 2019, Gold, possible range break scenario:
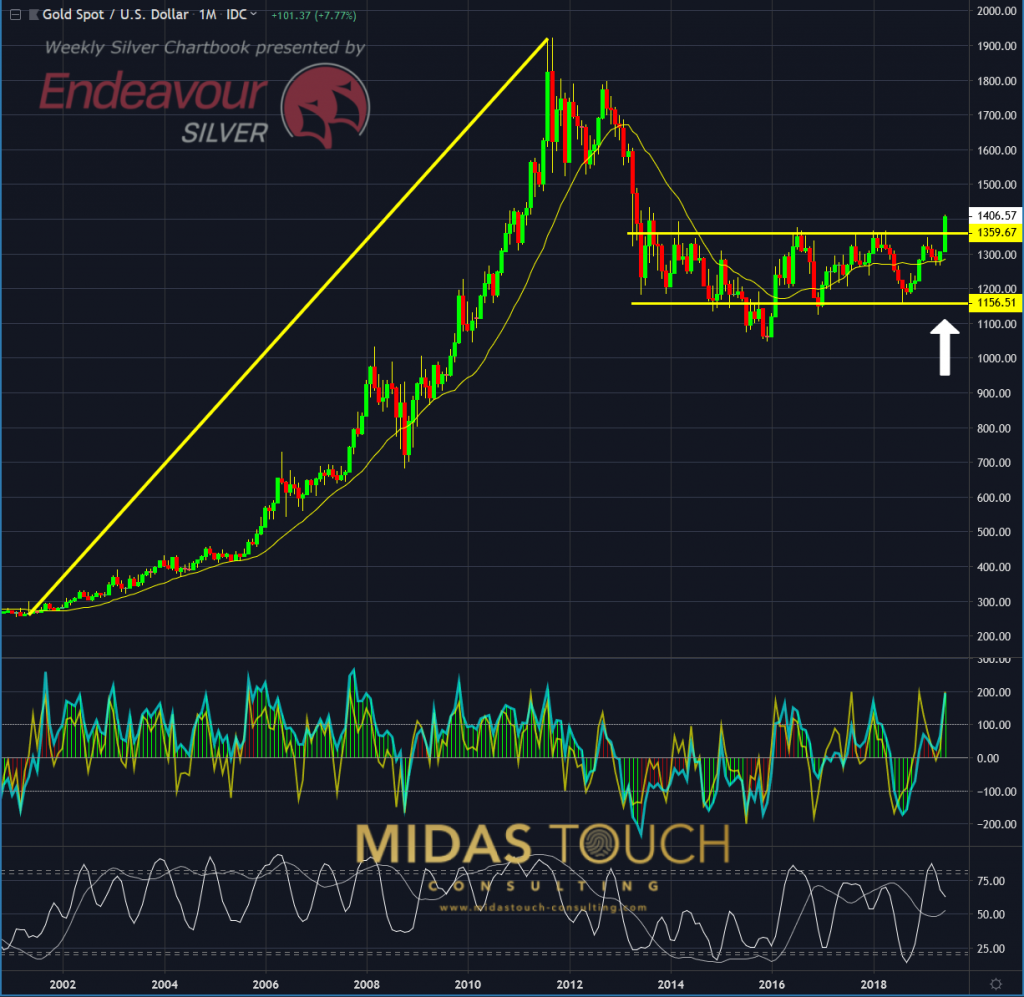
Gold in US-Dollar, monthly chart as of June 21st, 2019
Gold viewed from a monthly perceptive reflects the volatility charts behavior. While volatility levels were ‘healthy’ in Golds directional price move up from 2002 to 2011, recent years range bound trading of gold resulted in a shrinking of volatility levels.
The white arrow indicates a possible price break through the upper range resistance. Along with volatility picking up as well, this could mean a confirmation and possible validity of the move.
June 21st 2019, Gold (yellow line) versus Silver/US Dollar (red line), monthly chart:
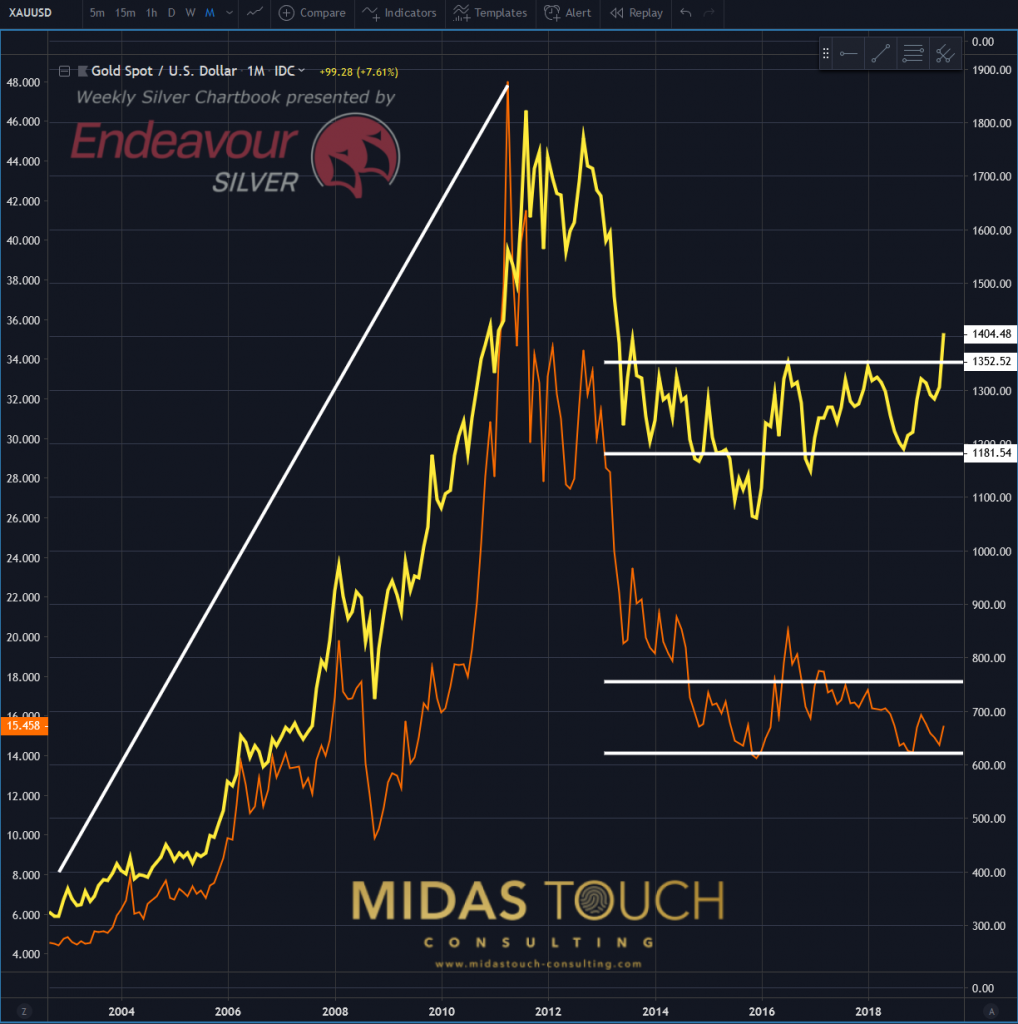
Gold versus Silver in US-Dollar, monthly chart as of June 21st, 2019
Why did we start out this silver chartbook with gold charts? If you have a look above you will find a comparison of the both precious metals. A relationship between gold (yellow line) and silver (red line) is obvious. They both traded directional upwards prior to 2012, and they were both range bound trading shortly thereafter.
There is a significant difference to be identified just as well. While gold has swiftly moved through its yearly range and has broken the upper resistance zone, silver has just started its move and is still within its trading range. A multitude of possible interpretations to this can be found. Some might say this is relative weakness within the precious metal sector and would claim as such silver to be the lesser attractive play.
What if so viewed through the looking glass of human emotional behavior. Imagine a scenario where gold, already ‘expensive’ (in relationship to production costs of getting it out of the ground) is running into overbought price levels and distribution resistance zones. At this point ‘ the poor mans gold’ as silver is called at times, might get into the forefront again and could very well produce, from a percentage on return profitability perspective, significant results and very much outshine its golden counterpart.
60 minute chart June 21st 2019, Silver/US Dollar, nice profits on smaller time frames as well:
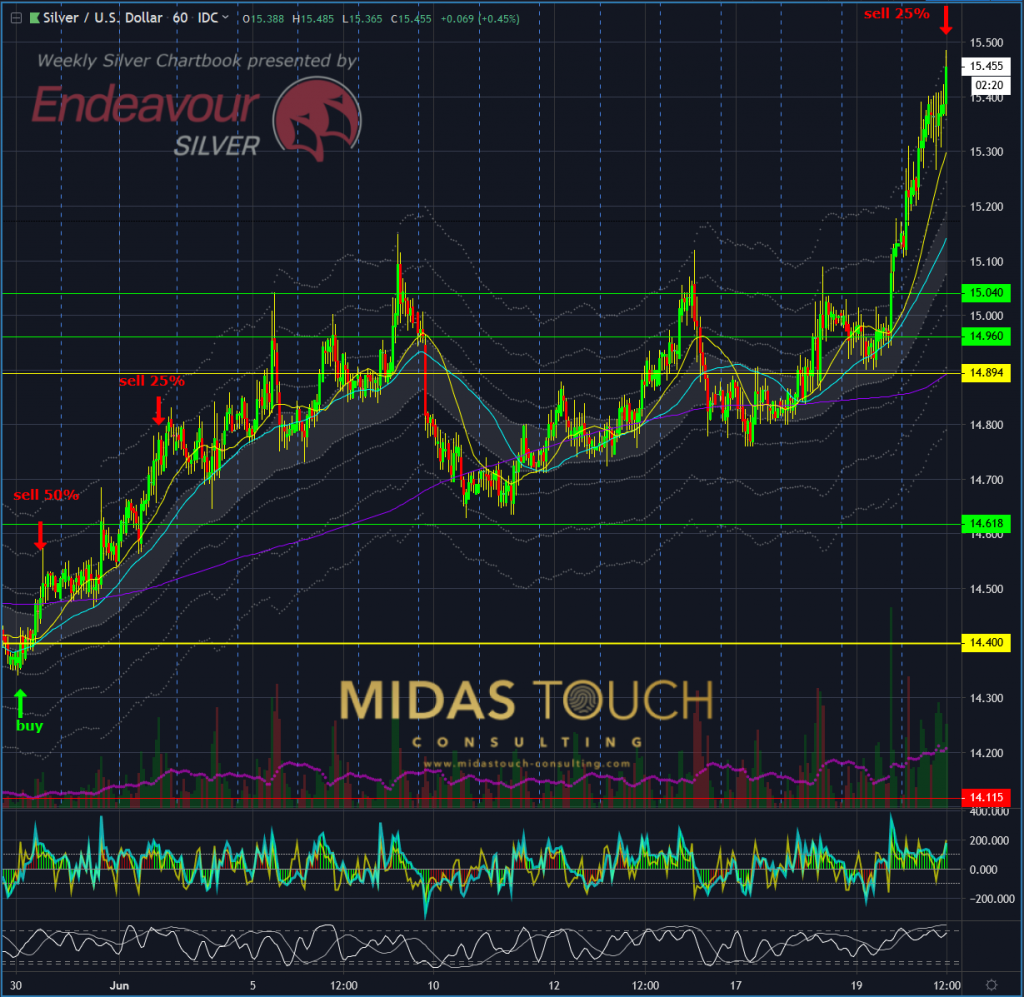
Silver in US-Dollar, 60 minute chart as of June 21st, 2019
It isn’t necessary to speculate long term. Even if you missed our early monthly time frame silver entry play – our entry from a weekly perspective from May 30th, just had its final target reached on the 20th of June 2019 (if you traded this isolated from the monthly play). All entries and exits in real time posted in our telegram channel. And that is just it. The market provides opportunities plentiful. One needs to develop an approach to isolate and grab these low risk offers from the market.
Follow us in our telegram channel.
If you like to get regular updates on our gold model, precious metals and cryptocurrencies you can subscribe to our free newsletter.

