


You might be tired by now reading about the 10k level in the bitcoin market. Everybody has an opinion. Where from here; back to 7k or even 3k; or right away to 13k. No worries, we admit that we do not have a crystal ball. We do not want to add to this confusion. Quite the contrary, we’d rather add to your arsenal another principle, on how to react to such hype in the media. Why are we affected by the presentation of such numbers, why can it cause anguish. Why is “Ten Thousand” meaningful?
For one we might suffer from “the fear of missing out”, a natural instinct, which can lead to chasing trades and choosing foolish entries. It takes disciple to refrain from such actions. Another reason is a possible subconscious trigger of deeply ingrained denomination numbers. We grow up, around the world for the most part, with currency bills in denominations of 1, 5, 10, 20, 50, 100 (and others). These numbers have a deeper meaning to us than other numbers. One example would be the success of the 99 cent store. Customers perceived shopping at such a store to be affordable since items cost less than a dollar. The psychological value difference between coins and printed currency. Truth of course is only one cent difference between a dollar and 99 cent.
When studying charts one finds abnormality in trading around such “meaningful” numbers. They can act like a magnet for prices to move towards. Volatility might increase. Breakouts can occur, and so forth…
To demystify of what will happen more likely than not, let us look at recent charts with an objective mind and the above mentioned as an underlying thread.
Monthly chart of BTC/USDT, 22nd of June 2019, approaching resistance:
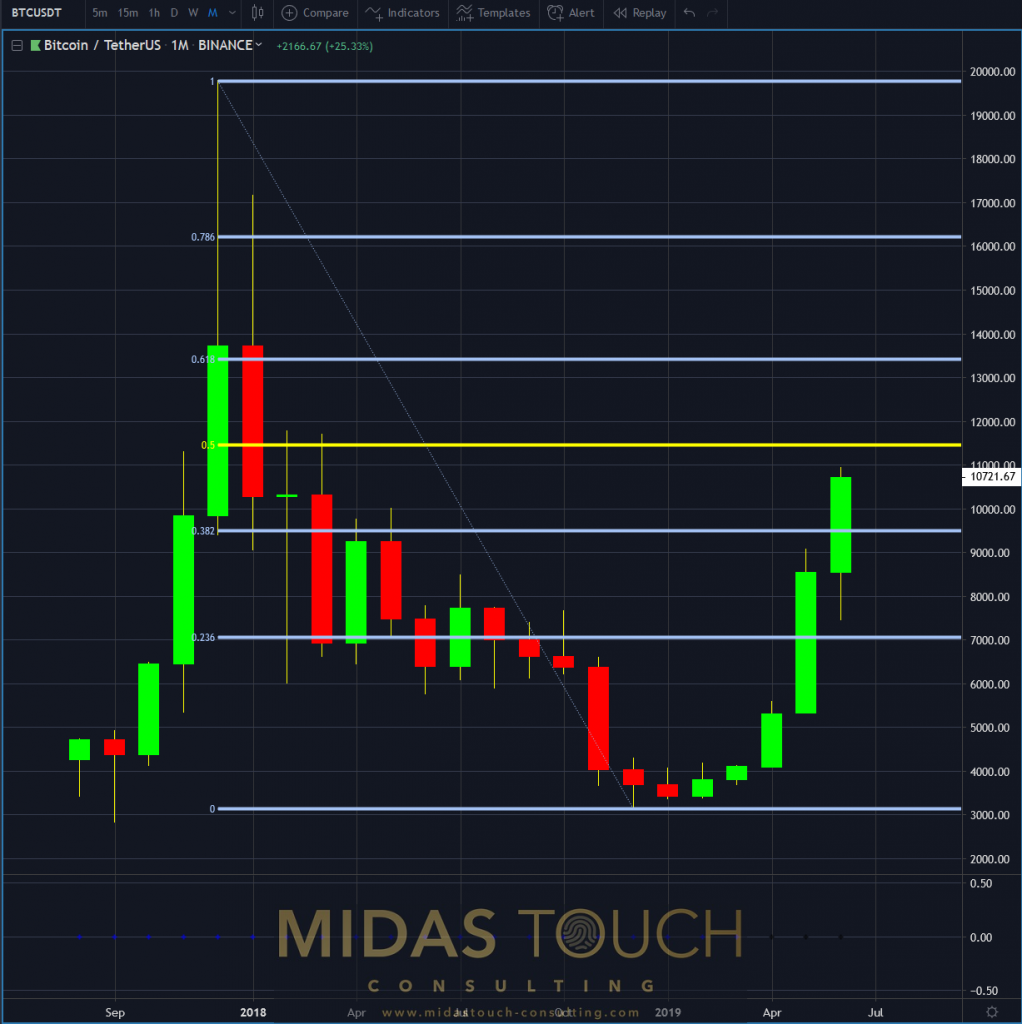
Bitcoin in Tether US, monthly chart as of June 22nd 2019
The monthly chart shows the 50% retracement level being approached. In our humble opinion a much stronger resistance point than the more arbitrary Ten Thousand level.
Weekly chart of BTC/USDT – 06/22/2019, three legs up:
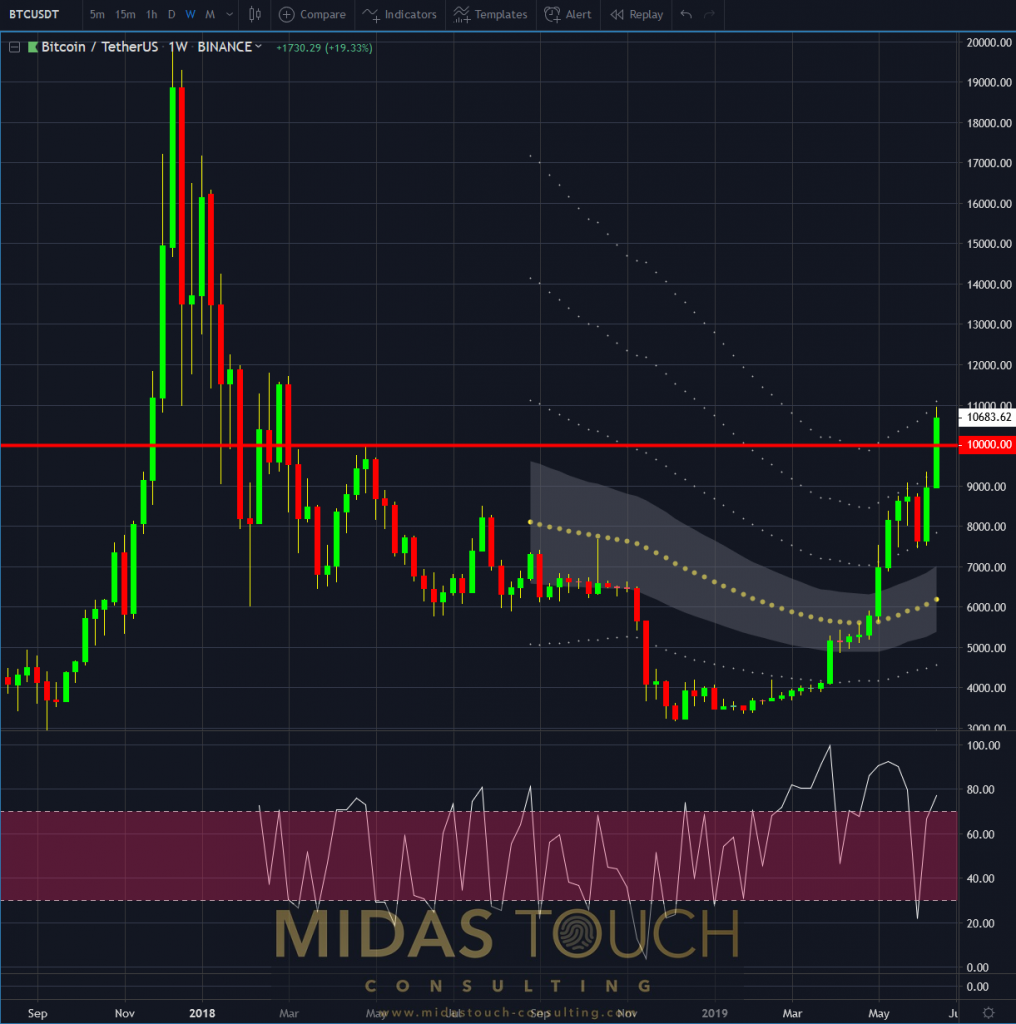
Bitcoin in Tether US, weekly chart as of June 22nd 2019
Typically after four legs direction runs, from a probability perspective, out of steam. The weekly chart illustrates a retracement having occurred at the 9k level and a a straight move through Ten Thousand.
One can certainly add the subconsciously deep ingrained numbers edge to ones trading arsenal, if aware of it. The following shows our trades taken in real time in our telegram channel around the “magic” number.
15 minute chart of BTC/USDT – June 21st 2019, approaching the big number:
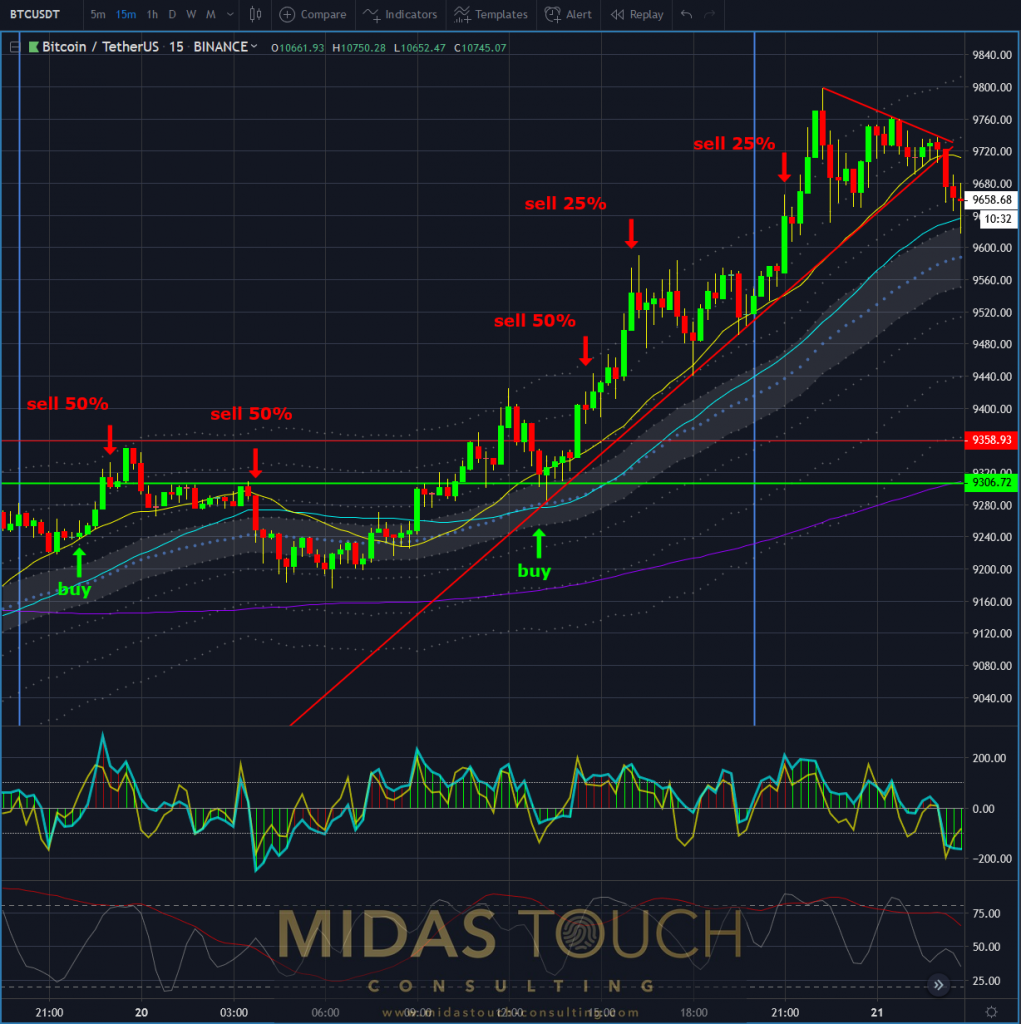
Bitcoin in Tether US, 15 minute chart as of June 21st 2019
Aware of the magnet effect of big numbers we aggressively participated in the market. We exited conservatively not aiming to hold into the expected volatility zone. This method keeps risk small but takes advantage of the higher likelihood of direction towards Ten Thousand.
5 minute chart of BTC/USDT – 06/21/2019, early in on low risk:
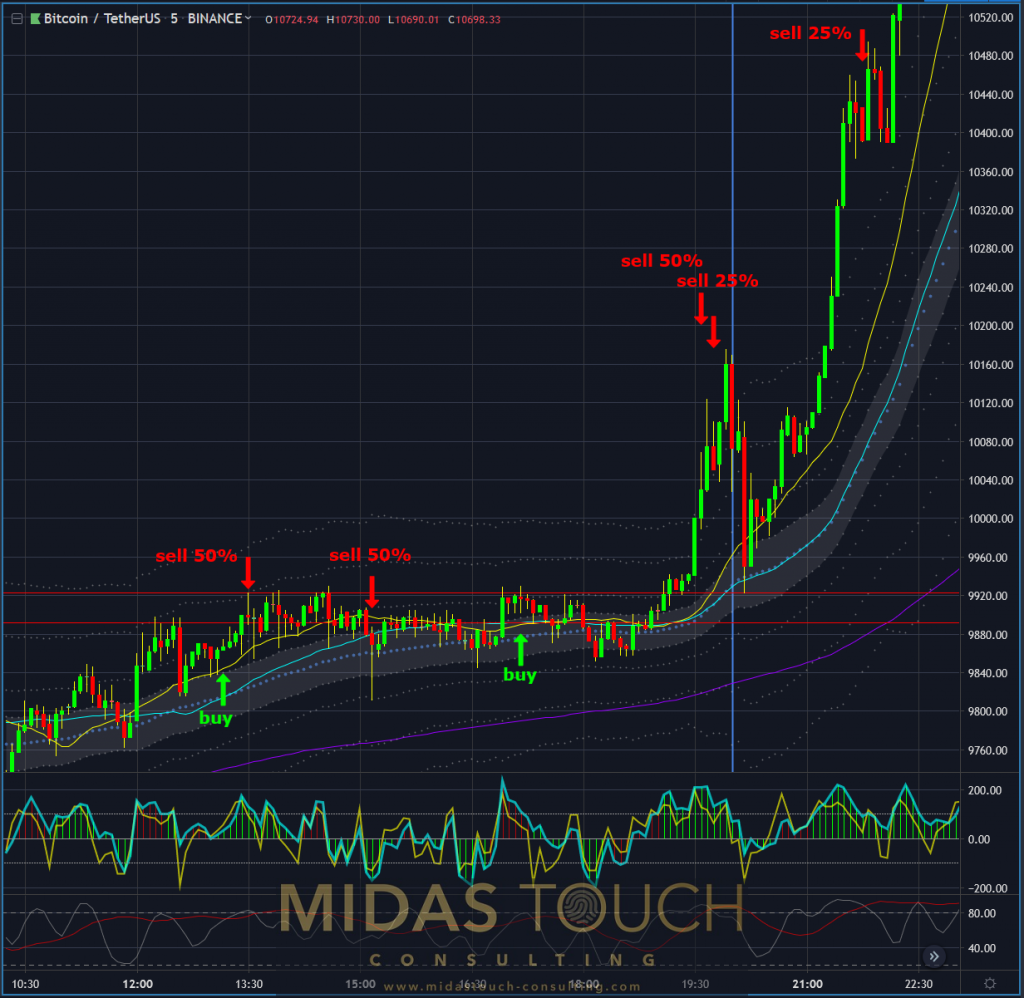
Bitcoin in Tether US, 5 minute chart as of June 21st 2019
At the big number itself we took extremely low risk entries on reduced size of capital exposed to the market, anticipating a breakout/breakthrough. Not trading it as a breakout confirmed and taking on volatility risk, but rather very early in, with tight stops. Than we leave ample room for prices to move and retrace. Again expecting this volatility, there is no room for tight stops here on the running position.
5 minute chart of BTC/USDT – 06/22/2019, “once through, let it ride”:
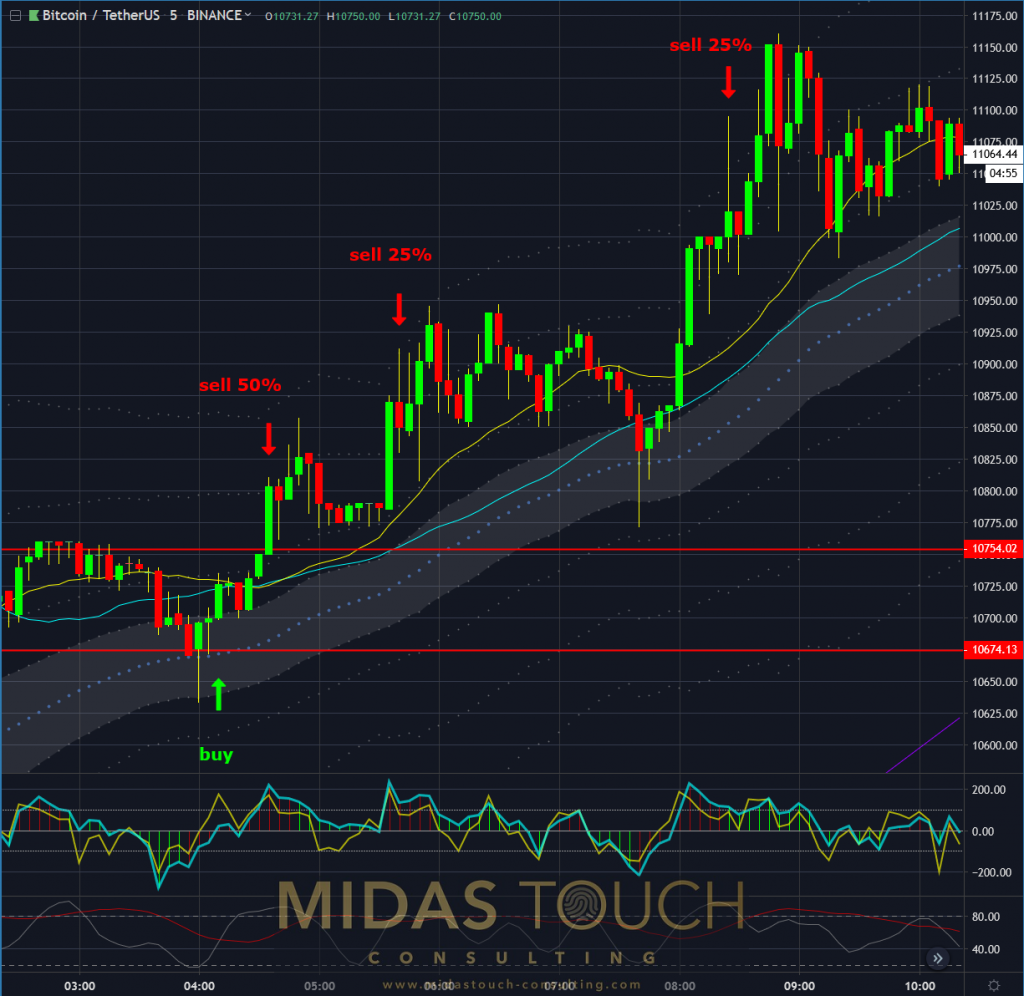
Bitcoin in Tether US, 5 minute chart as of June 22nd 2019
If a penetration of a significant level seems successful, based on “what was resistance – now becomes support”, we again exposed capital. Again direction is the strongest edge and as such we bought the dip. Let it ride.
This is certainly not the only way on how to trade around such numbers. If you are not prepared with a clearly defined approach on how to act around those numbers, that cause the media to write about these levels in the market, you will find emotions triggered within you. Most of these emotions are scarcity and fear based and feed consequently actions of the same nature. If you desire to act conducive to a proper trading strategy, make a plan and trade that plan.
We get triggered by emotions but those can be very costly. The difference between a gambler and a trader is, a trader taking calculated risk and being disciplined, while a gambler getting his emotions satisfied.
All charts timely posted in our telegram channel.
If you like to get regular updates on our gold model, precious metals and cryptocurrencies you can subscribe to our free newsletter.

