


Picking the sweet spot
With the summer doldrums on their way, market play isn’t business as usual. One good route to go is simply refraining from market exposure and sitting on ones hands. Most likely, this is the best possible approach, once volume starts to diminish. When markets lack a sense of direction and, as you’ve certainly noticed, smaller time frames in the bitcoin market starting to be choppy, playing it safe is key. What this mainly means is to reduce size and frequency drastically. That being said there is still ways to get positioned if such positioning is key to prep for a larger move later on. Right now the market seems to present such an opening and we mentioned in our previous chart book reasons why we would like to manifest a small starter position here even so the terrain isn’t ideal. Picking the sweet spot:
Daily chart of BTC/USDT, 28th of July 2019, double bottom in support zone:
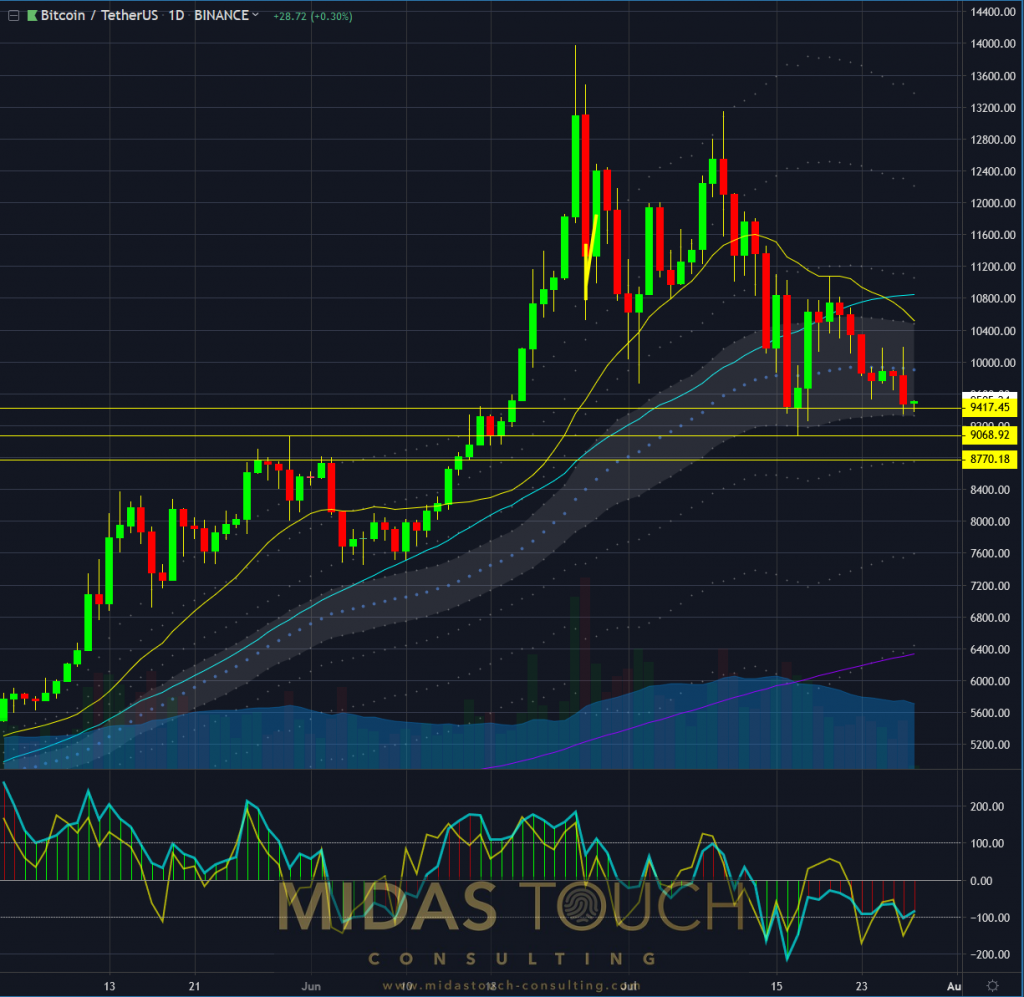
Bitcoin in Tether US, daily chart as of July 28th 2019
We predict over the course of the next days a possible reversal position building in this daily chart. The most ideal picture will show a daily candle penetrating the US$9,068 price zone, leaving a wick and a potential entry could provide a great opportunity.
We would want a longer term position established on very low risk. Since recent market behavior, where large players manipulate price action at unusual times of day and at ill-liquid volume slots in congruence with bot usage, this is only possible with leaving some breathing room from a stop size perspective. Consequently position size should be chosen unusually small.
We need to examine if larger time frames allow for such an idea to be executed.
BTC/USDT, monthly chart July 28th 2019, sideways to down:
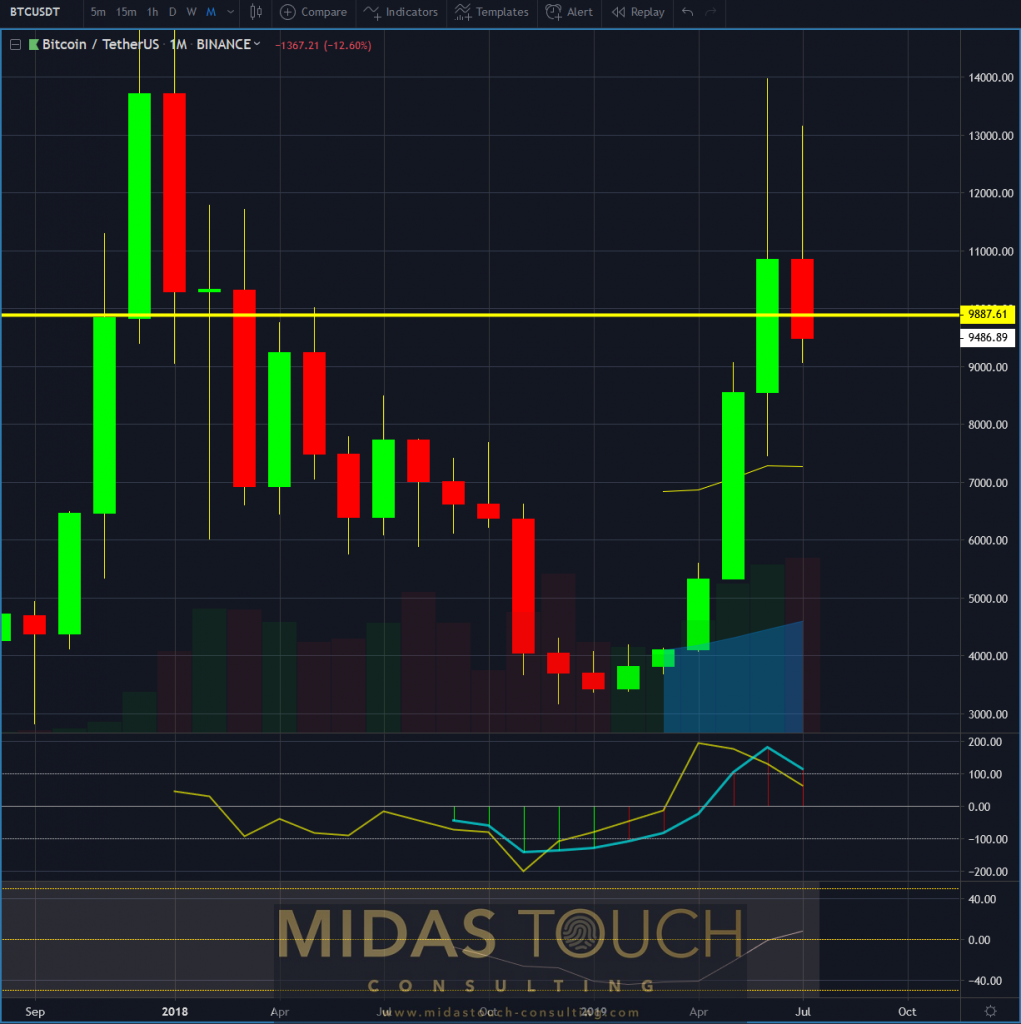
Bitcoin in Tether US, monthly chart as of July 28th 2019
The monthly chart hints that there might be directional change in play but it is mostly suggestive for sideways action – the typical scenario for this part of the years cyclical bitcoin behavior.
The monthly information has to be taken with a grain of salt since the candle to the very right of the chart isn’t completely formed just yet.
Weekly chart of BTC/USDT July 28th 2019, prices in a buying zone:
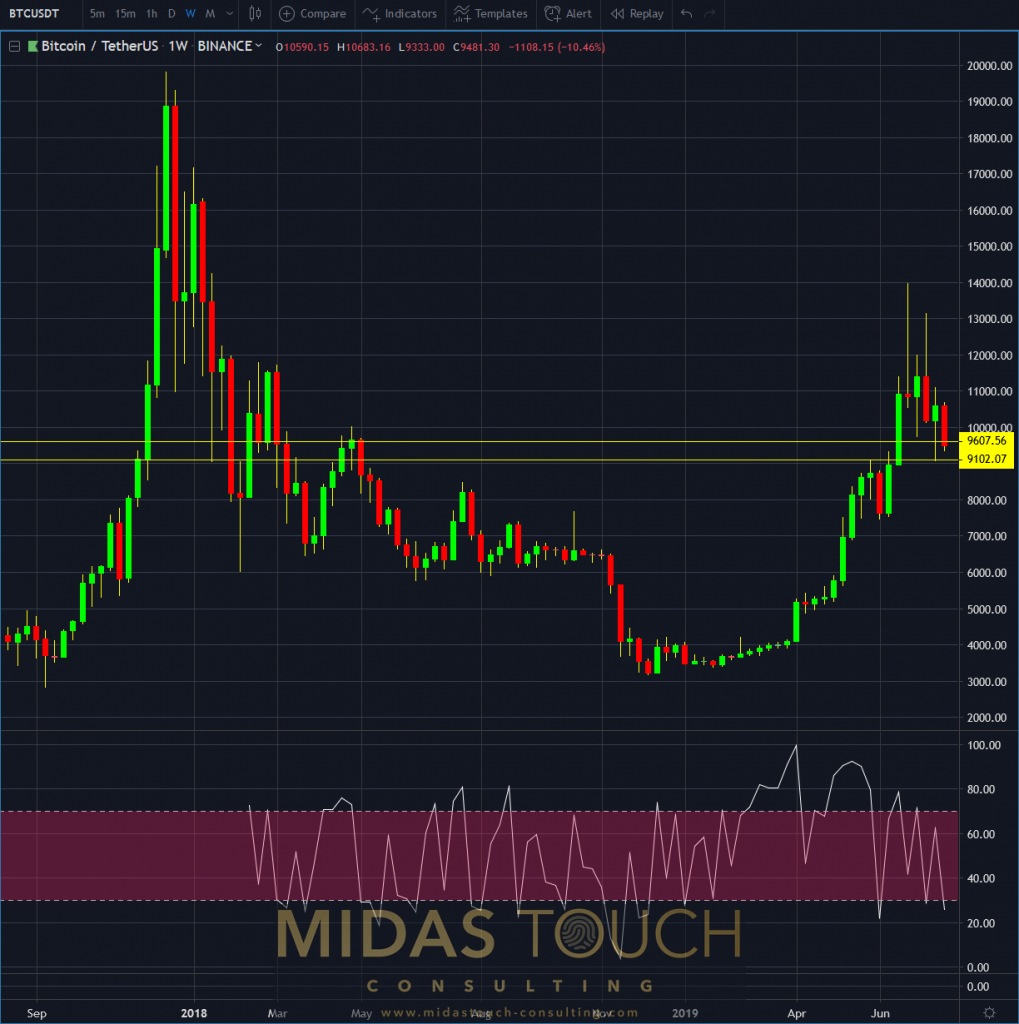
Bitcoin in Tether US, weekly chart as of July 28th 2019
The weekly chart is supportive of our idea. Prices are in a supply/demand zone that can support a nibble on the market here and that is all we ask for. We are not looking for a bold move. As we said, staying at the sidelines in the beginning is the ideal choice. For those who like to get a foot into the door, recent price behavior does provide an entry opportunity (probably earliest by this Monday the 29th of July 2019). Which leads us to the next question: Timing?
Picking the sweet spot: Daily chart of BTC/USDT, 28th of July 2019, fractal time confluence:
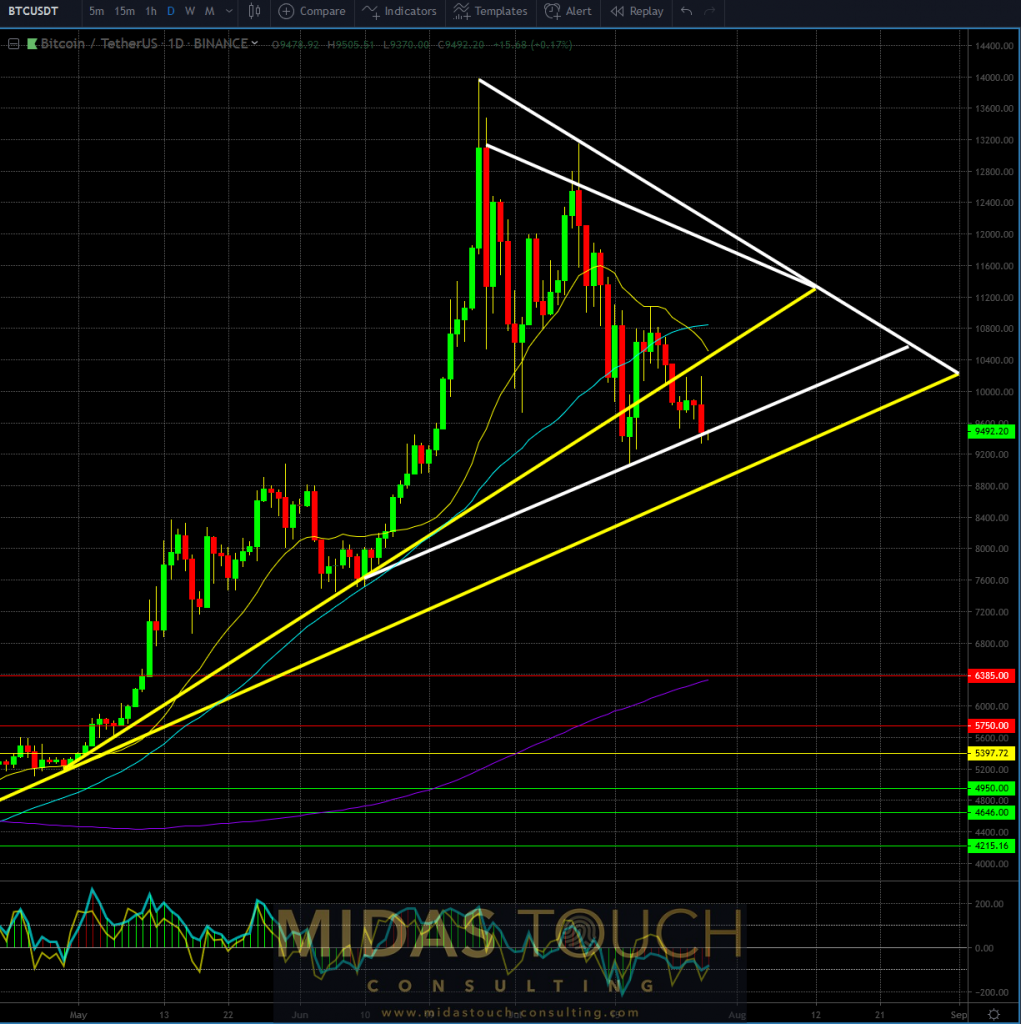
Bitcoin in Tether US, daily chart as of July 28th 2019
Timing shows a confluence spot right here or in 8-9 days from now. The secondary scenario would also allow for a dip to even lower prices for our entry idea. This would allow for a more aggressive position size as well.
Our guess is as good as any of what the future might bring. We do not know where prices will trade from here, but we constantly evaluate the markets behavior for possible openings that might present opportunity. We are looking for the sweet spots. Places, where opportunity cost is in good relation to risk and reward. Then we simply act upon the strategic plan we defined prior.
All charts timely posted in our telegram channel.
If you like to get regular updates on our gold model, precious metals and cryptocurrencies you can subscribe to our free newsletter.

