


From where and where to
Traces in the snow often help to predict the future course. Reading the bitcoin market tracks hopefully guides us to how the future might unfold. One big aspect that technical analysis sheds light on is repetitive human behavior. At this time we encourage to review this post of our weekly chart book since it shows a predominant edge of how the rest of the year might unfold for the crypto market. Seasonality examined in that post shows the meaningfulness of the last quarter in the bitcoin market. By looking at the recent past and prepping for the not so far future we might pave a course of substantial profits for the end of the year. We therefore ask: From where and where to:
Monthly chart of BTC/USDT, 20th of July 2019, large time frame volatility:
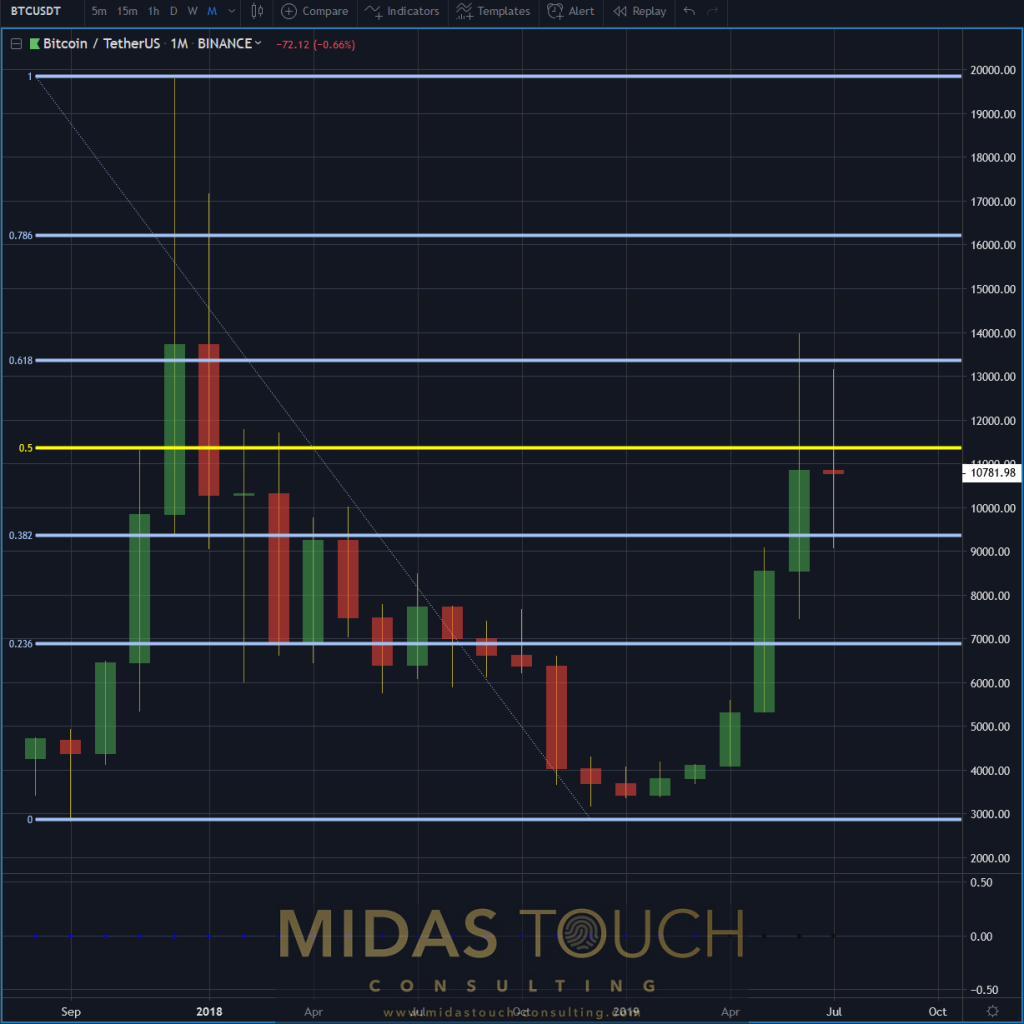
Bitcoin in Tether US, monthly chart as of July 20th 2019
Two things we consider meaningful in this monthly chart:
- Bitcoin is a volatile market due to steepness of moves and size of retracements.
- In 2017 the most prominent move from US$4,110 to US$19,798 happened in the last quarter of the year (and many previous years just like that as well).
From where and where to… BTC/USDT, weekly chart July 20th 2019, strength in 2019:
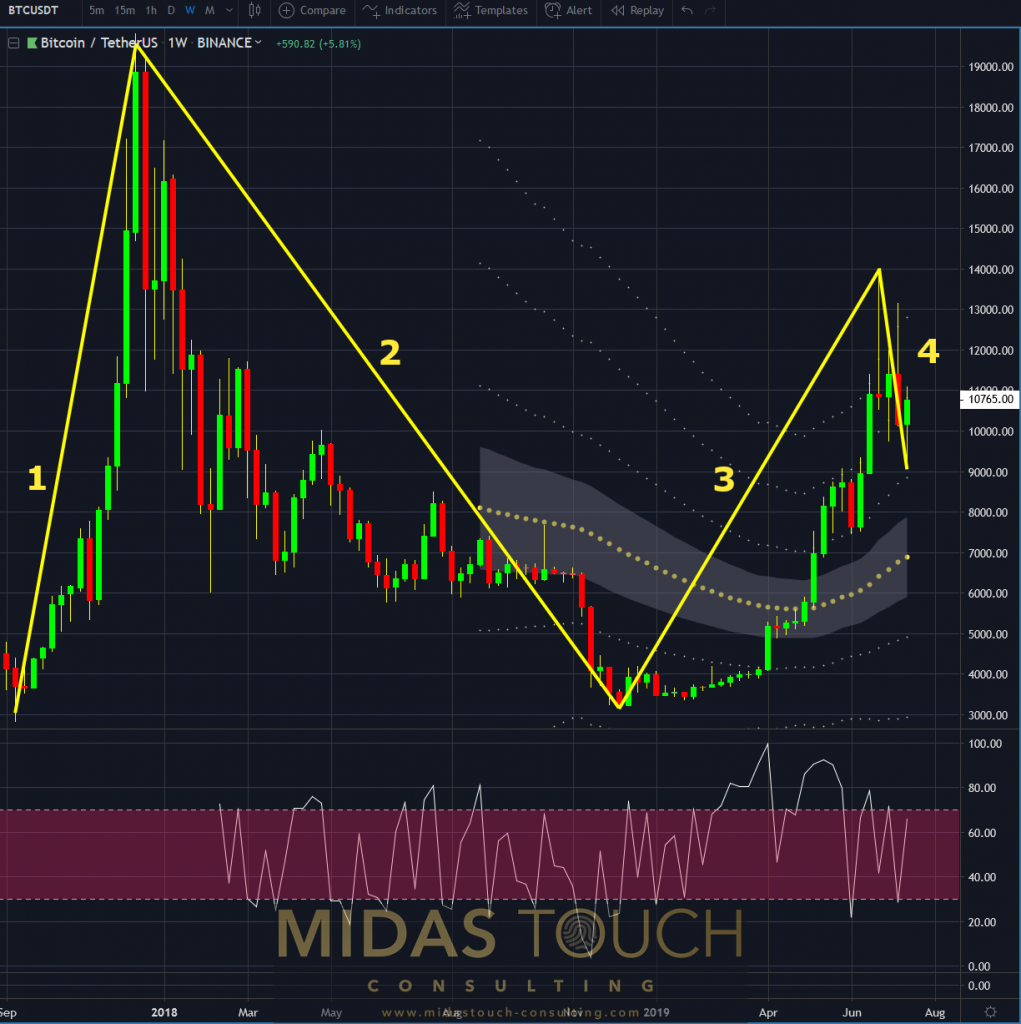
Bitcoin in Tether US, weekly chart as of July 20th 2019
The weekly chart shows that after a strong move in 2017 almost to 20k (1), we had an almost 100% retracement in price decline (2).
2019 showed tremendous strength from its US$3,156 lows to US$13,970 highs, an equivalent of a 342% advance (3) and a relatively modest price decline in the last 3 weeks (4)
From where and where to… Weekly chart of BTC/USDT July 20th 2019, “from where and where to”:
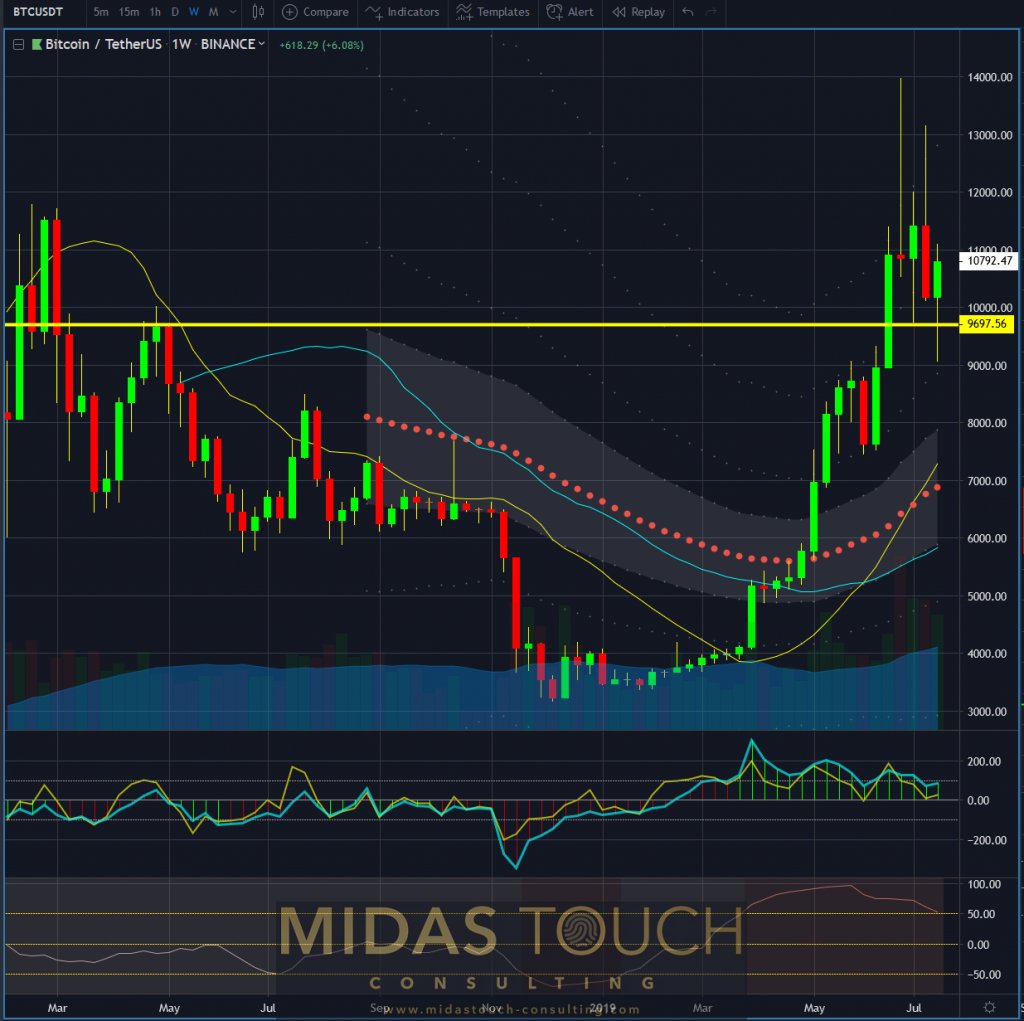
Bitcoin in Tether US, weekly chart as of July 20th 2019 b
Looking from another angle but the same weekly time frame we find bullish notes in the recent price behavior. Examining closely you will find long wicks on each weekly candle in both directions. A sign of battle and uncertainty. Most of all, quite some resistance of the bulls against a normally easier stance of bears cashing in after such a strong advance.
The psychological 10k level as support and the technical strong supply demand zone of US$9,607 supports this bullish notion. With the goal of ideally being positioned before everybody else joins the party and to avoid risk zones like breakouts and similar, we started some action.
We posted twelve altcoin long entries as portfolio reloads live on the 17th of this month in our Telegram channel. We were in the good fortune to already have taken profits and raised stop levels to break even entry levels. In conjunction we also went long BTC/USDT on the 16th,17th,18th and 19th of July with a positive outcome as well.
The good news is these are not the only entries to catch this next large leg.
Quite the contrary, we actually expect the rest of these positions to be taken out by the market. Summer doldrums in the making and chop already evident in the smaller time frames we anticipate battles of the larger players and quite likely further retracements.
Where we aim to put focus is that we see a more likely than not scenario of a continuation of the previously shown strength of bitcoin for the first part of this year. This in mind we are aggressively buying these upcoming dips in the market to rebuild a 100% cash exposure to the market and a loaded portfolio besides bitcoin. That in anticipation of a possible strong last quarter.
We do this by minimizing risk to a minimum (Quad Exit Strategy) and by applying a conservative individual trade position size. Watching monthly and weekly chart candle closes is imperative for the next 2 months.
All charts timely posted in our telegram channel.
If you like to get regular updates on our gold model, precious metals and cryptocurrencies you can subscribe to our free newsletter.

