


Gold – Healthy pullback or directly towards 1,500?
1.Review
Since the last panic low on August 16th, 2018, atUS$1,160 the price of gold has soared by nearly US$300 in the last 11 months. Initially, this massive wave started rather slow and camouflaged as a shallow rebound. But with the sharp correction in the world wide stock markets which brought the end to rate hiking cycle in the US, the gold price started to pick up from mid-November 2019, rising to US$1,346 US by the end of February. The ensuing spring correction was relatively mild and ended in mid-May above the 200-day line at US$1,265.
Finally, in late May, the gold price extemporaneously ignited its turbo and shot up steeply to US$1,438 within three and a half weeks. This sparkling rise also included the effortless breakout over the long-standing resistance zone of US$1,350 to US$1,375. The sharp breakout wave was then consolidated at high levels within a bullish triangle formation for almost three weeks.
One week ago, gold prices then posted the promising break-out from this consolidation triangle and extended the rally further to US $1,452. Here, however, the gold train suddenly stopped, and the gold prices are currently trading more than US$30 lower again. The bullish breakout from the triangle has thus failed for now as gold has corrected back below the breakout point.
2. Technical Analysis: Gold in US-Dollars

Gold in US-Dollar, weekly chart as of July 26th, 2019. Source: Tradingview
Since the crash in spring 2013, the price of gold has been trading below US$1,430 over the last six years! Only after the big turning point at US$1,045 in December 2015, there were numerous attacks on the lower resistance zone between US$1.350 and US$1,375. Ultimately, the bulls did not succeed until June 19, when the long-awaited breakout finally happened. Within a few days, the price of gold rose steeply thereafter and has been trading for several weeks at its highest level since May 2013.
With this technical progress,the weekly chart is without a question bullish. The successful breakout above US$1,370 has activated a first price target between US$1,500 and US$1,550. In the medium and long term, significantly higher price targets are also conceivable. The exciting yet only question currently is, whether gold prices will march directly towards around US$1,525, or whether gold does have to take a breather before the next leg up towards US$1,525.
The overbought weekly stochastic oscillator could certainly need a healthy pullback. Likewise, one can argue that the breakout level has to be tested again at US$1,350. But so far, this scenario is not yet visible and remains a speculation. Instead, the gold price is even trying to break out of the uptrend channel that guided gold over the last 12-month-old. If this breakout succeeds, another parabolic acceleration should be expected, which could drive the price very quickly towards US$1,500 – 1,550.
All in all, the weekly chart remains bullish. The likelihood that the rally will resume soon is definitely higher than a pullback below US$1,400.
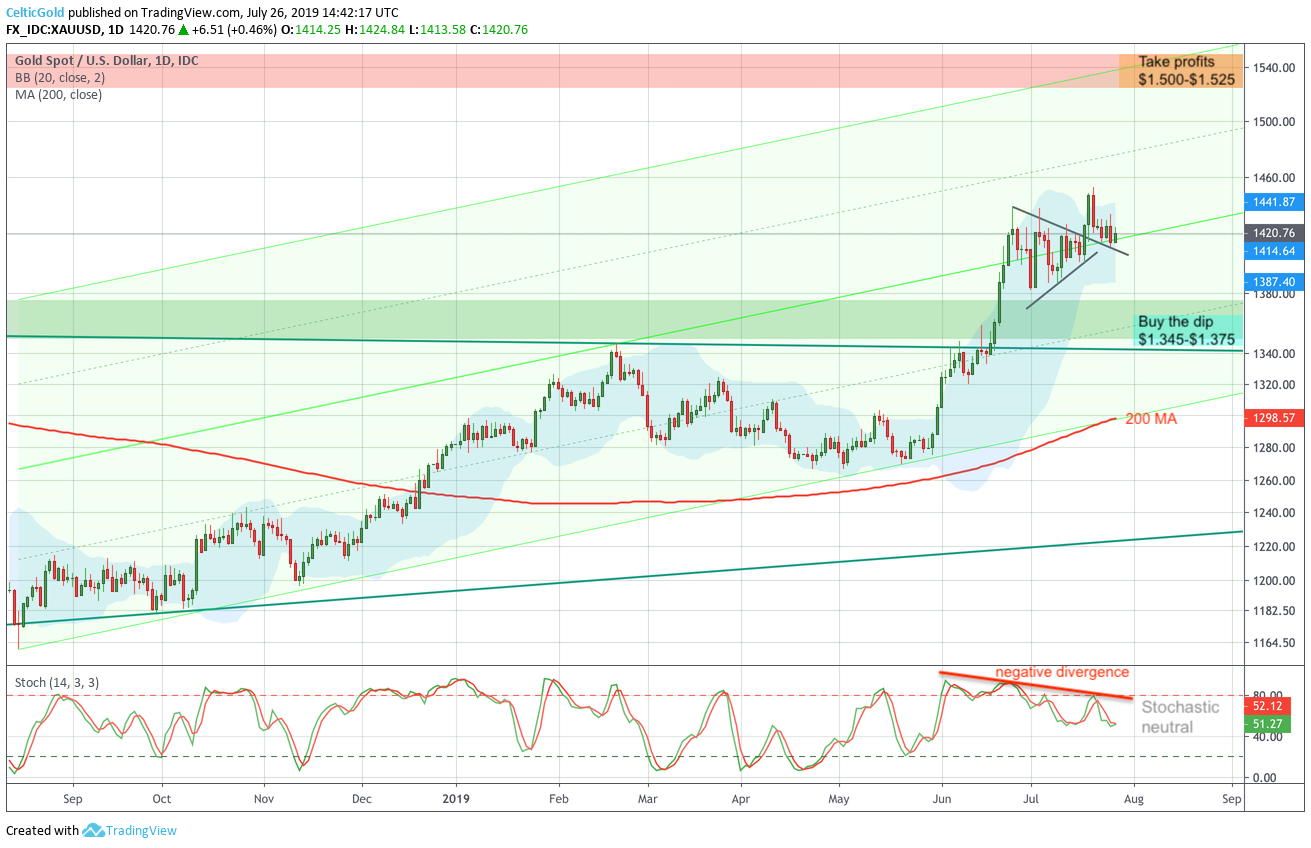
Gold in US-Dollar, daily chart as of July 26th, 2019. Source: Tradingview
The daily chart shows the upward movement since August 2018. Until mid of May, the price of gold rather inconspicuously moved within a solid uptrend channel. However, with the quite abrupt rally since the end of May, this has changed. Effortlessly, the upper boundary of the trend channel was skipped over.Meanwhile however, the fight between bulls and bears happens exactly at this top edge and will soon last for six trading weeks already! Despite the interim progress towards US$1,452 this battle has not been decided yet.
If the bears can prevail, it should lead to a very healthy correction back towards the breakout level around US$1.350. On the other hand, if the bulls can push through US$1,435, rapid gains of another US$100 are to be expected. The negative divergence in the stochastic, the MACD and RSI, argues against the continuation of the rally, because these indicators have not confirmed the last high at US$1,452.At the same time, the heavily overbought situation in the stochastic has been successfully cooled down even though gold continued trading at high levels around US$1,420 in recent weeks.
Overall, as long as the gold prices can hold above US$1,400, the bulls have a clear advantage on the daily chart too.
3. Commitment of Trades: Gold
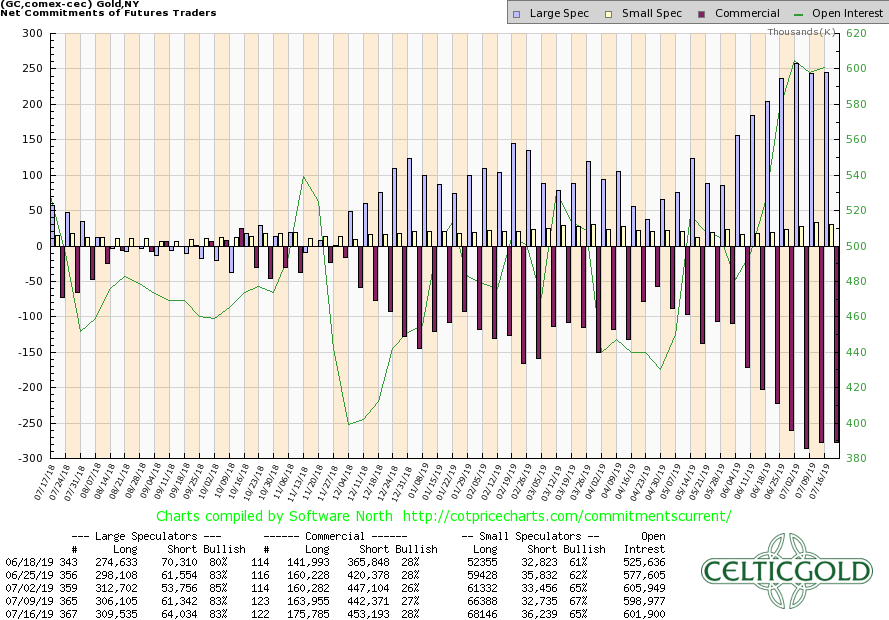
Commitment of Trades for Gold as of July 16th, 2019. Source: CoT Price Charts
From a contrarian perspective and just about a year ago, the gold market was ideally positioned for a strong upward movement whereas the situation today is actually vice versa! The large speculative money, e.g, the hedge funds and big trend followers, have positioned themselves massively „long“, betting on further rising gold prices.
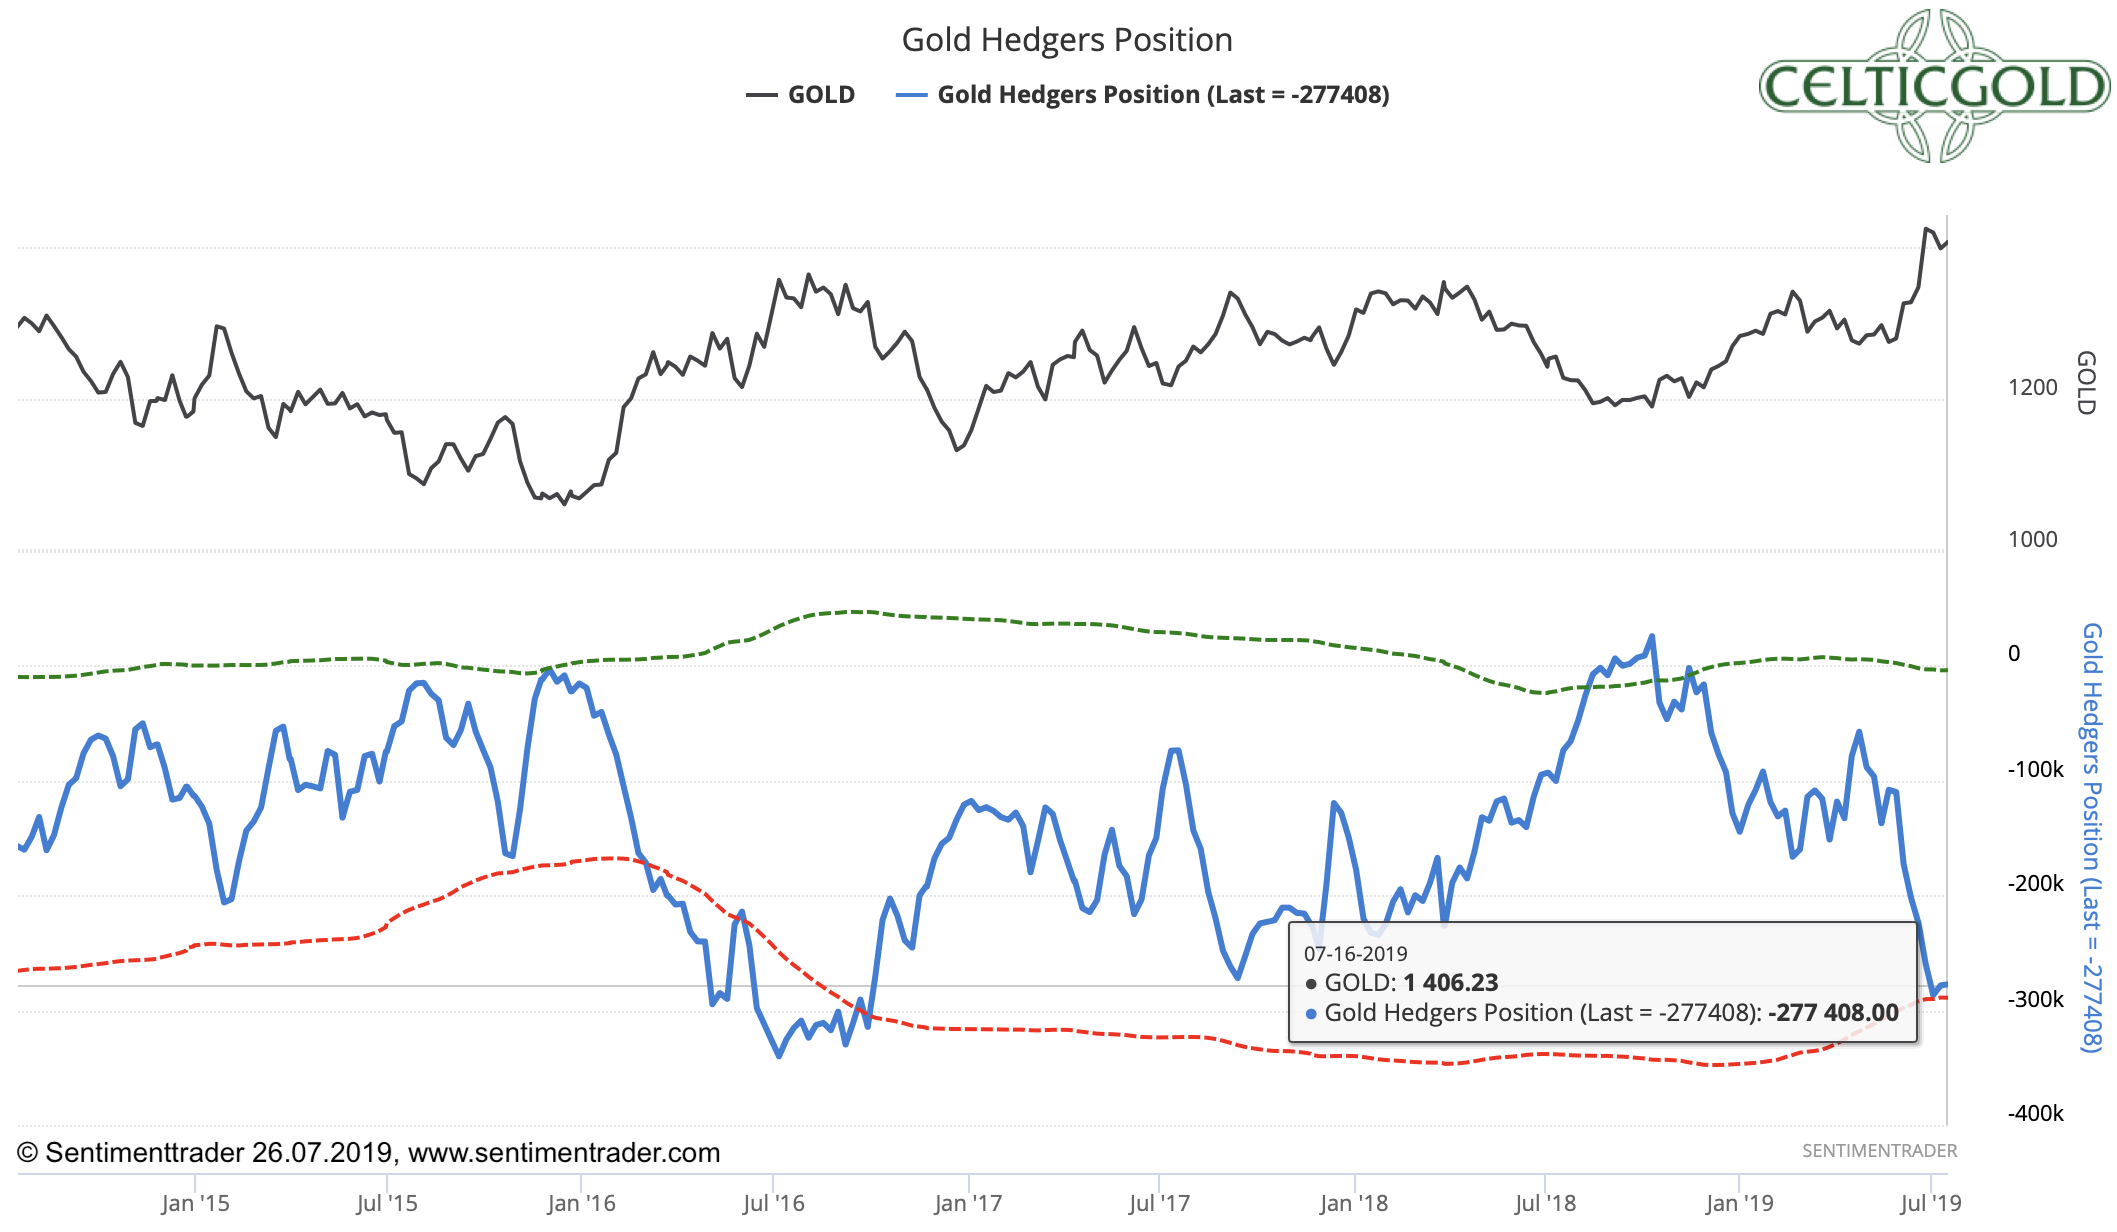
Commitment of Trades for Gold as of July 16th, 2019. Source: Sentimentrader
On the other hand however, the professional and smart money, the Bullion Banks, market makers, commercial hedgers as well as the producers, have increased their net short positions to the highest levels since the summer of 2016. Back then, gold was running against the US$1,350 levels for more than two months, before a sharp and nasty correction down to US$1,123 followed.
The big difference from today to then is, of course, that gold currently trades almost US$100 higher than in the summer of 2016. On top, gold has just completed a major bullish breakout in the big picture. The commercial hedgers, however, had positioned themselves well for the increase from US$1,160 to US$1,452 since last summer and have reaped their harvest. Now the professionals are clearly positioning themselves on falling gold prices.
Since these professional market participants have very deep pockets, they can sit on unrealized losses for a long time or theoretically continue to expand their losing positions. In this respect, a direct continuation of the rally towards US$1,500 is not impossible. But the higher gold moves now, the more violent will the next pullback be. Alternatively, the high commercial short position more or less directly enforces a correction. A return to the breakout level around US$1,345 and US$1,375 might transform the gold futures market from the currently unfavorable constellation back into a constructive starting position for the next leg higher.
To summarize, the Commitment of Trades Report (CoT) is currently sending a dark red warning signal.
4. Sentiment: Gold
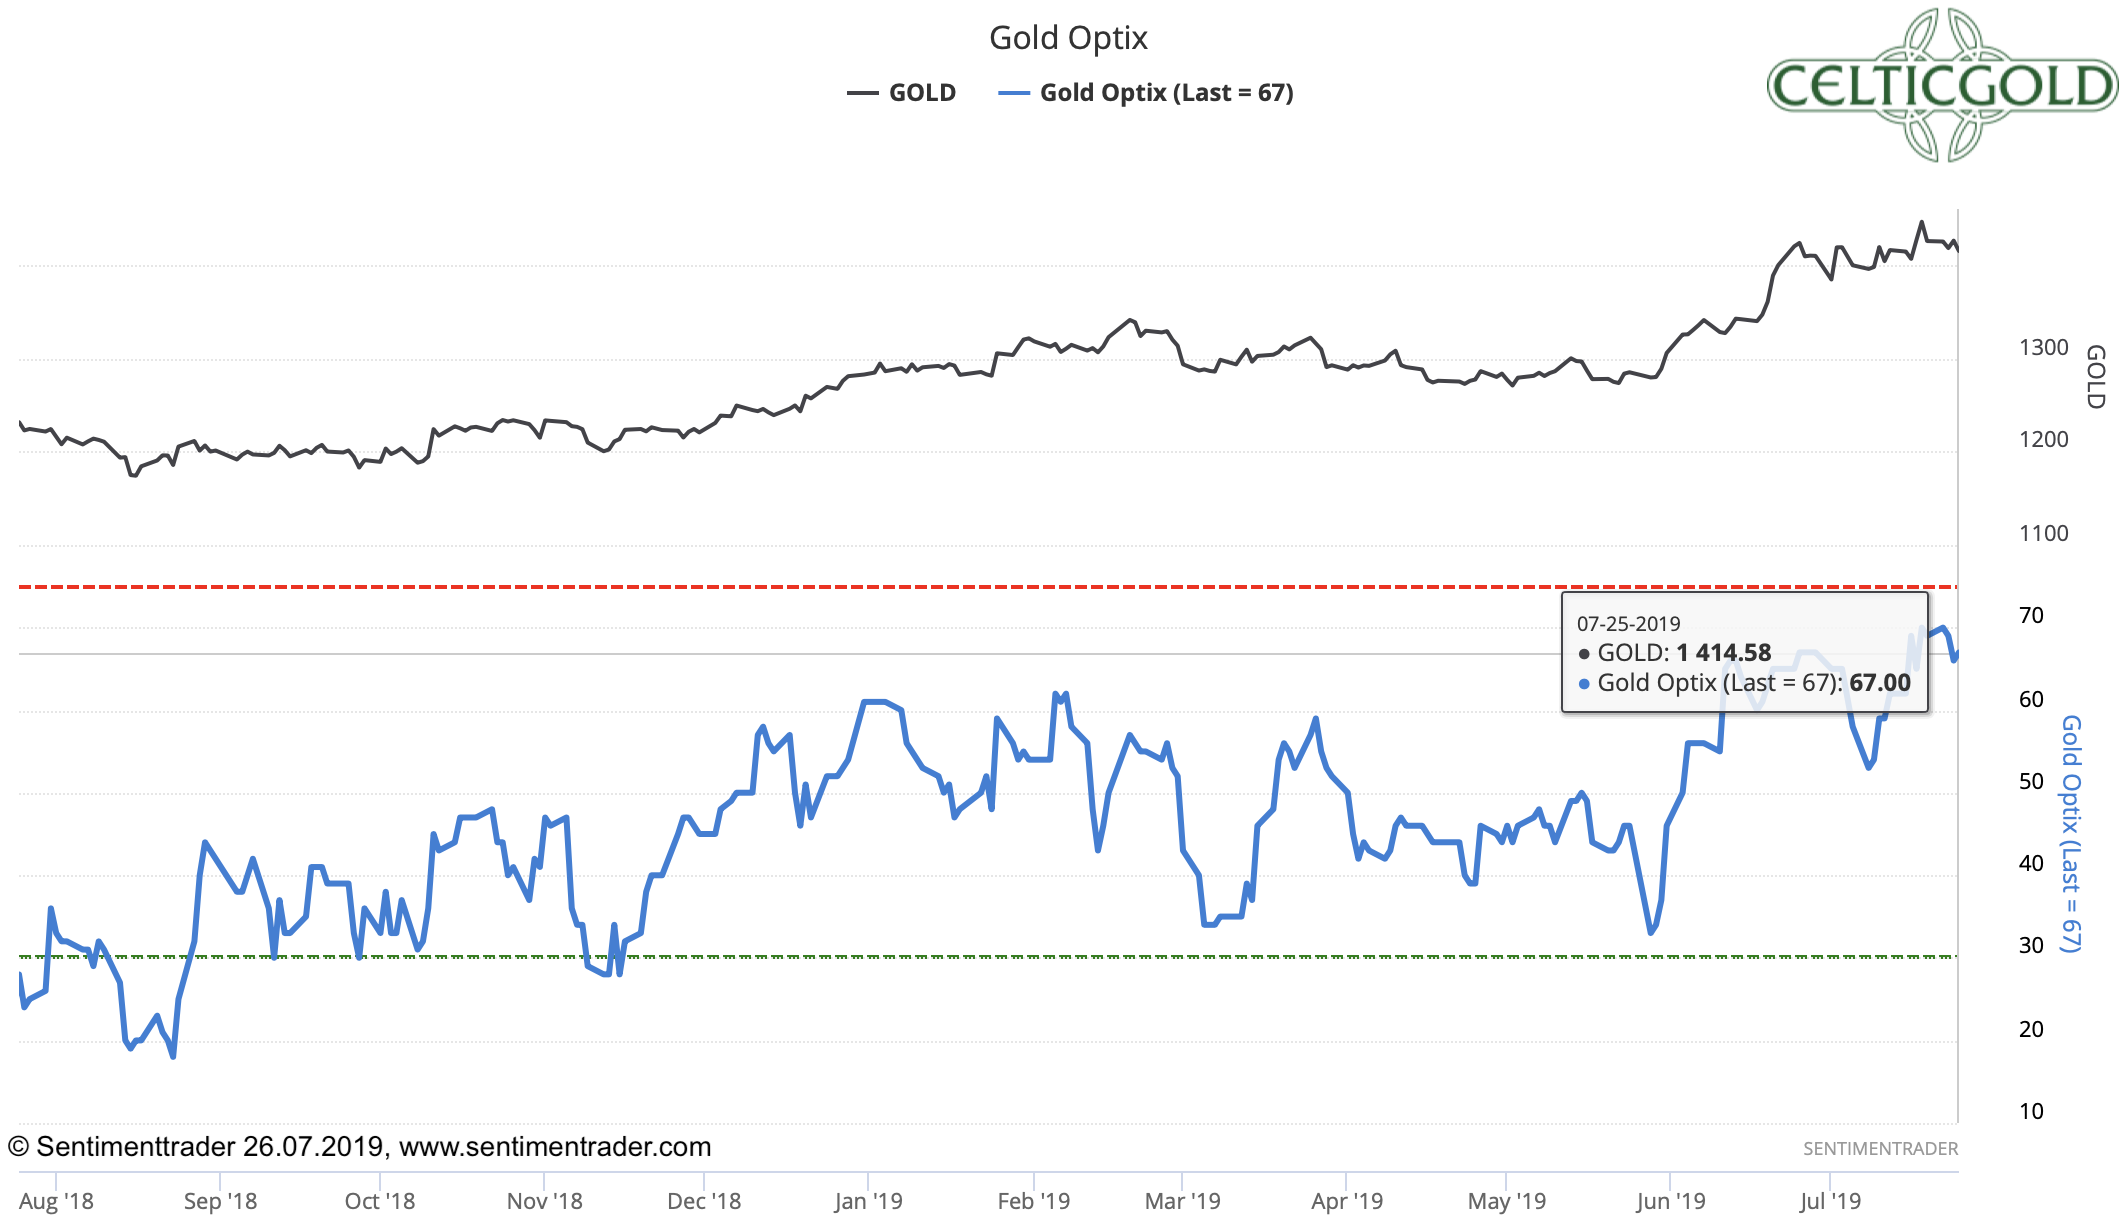
Sentiment Optix for Gold as of July 26th, 2019. Source: Sentimentrader
The mood in the gold market has improved significantly during the last two months due to the sharp rise in prices, of course. Although you can certainly not yet speak of an extreme euphoria and blind optimism, too high expectations, as they often appear at intermediate tops, can already be seen.

Focus Money Nr.29/2019 as of July 10th, 2019.
While quantitative sentiment levels reported by sentimentrader.com have not yet reached the red zone, the rather rare “frontpage indicator” appeared two weeks ago. The German mainstream financial magazine “Focus Money” asked on its front page, whether now “the biggest gold rise of all time would be imminent”.
Such sentiment signals should be taken seriously, because contrarians know that bold announcements in a mainstream financial newspaper usually reflect the mood among the majority of investors very well. Due to the fact, that the majority of participants is always wrong, it seems unlikely that the gold prices are ready for another big jump higher. More likely, the big jump has already been completed and professionals are now looking for amateurs to whom they can sell their significantly increased positions.
Overall, the sentiment is currently indicating that gold must first become cheaper. However, an explicit bearish signal is (yet) not visible.
5. Seasonality: Gold
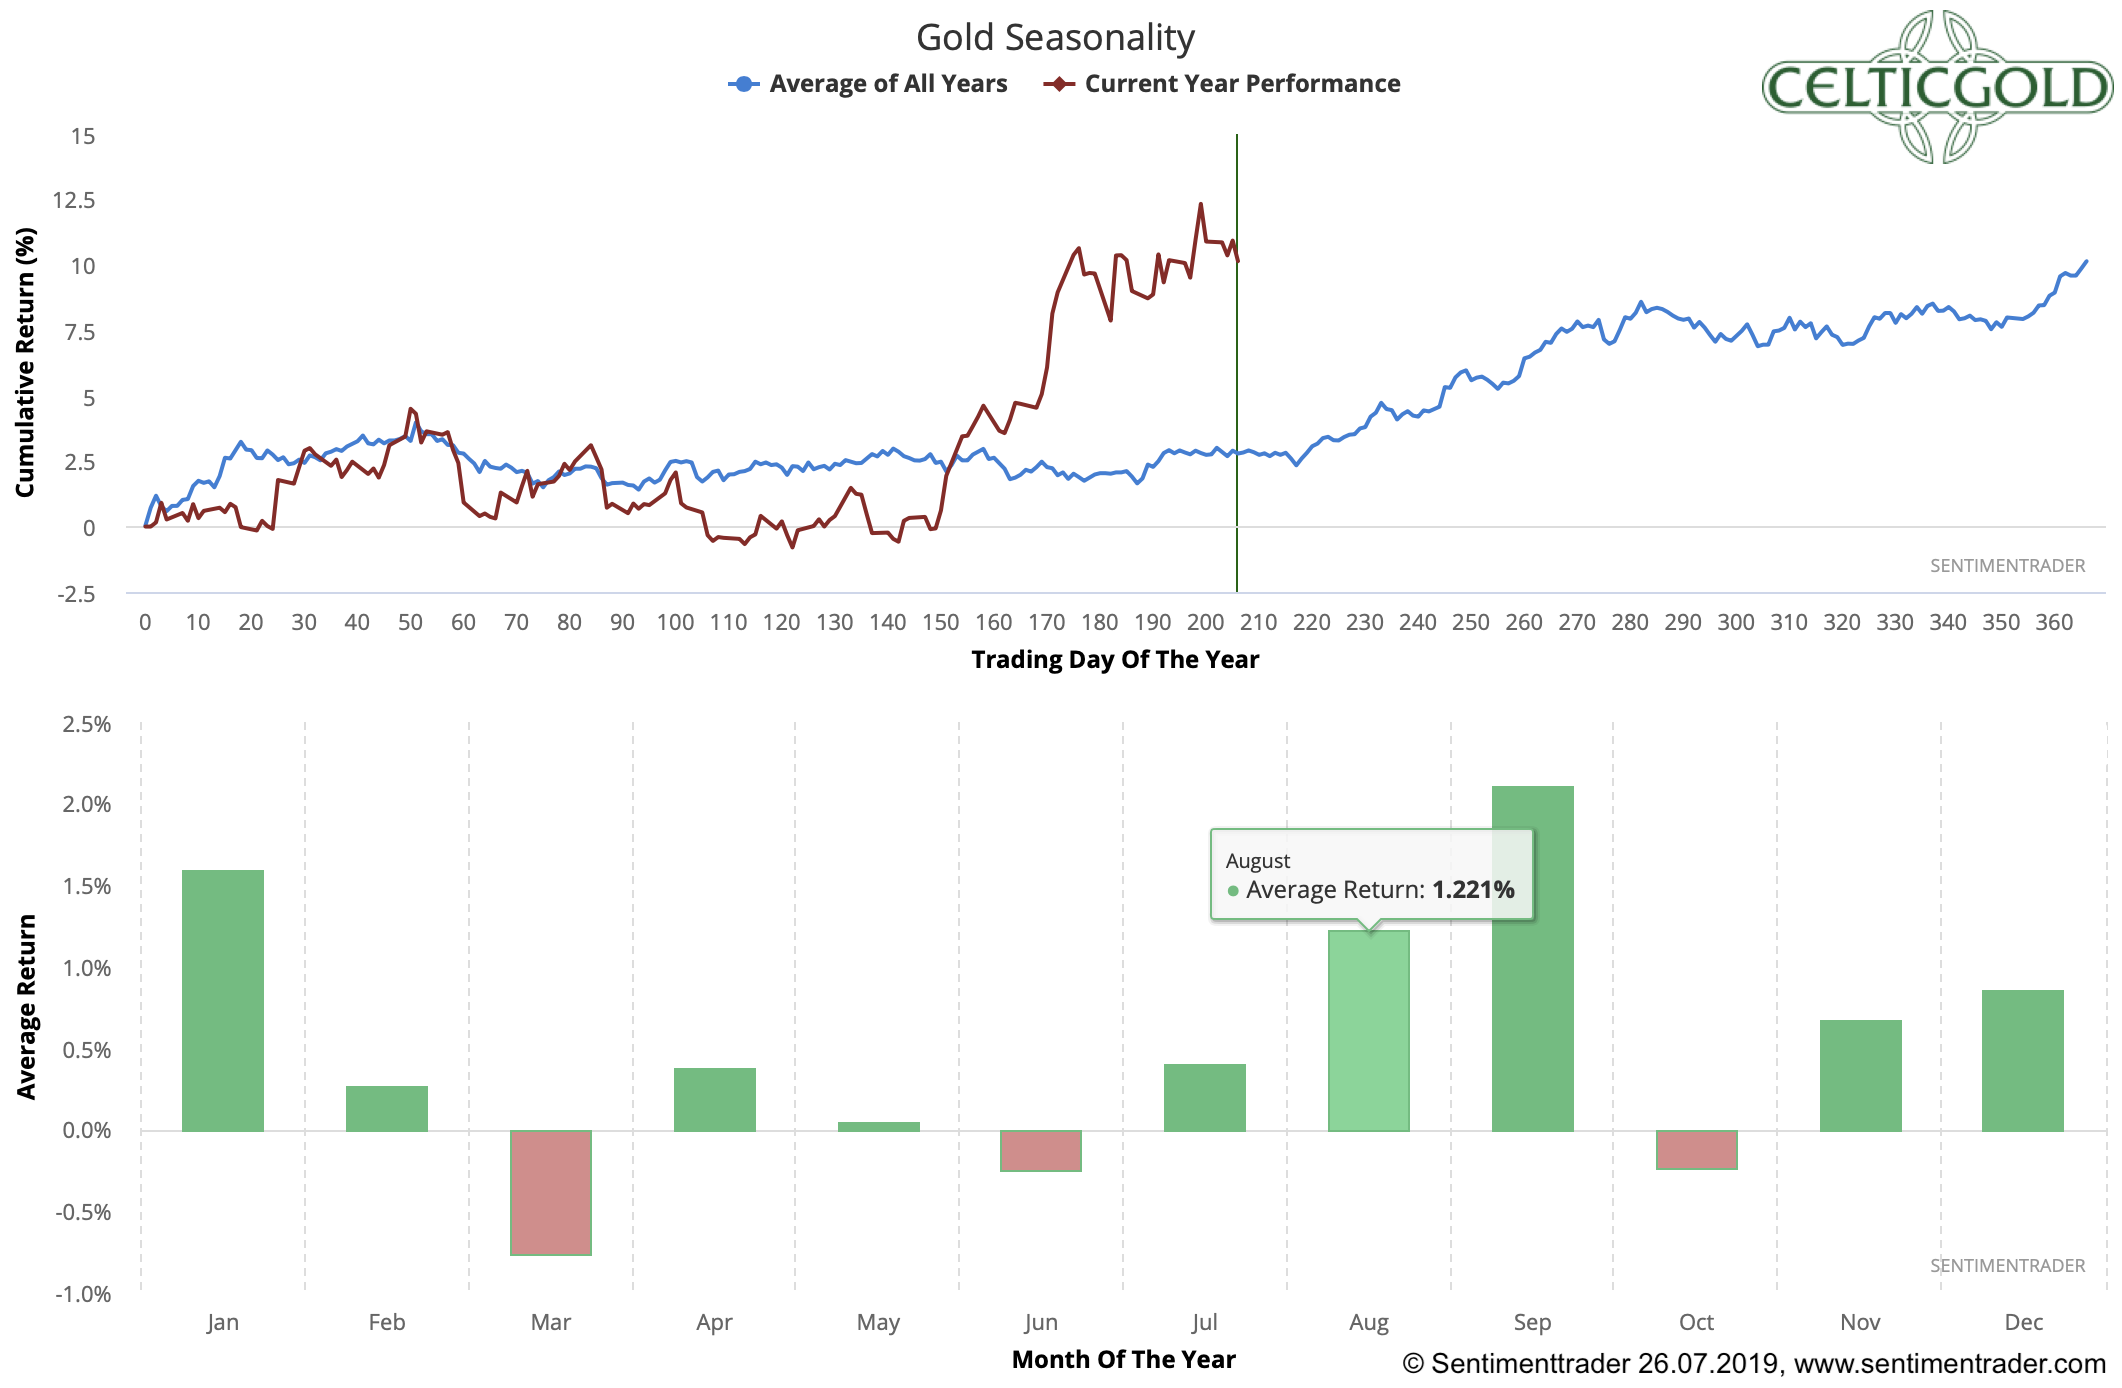
Seasonality for Gold as of July 26th, 2019. Source: Sentimentrader
Based on the past forty years’ performance the gold market has developed a clear seasonal pattern. Accordingly, there is usually a period of weakness between the end of February and the end of June, which then provides an important low and a turning point in early summer.
In 2019, this turning point came already in the middle/end of May and thus was quite early. Since then, prices have already risen significantly. However, the seasonal component will continue to provide green lights until the end of September. However, since the price trend is somewhat early this year, the seasonal support could theoretically dwindle from the end of August.
In the coming weeks, seasonality supports a further rise in the price of gold.
6. Bitcoin in Gold

Bitcoin in Gold as of July 26th, 2019. Source: XE
Since Bitcoin has fallen significantly in the past two weeks, while the price of gold has remained stable above US$1,400, one Bitcoin currently costs 6.9 ounces of gold. In other words, it costs0.145 Bitcoin for one ounce of gold. Compared to my analysis two weeks ago, gold against Bitcoin has already become over 20% more expensive! Although Bitcoin´s recent pullback has partially cooled down the overbought setup, the correction could easily continue towards US$8,500 or even lower. At the same time, however, a pullback in gold towards US$1,350 seems possibletoo.
In that case, the ratio would continue to rise to about 0.16 in favor of gold. Therefore, it still makes sense to exchange a portion of your bitcoins for gold.
This of course, only makes sense to the extent that one balances the allocation in the two asset classes! At least 10% and a maximum of 25% of one’s total assets should be invested in precious metals (mostly physically), while in cryptos and especially in Bitcoin one should hold at least 1% and a maximum of 5%. If you are very familiar with cryptocurrencies and Bitcoin, you can individually allocate higher percentages to Bitcoin. For the average investor, who is also invested in equities and real estate, 5% in the highly speculative and highly volatile Bitcoin is already a lot!
7. Conclusion and recommendation
There has undoubtedly been opened a new chapter in the gold market over the past two months. The successful breakout above a six-year resistance level has certainly led to a change in the perception of market participants. In the future, the buy-the-dip mentality will most likely return to the gold market and ensure that the price for one ounce of gold will continue to rise in the medium to longer term, regardless of short-term volatility.
A rise towards US$1,500 and $1,550 is likely to be only a matter of time. Either this will be achieved almost immediately in the coming weeks and months, or the price of gold will first undergo a correction back towards US$1,350. Here a very good buying opportunity would present itself to gold investors.
In the short term, and therefore ahead of the eagerly awaited US interest rate decision next Wednesday, the price action of gold is likely to be rough, but without a clear direction and therefore mainly sideways. Maybe gold will dip shortly before the important date.
Overall, however, most part of my analysis speak for further increasing prices and a more or less direct continuation of the rally. However, the risk/reward ratio at current levels is not good anymore due to the significantly increased prices. Should gold correct down towards of US$1,350 you should grab it with both hands. Otherwise remain patient and wait for weakness.
Source: www.celticgold.eu
If you like to get regular updates on our gold model, precious metals and cryptocurrencies you can subscribe to our free newsletter.

