


Bitcoin – The larger Picture
The crypto market is still much related in regards to how the price of Bitcoin is performing. This makes a top down analysis (larger picture) of Bitcoin (BTC) imperative. Otherwise you would trade against the overall grain of the market. In this “crypto chart-book” we want to zoom into the price action of the dominating crypto currency Bitcoin against the stable coin Tether (USDT). According to their website, every Tether is always backed 1-to-1, by traditional currency held in their reserves. So 1 USDT is always equivalent to 1 USD.
BTCUSDT is a relative young pair but sheds clarity in its simplicity:
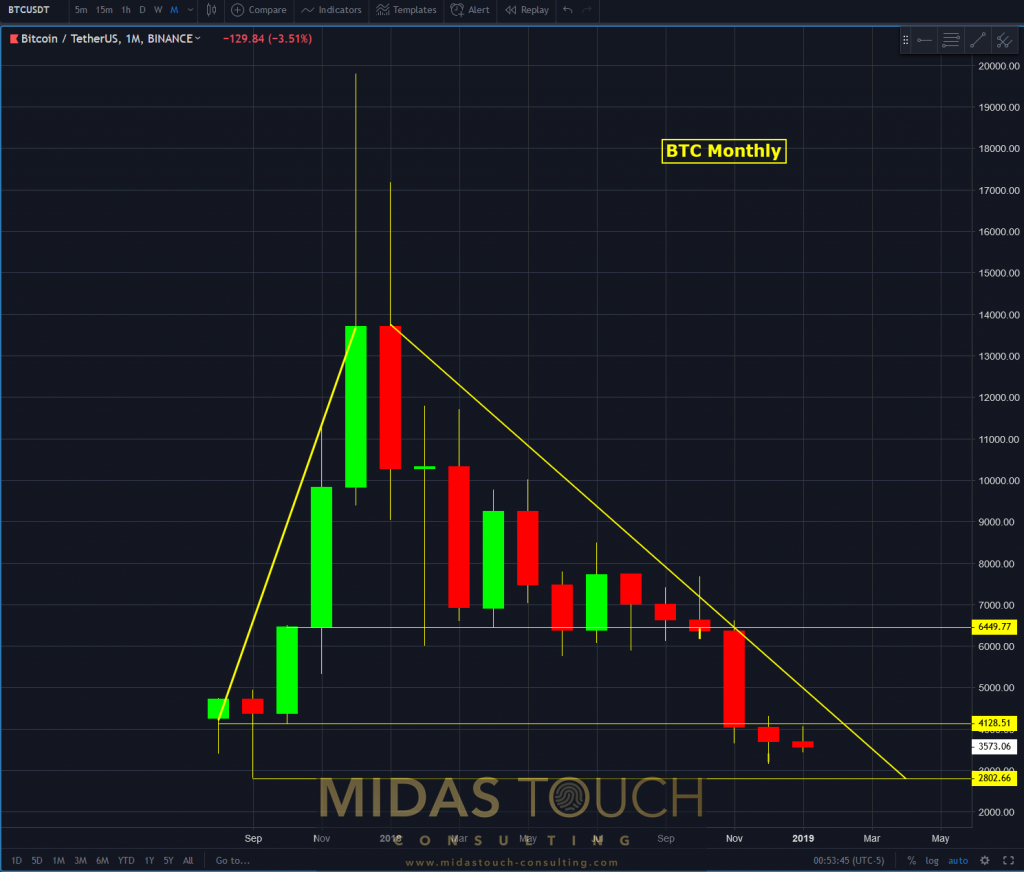
BTCUSDT monthly chart as of January 26th, 2019
A near 100 percent retracement within a few month still shows weakness. The importance here remains therefore that risk is clearly to the downside not to the upside. As such we have closed out our long term short positions by 90 percent in size.
This is the main context under which the recent daily tight range has to be viewed. But although we are expecting a break out any time now, it is not warranted to take this as a short entry:
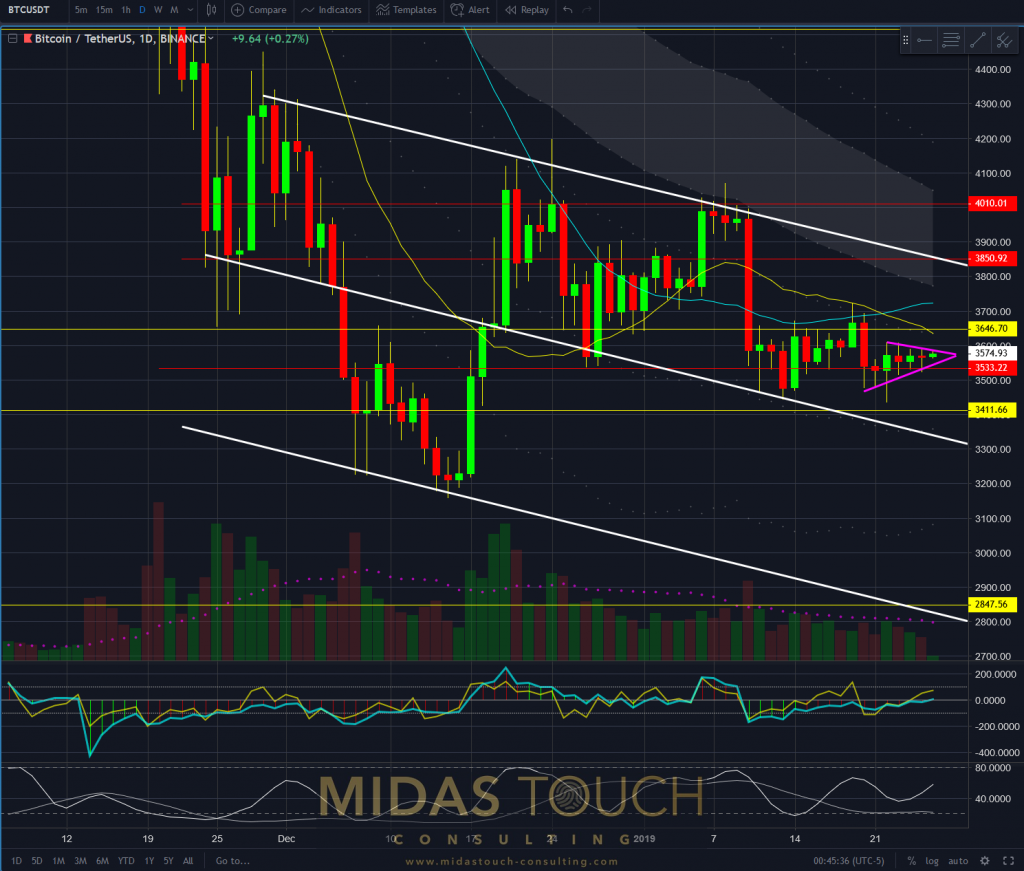
BTCUSDT daily chart as of January 26th, 2019
The range break has a slight favor towards the short side and a revisit of the price levels around 3,000 USD and even 2,800 USD is likely. Therefore portfolio adjustments are certainly wise but our focus is shifting towards long entries instead.
4-hour charts already point towards low risk entries that favor the long side and are under close observation:
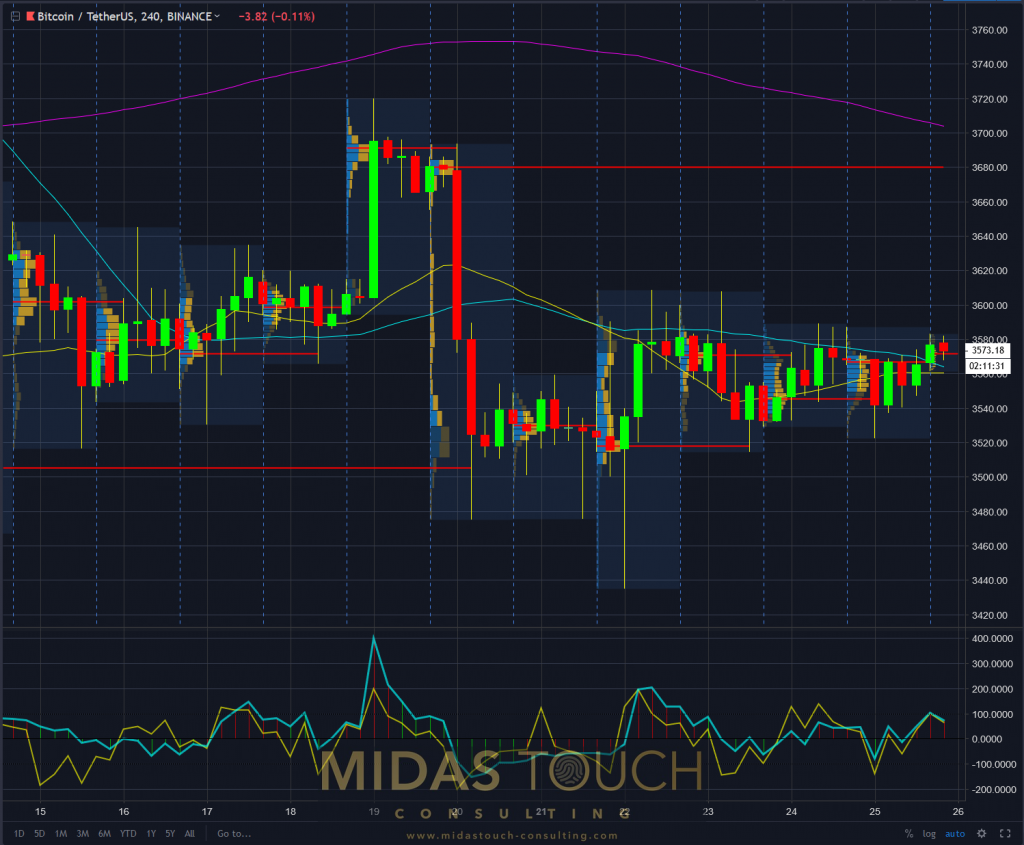
BTCUSDT 4 hour chart as of January 26th, 2019
The 60 minute time frame represents most transparent the tight squeeze range of the last week. A substantial move from these price levels might be imminent:
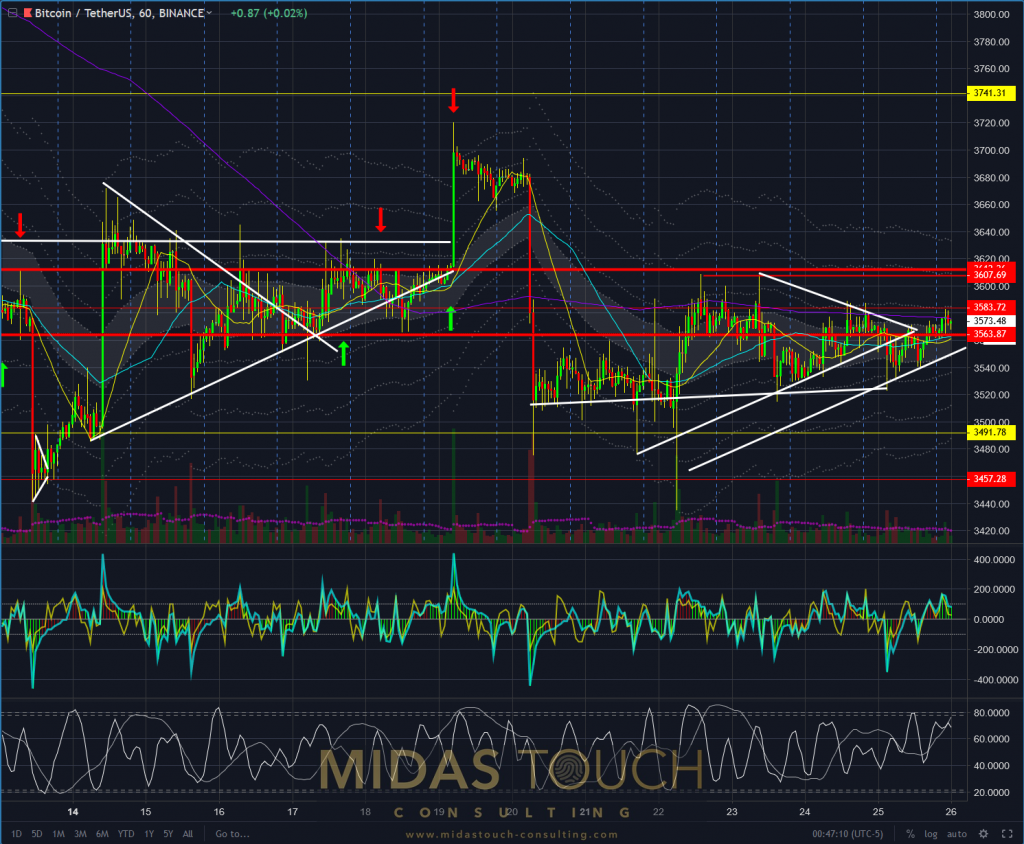
BTCUSDT hourly chart as of January 26th, 2019
All charts timely posted in our telegram channel.

