


Bitcoin – Crypto Winter Despite the Tokenization Boom
Bitcoin seems to endure a crypto winter despite a tokenization boom, as prices consolidate at lows amid ETF outflows and bearish charts. This analysis uncovers technical weakness, extreme fear sentiment, and macro paradoxes hinting at potential long-term recovery. Bitcoin – Crypto Winter Despite the Tokenization Boom.
Review
Over the past five weeks, weakness in the crypto sector has persisted after the steep decline since early October had already crushed sentiment. Despite the sharp correction, Bitcoin managed only a low-level consolidation, drifting sideways between roughly USD 84,000 and USD 92,000 for more than five and a half weeks. Surprisingly, the bulls failed to spark a sustainable recovery or the typical year-end rally. Instead, ETF outflows, profit-taking, and thin trading volumes weighed on momentum.
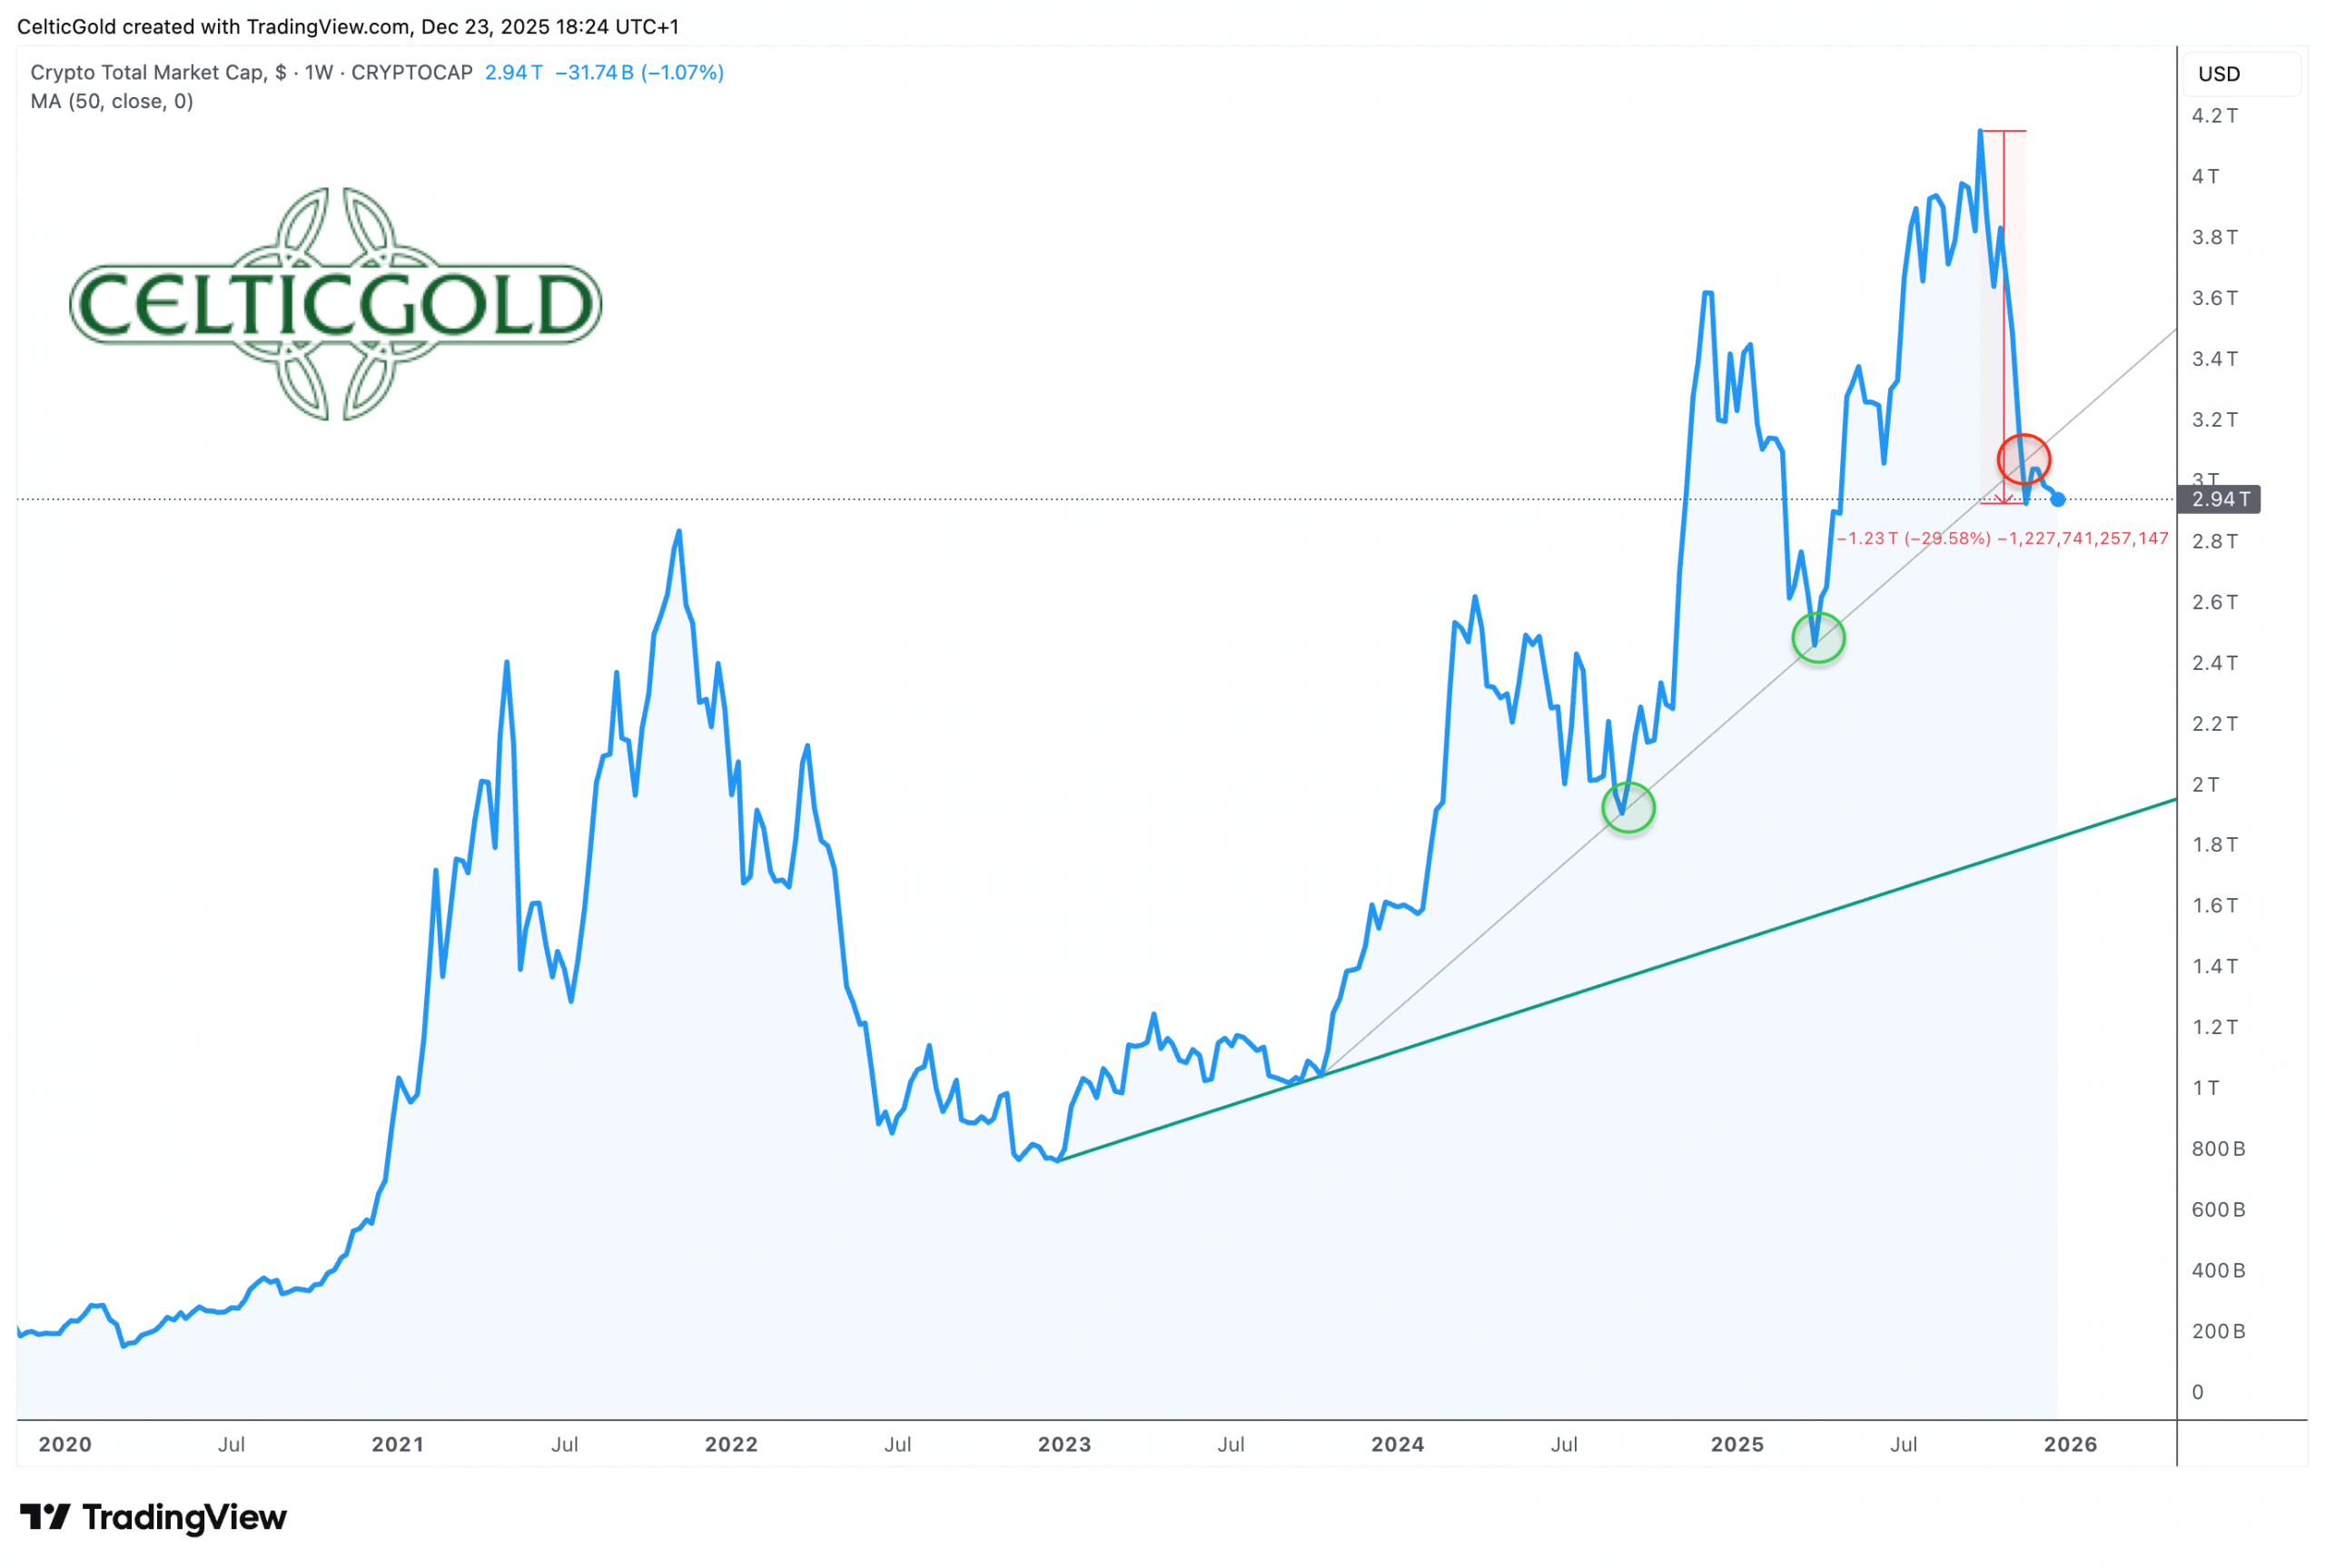
Crypto market cap, as of December 23rd, 2025. Source: Tradingview
The broader crypto market showed a similar picture: while Bitcoin held relative stability, altcoins such as Ethereum and Solana came under much heavier pressure. Ethereum at one point fell almost 47% from its summer highs, while Solana lost as much as 53.75% from its September peak near USD 253. Many altcoins are likely to end the year with double‑digit losses, with only a few niches—such as Web3 gaming tokens or privacy coins—showing pockets of relative strength. Overall, market capitalization shrank temporarily by about 5–6%, reflecting growing risk aversion and market fragmentation.
At the same time, Ethereum and Solana have evolved from rivals into complementary pillars of the crypto ecosystem. Ethereum now serves as the global settlement layer of the crypto industry. With daily stablecoin transfers worth around USD 90–100 billion and a record monthly volume of USD 2.82 trillion in October 2025, one thing is clear: when serious capital moves, it moves on Ethereum. Tether’s USDT—accounting for more than half of stablecoin activity—relies on Ethereum’s security, trust, and transaction finality. Not because Ethereum is the fastest network, but because it is the most reliable.
Meanwhile, Solana has increasingly positioned itself as the “liquidity layer” of crypto markets. While Ethereum stands for trust, Solana thrives on speed. For three consecutive months, SOL‑USD on-chain spot volume surpassed even heavyweights like Binance and Bybit, signalling genuine organic liquidity. With ultra‑low fees, high throughput, and a dominant USDC share (over 68% of Solana’s stablecoin volume), its total stablecoin base now exceeds several billion USD. Solana demonstrates that “trustworthy” doesn’t have to mean “slow”—it can mean efficient, low-cost, and perpetually active.
Technical Analysis for Bitcoin in US-Dollar
Weekly Chart: No signs of a trend reversal yet
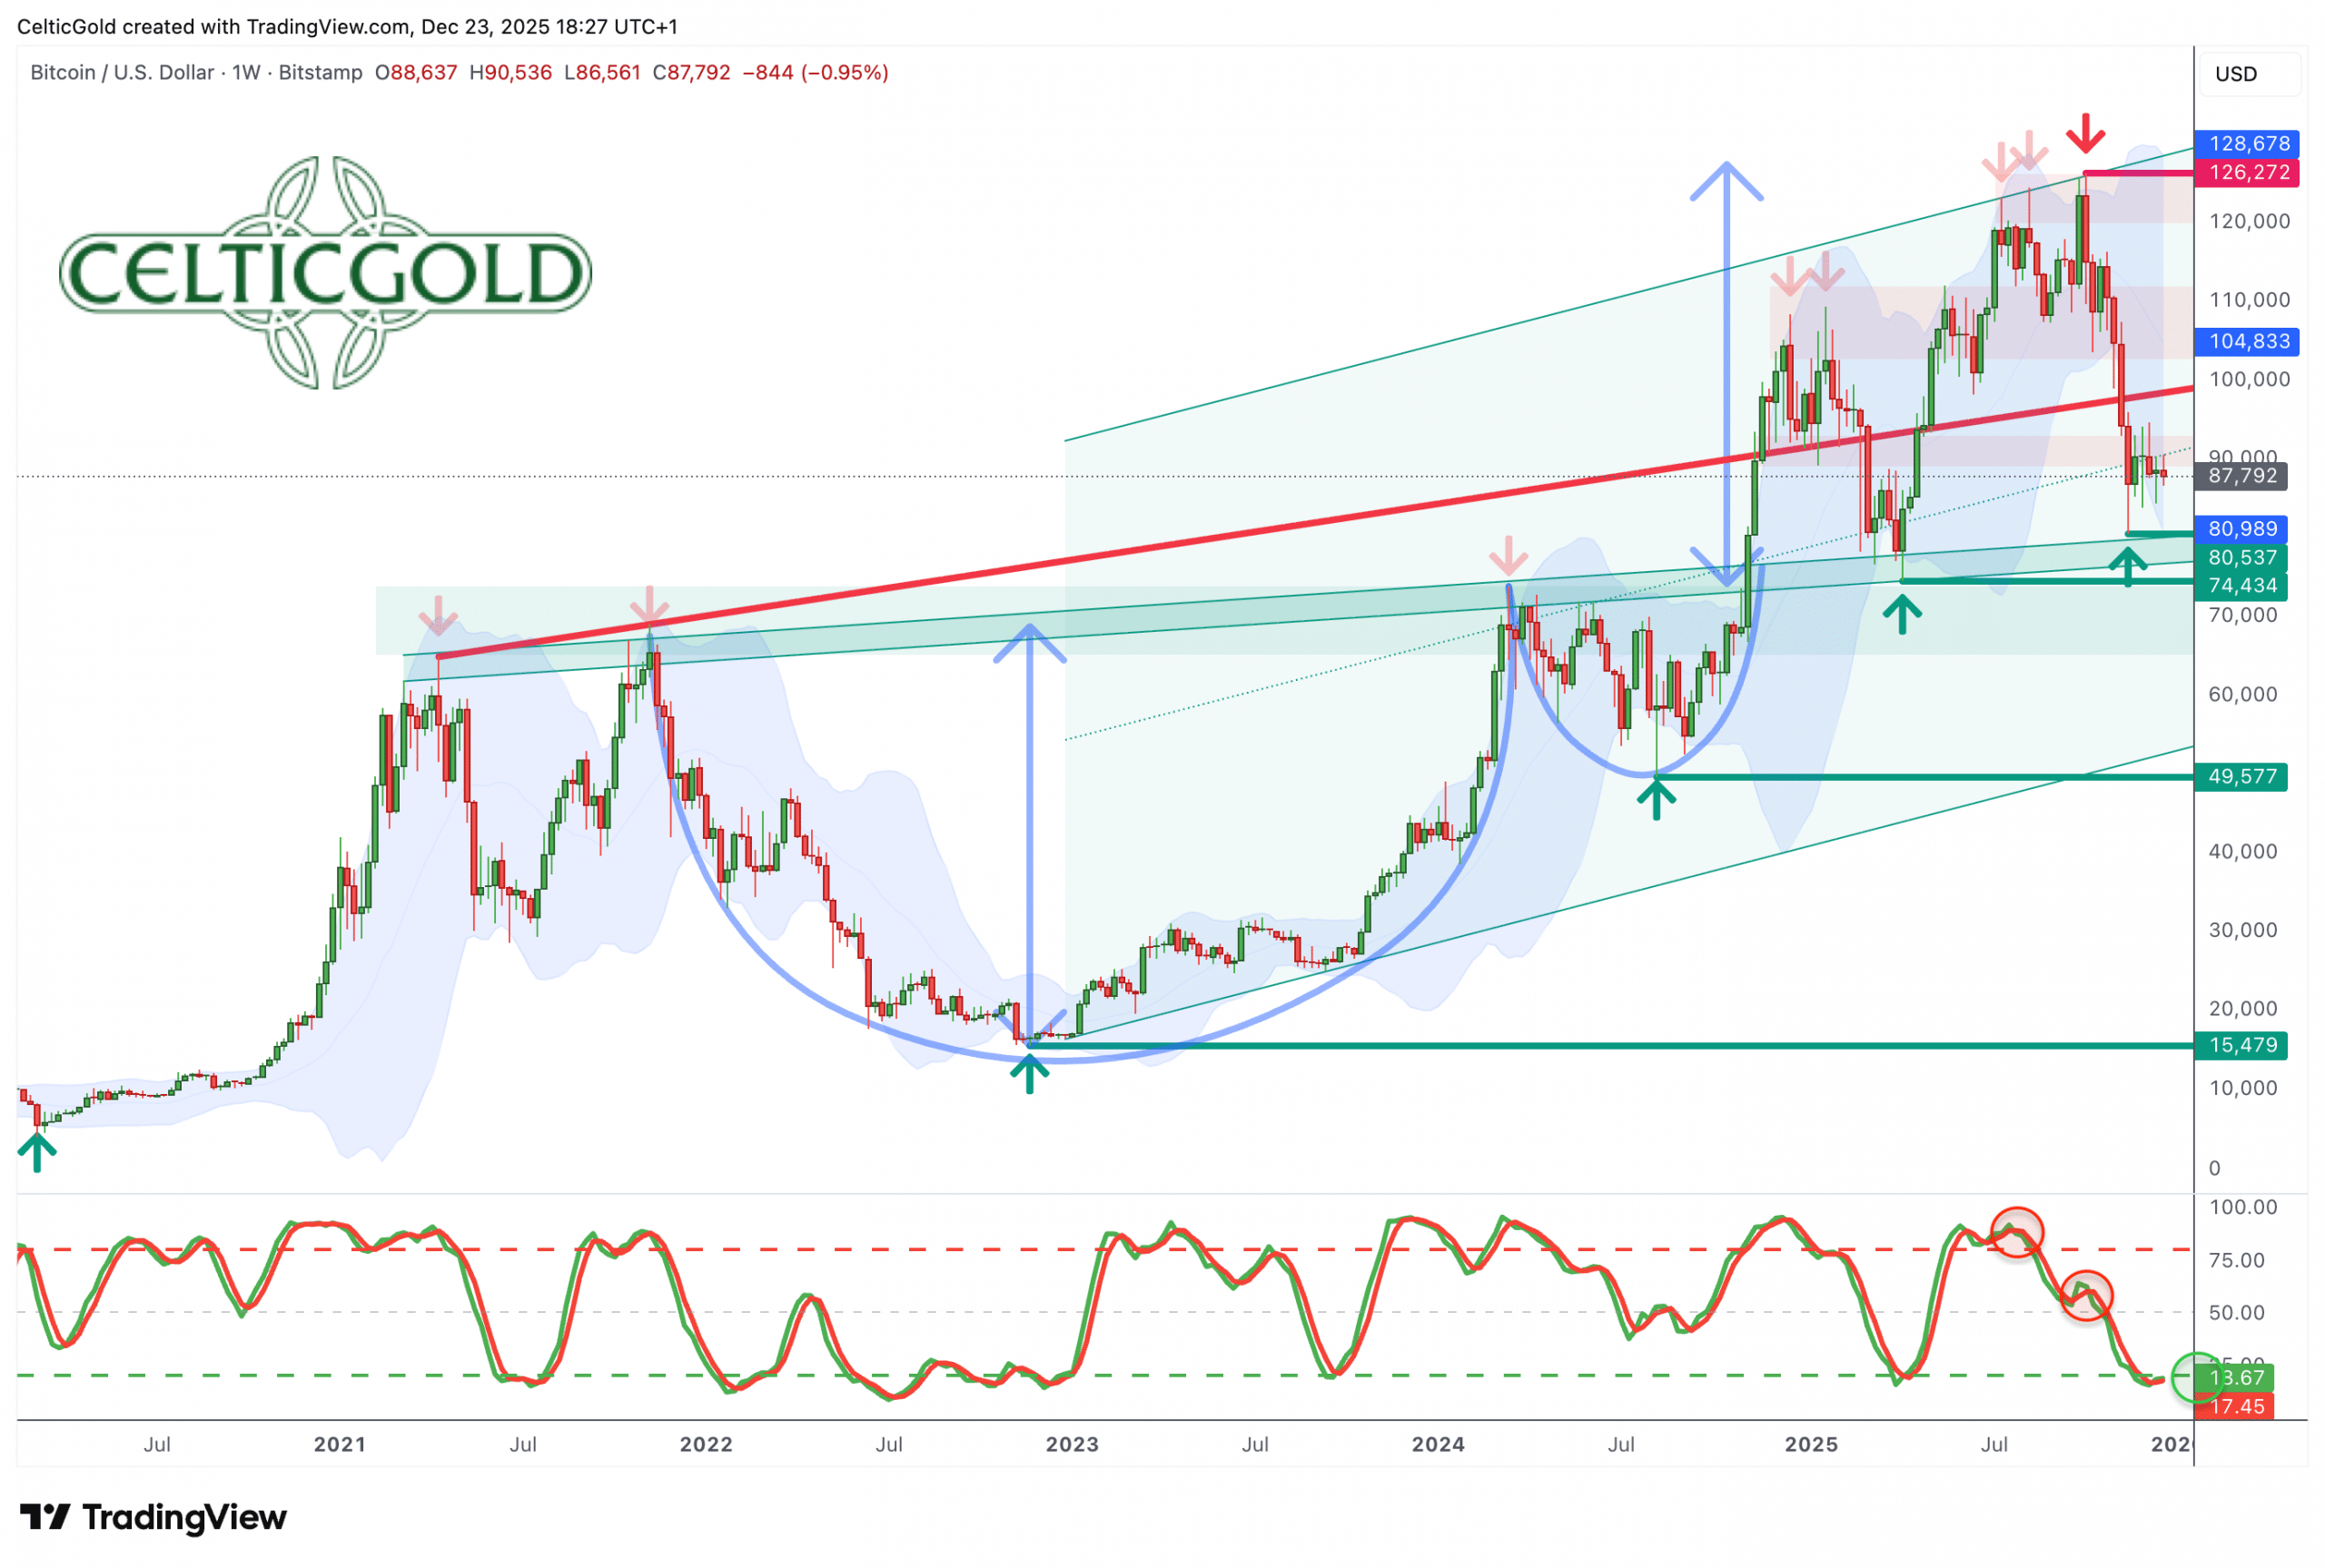
Bitcoin in USD, weekly chart as of December 23rd, 2025. Source: Tradingview
After plunging from its new all‑time high of USD 126,272 on October 6 down to USD 80,537, Bitcoin has struggled to recover. Prices have moved within a tight range, mostly between USD 85,000 and USD 93,000. Brief spikes above or below were quickly corrected. The round psychological level of USD 80,000 has at least provided a degree of support.
The weekly stochastic indicator remains deeply oversold. So far, however, momentum has not turned upward—it lingers in the oversold zone. If this persists, the stochastic could shift into a “super bearish” embedded state, potentially cementing the broader downtrend.
In summary, the weekly chart remains bearish, with no clear signs of a larger recovery ahead. The ongoing consolidation suggests another possible downward leg. Ideally, the wide support zone around USD 80,000 will hold. If it breaks, the next downside target lies near USD 70,000.
Daily Chart: Sideways consolidation
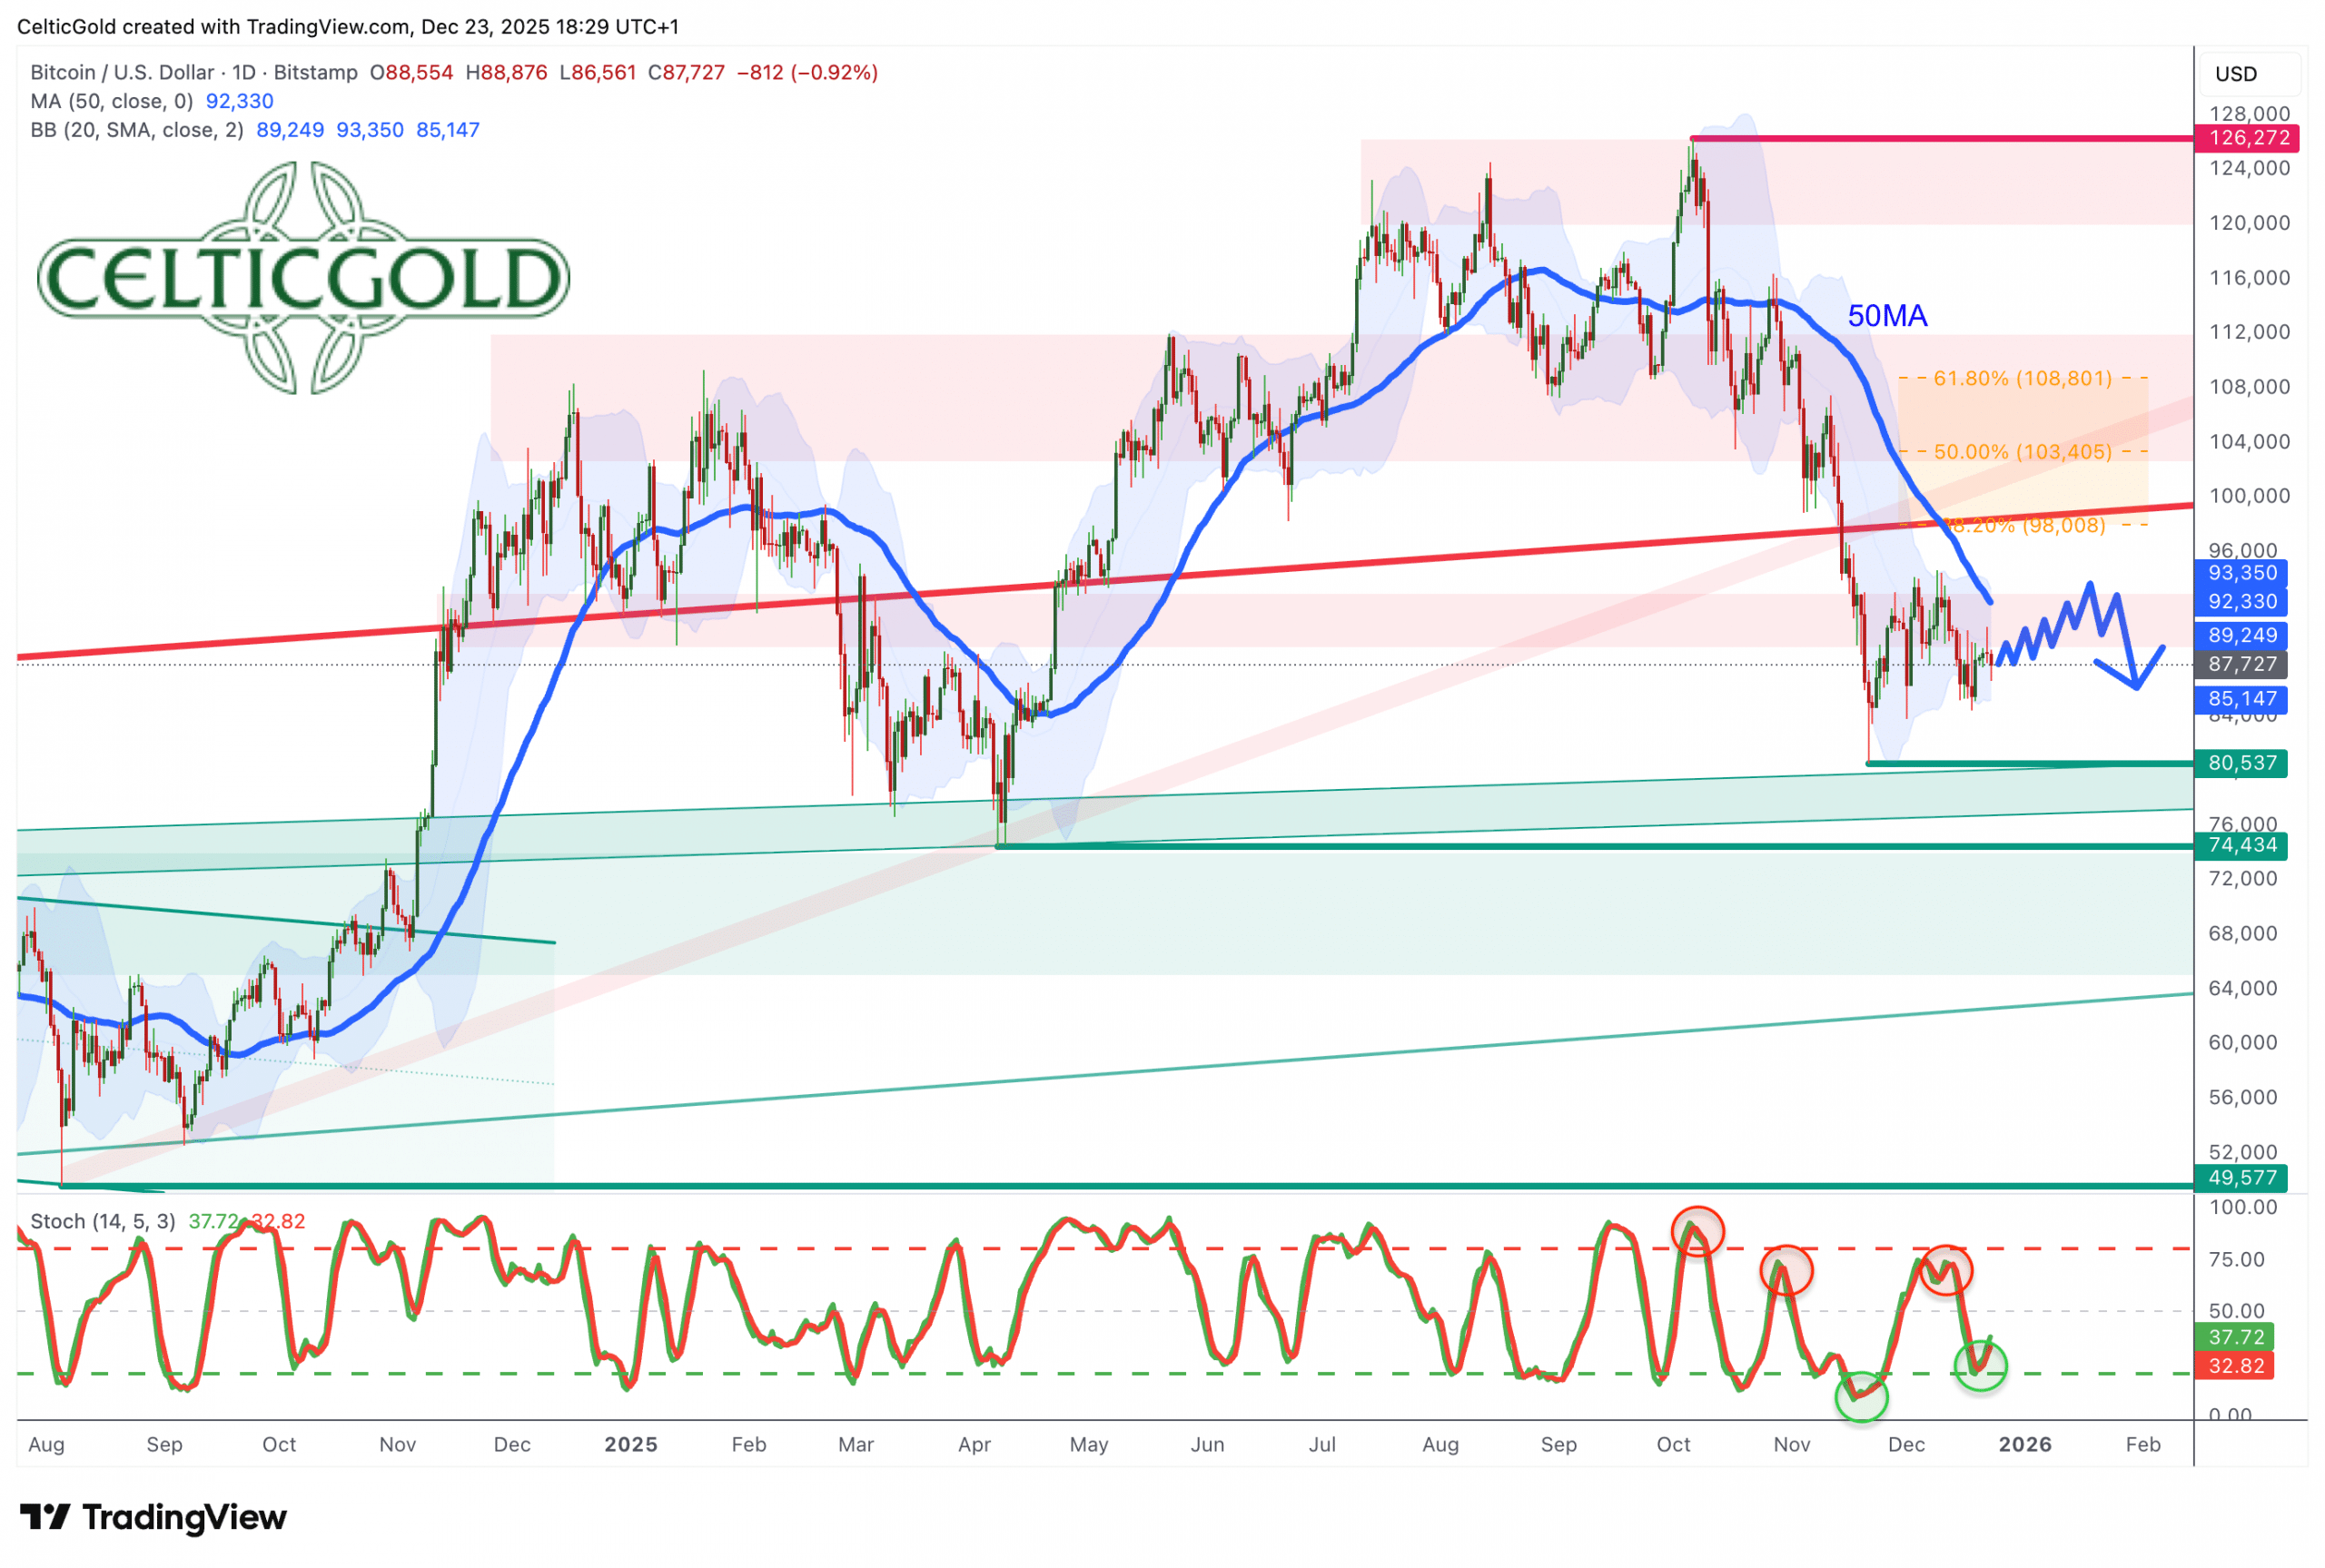
Bitcoin in USD, daily chart as of December 23rd, 2025. Source: Tradingview
Bitcoin’s daily chart shows a narrow consolidation lasting about 10 days, confined between roughly USD 85,000 and USD 90,000. After a brief rally to USD 90,500, sellers quickly regained control, maintaining strong downward pressure. Thin holiday liquidity has also hampered attempts at a bigger rebound.
The declining 50‑day moving average (USD 92,325) has emerged as a key resistance level, reinforced by the upper Bollinger Band near USD 93,358, forming a robust resistance zone around USD 95,000. A move above that area currently seems unlikely. The lower Bollinger Band (USD 85,107) continues to define the consolidation range.
Overall, the daily chart signals indecision among market participants. The broader trend remains bearish, though the momentum oscillator has issued a minor buy signal amid the sideways action. Without strong bullish divergence, any breakout beyond USD 90,000 will likely only carry Bitcoin modestly higher toward USD 93,000–95,000.
Bitcoin Sentiment – Fear Takes Hold
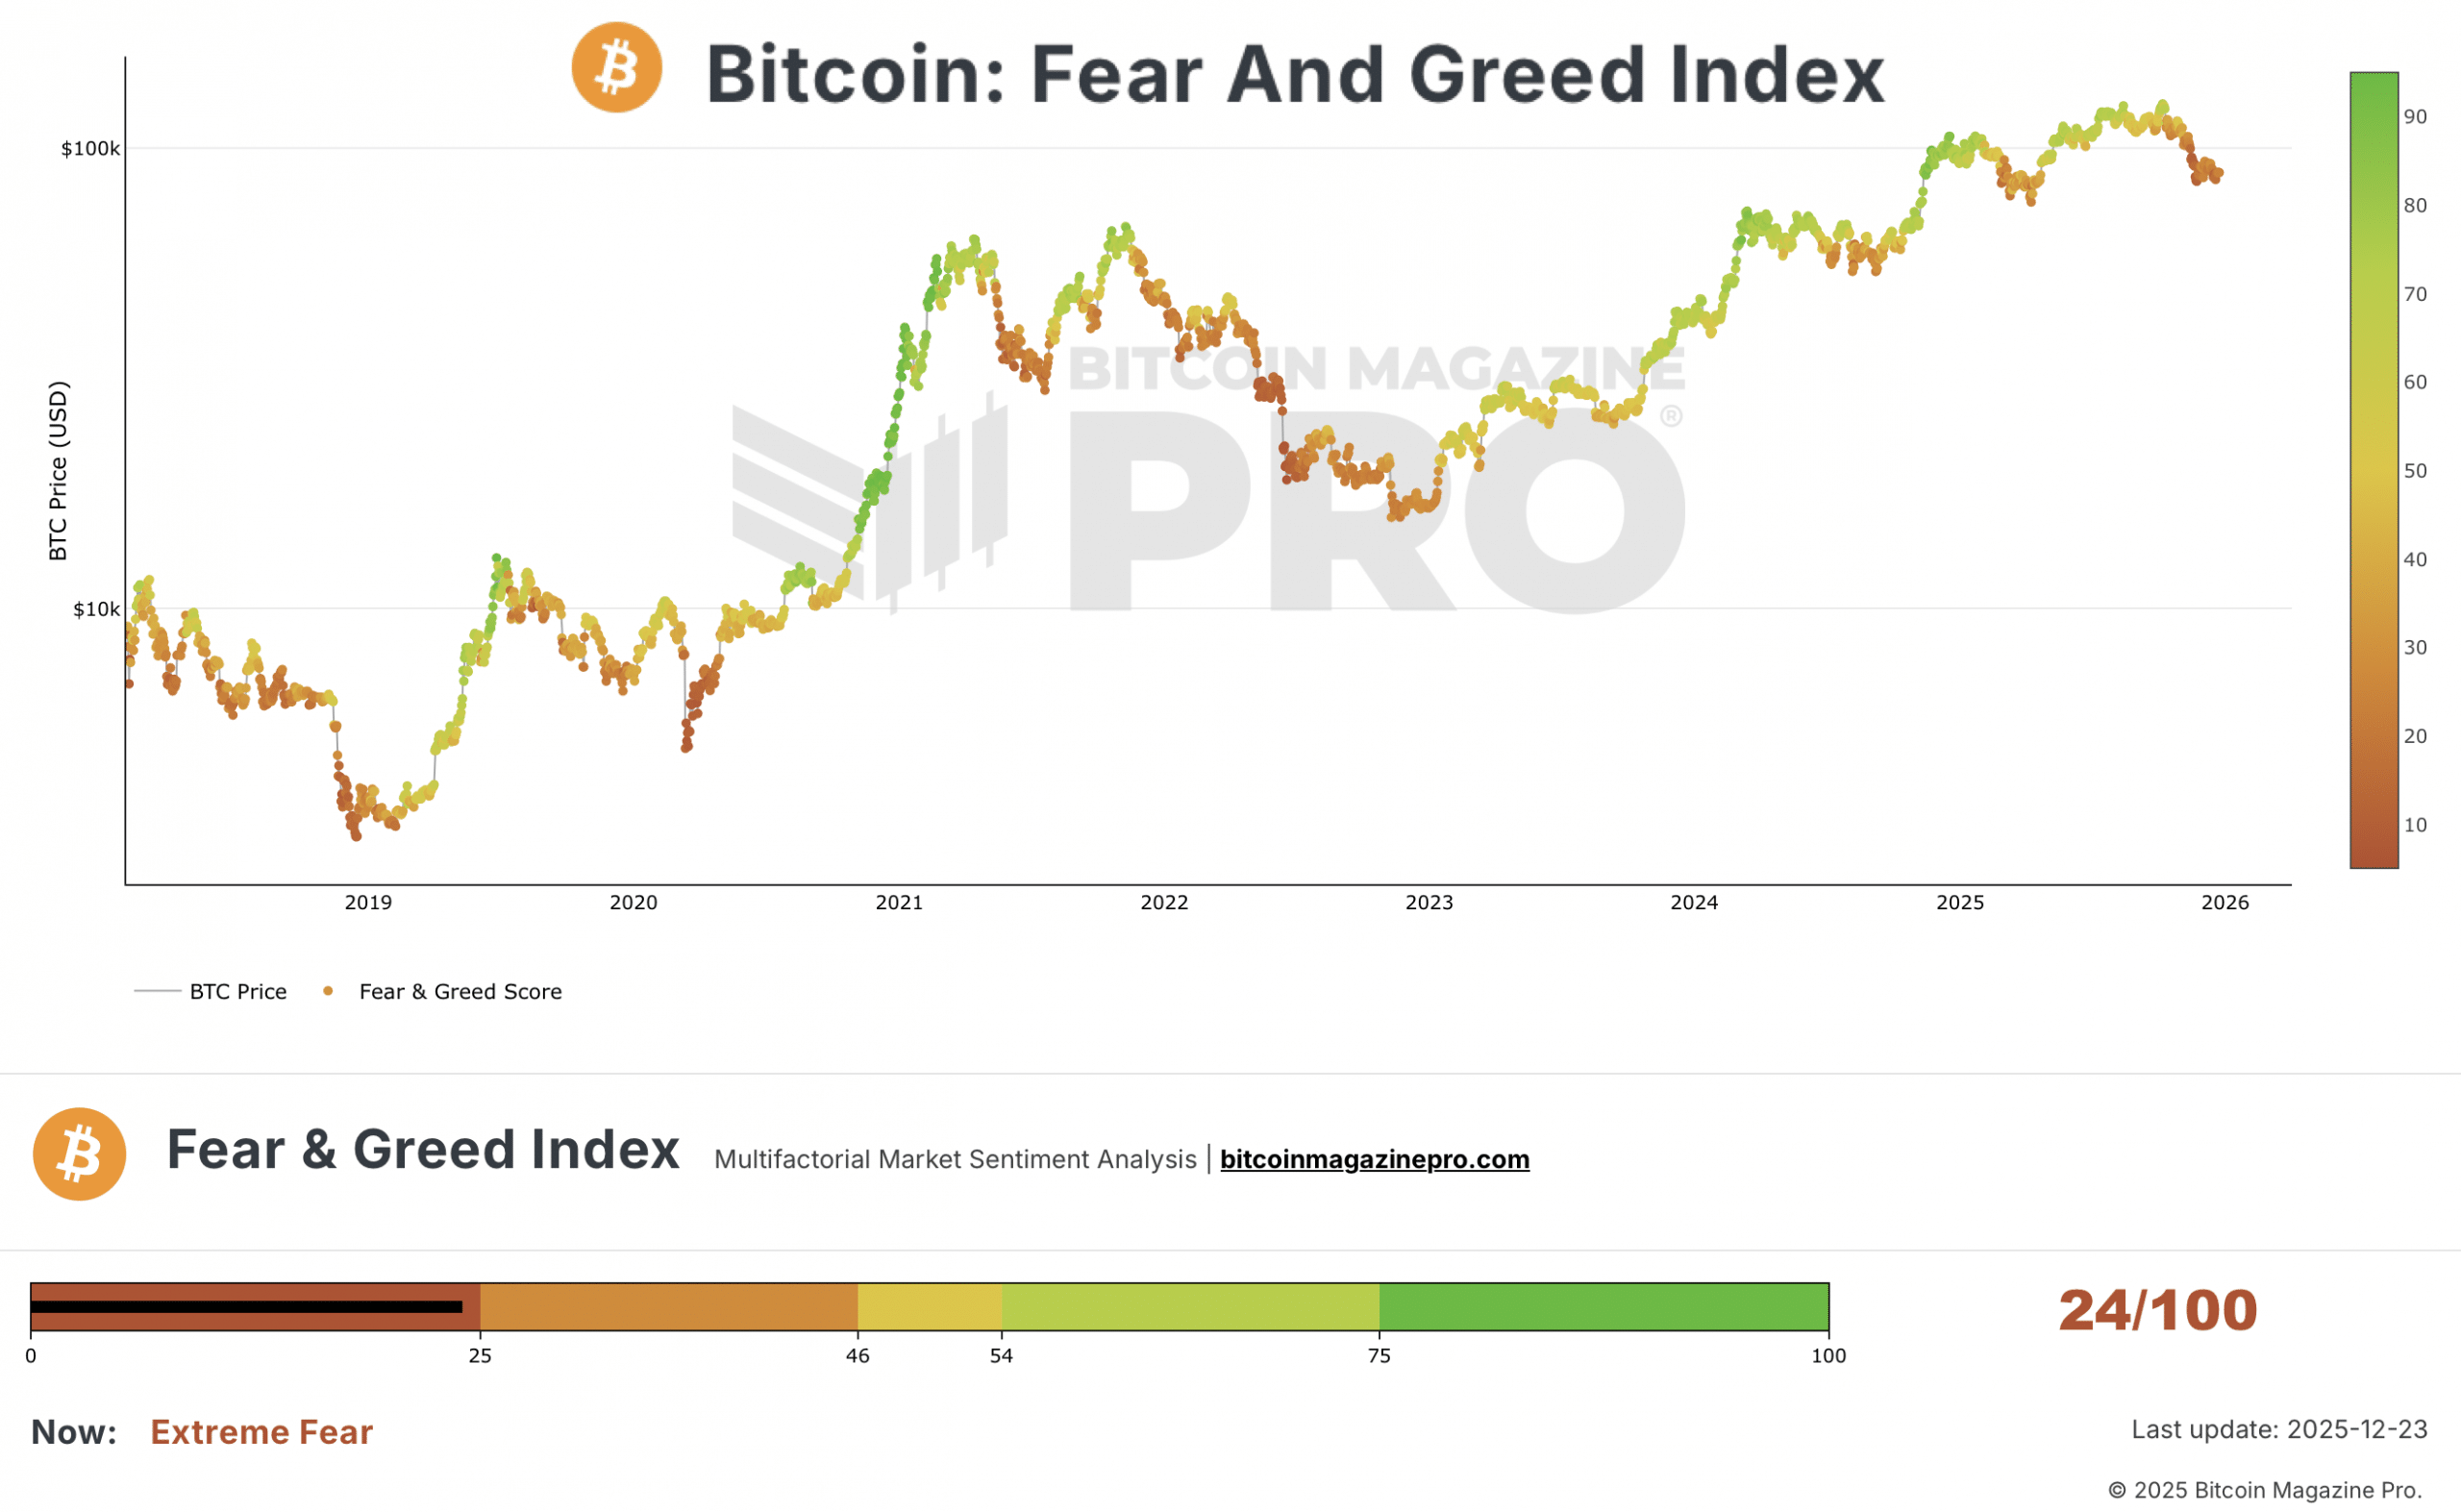
Crypto Fear & Greed Index, as of December 23rd, 2025. Source: Bitcoin Magazine Pro.
The Crypto Fear & Greed Index currently stands at 24/100, signalling extreme fear across the market. This reflects the persistently negative investor mood following Bitcoin’s sharp sell‑off. Historically, such extreme fear levels often precede trend reversals. However, sentiment has been depressed for weeks, suggesting investors are becoming desensitized to the gloom.
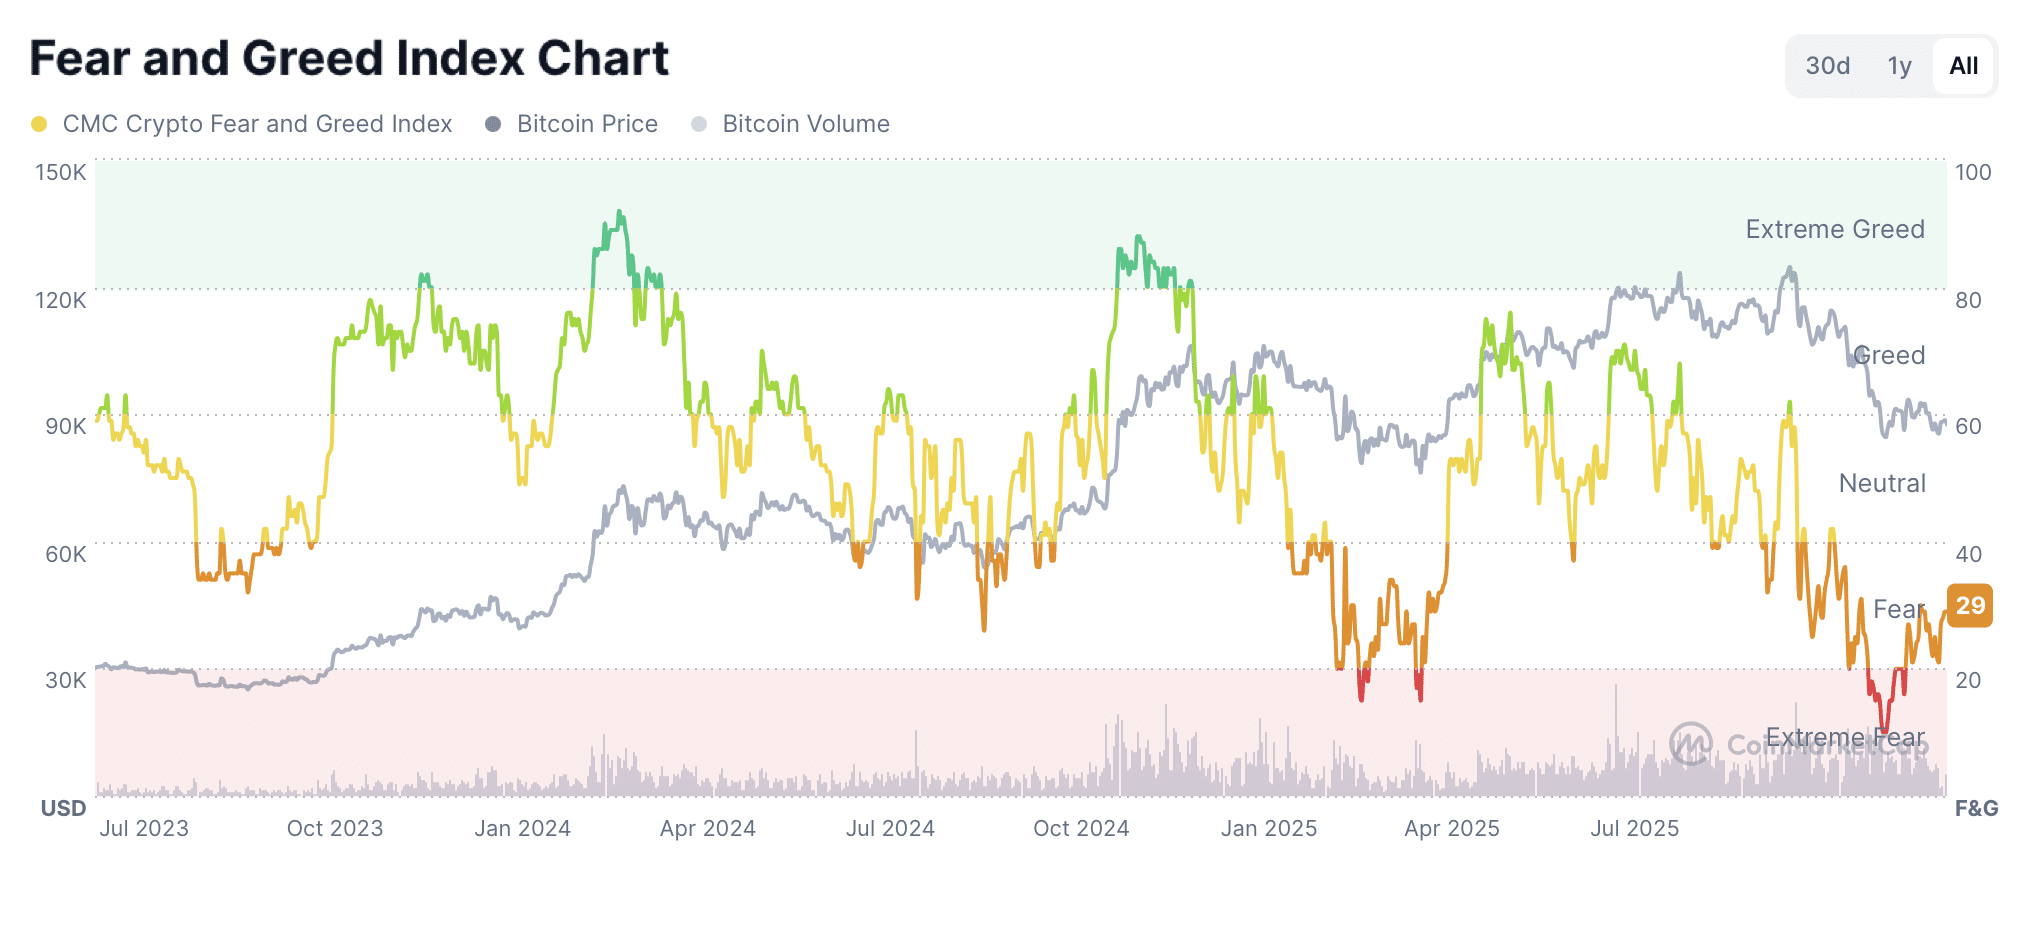
CMC Crypto Fear & Greed Index, as of December 23rd, 2025. Source: Coinmarketcap
The CMC Crypto Fear & Greed Index, which covers the broader market (including top‑ten coins and stablecoin dynamics), sits slightly higher at 29/100—still at “fear,” but indicating subtle differences in volatility, momentum, and social sentiment. Readings below 30 have historically coincided with local market bottoms and attractive long‑term entry points, provided the broader uptrend remains intact.
In short, sentiment remains extremely bearish. This could serve as a contrarian signal for an eventual trend reversal—but only if confirmed by price action. Without it, any attempt at bottom‑fishing risks turning into a trap.
Bitcoin Seasonality – Sideways into Spring?
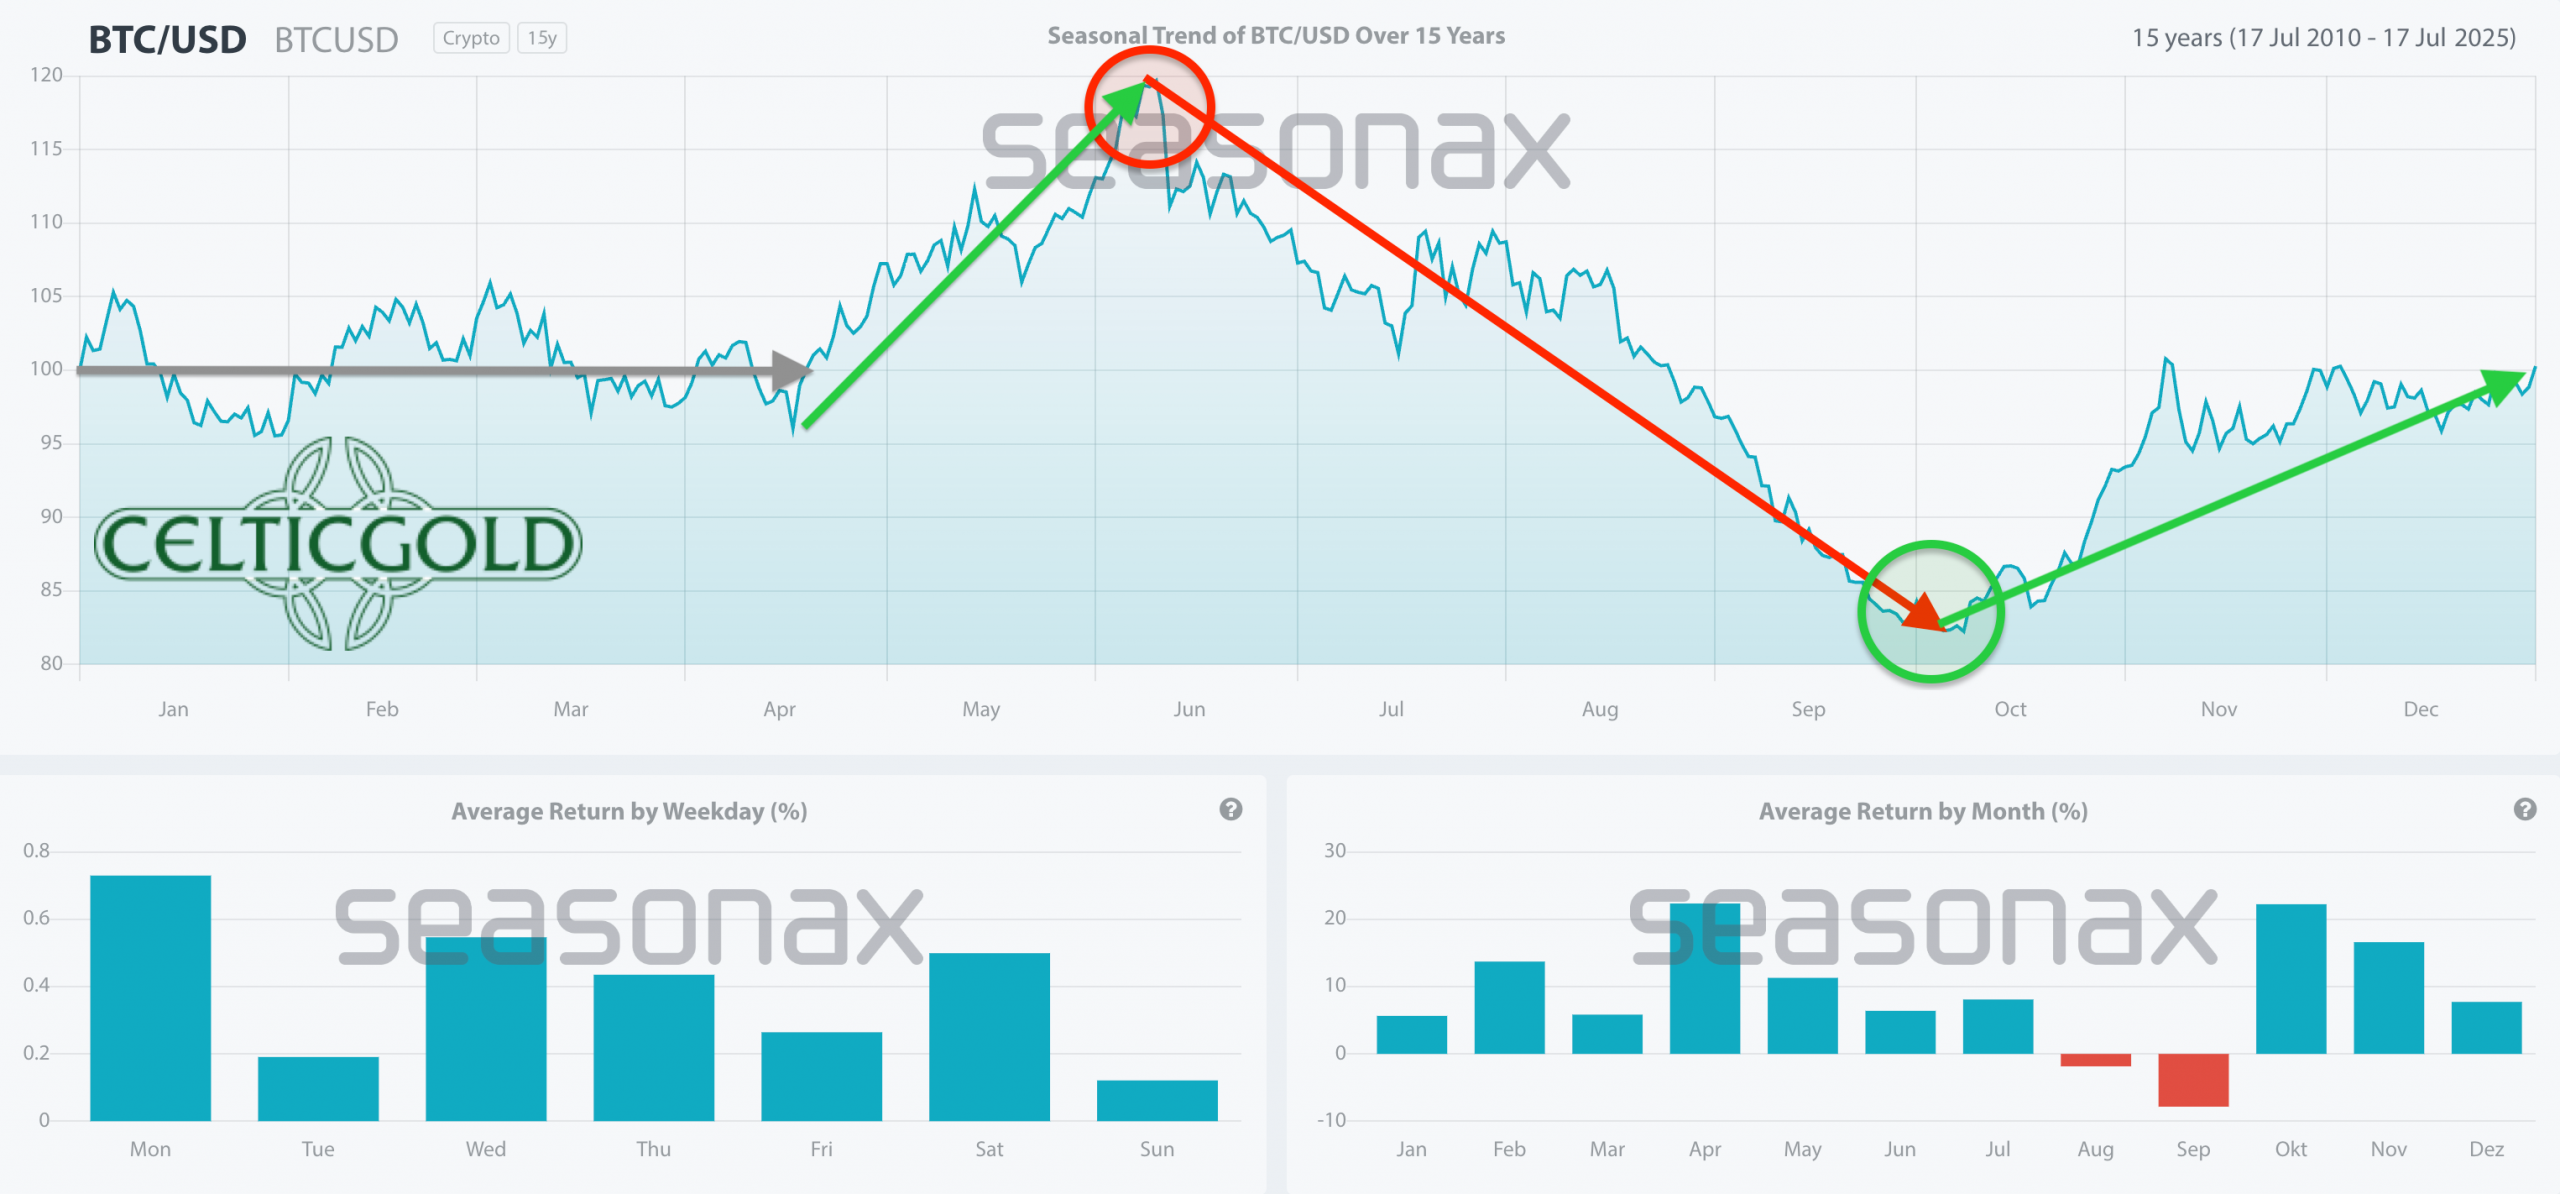 Bitcoin Seasonality as of December 23rd, 2025. Source: Seasonax
Historical data since 2010 shows clear seasonal patterns: Bitcoin’s strongest months are typically October, November, and April, each delivering average gains of more than 20%, while December tends to be only slightly positive. Weaker phases usually occur from June through September. The ongoing December consolidation and lack of a “Santa rally” still fit within this pattern. However, the scale of the correction since early October deviates notably—suggesting that “something about Bitcoin isn’t adding up.”
Seasonality, therefore, provides only limited support. Statistical averages suggest that prices may continue to move sideways in the first quarter of 2026.
Sound Money – Bitcoin vs. Gold (Bitcoin/Gold-Ratio)
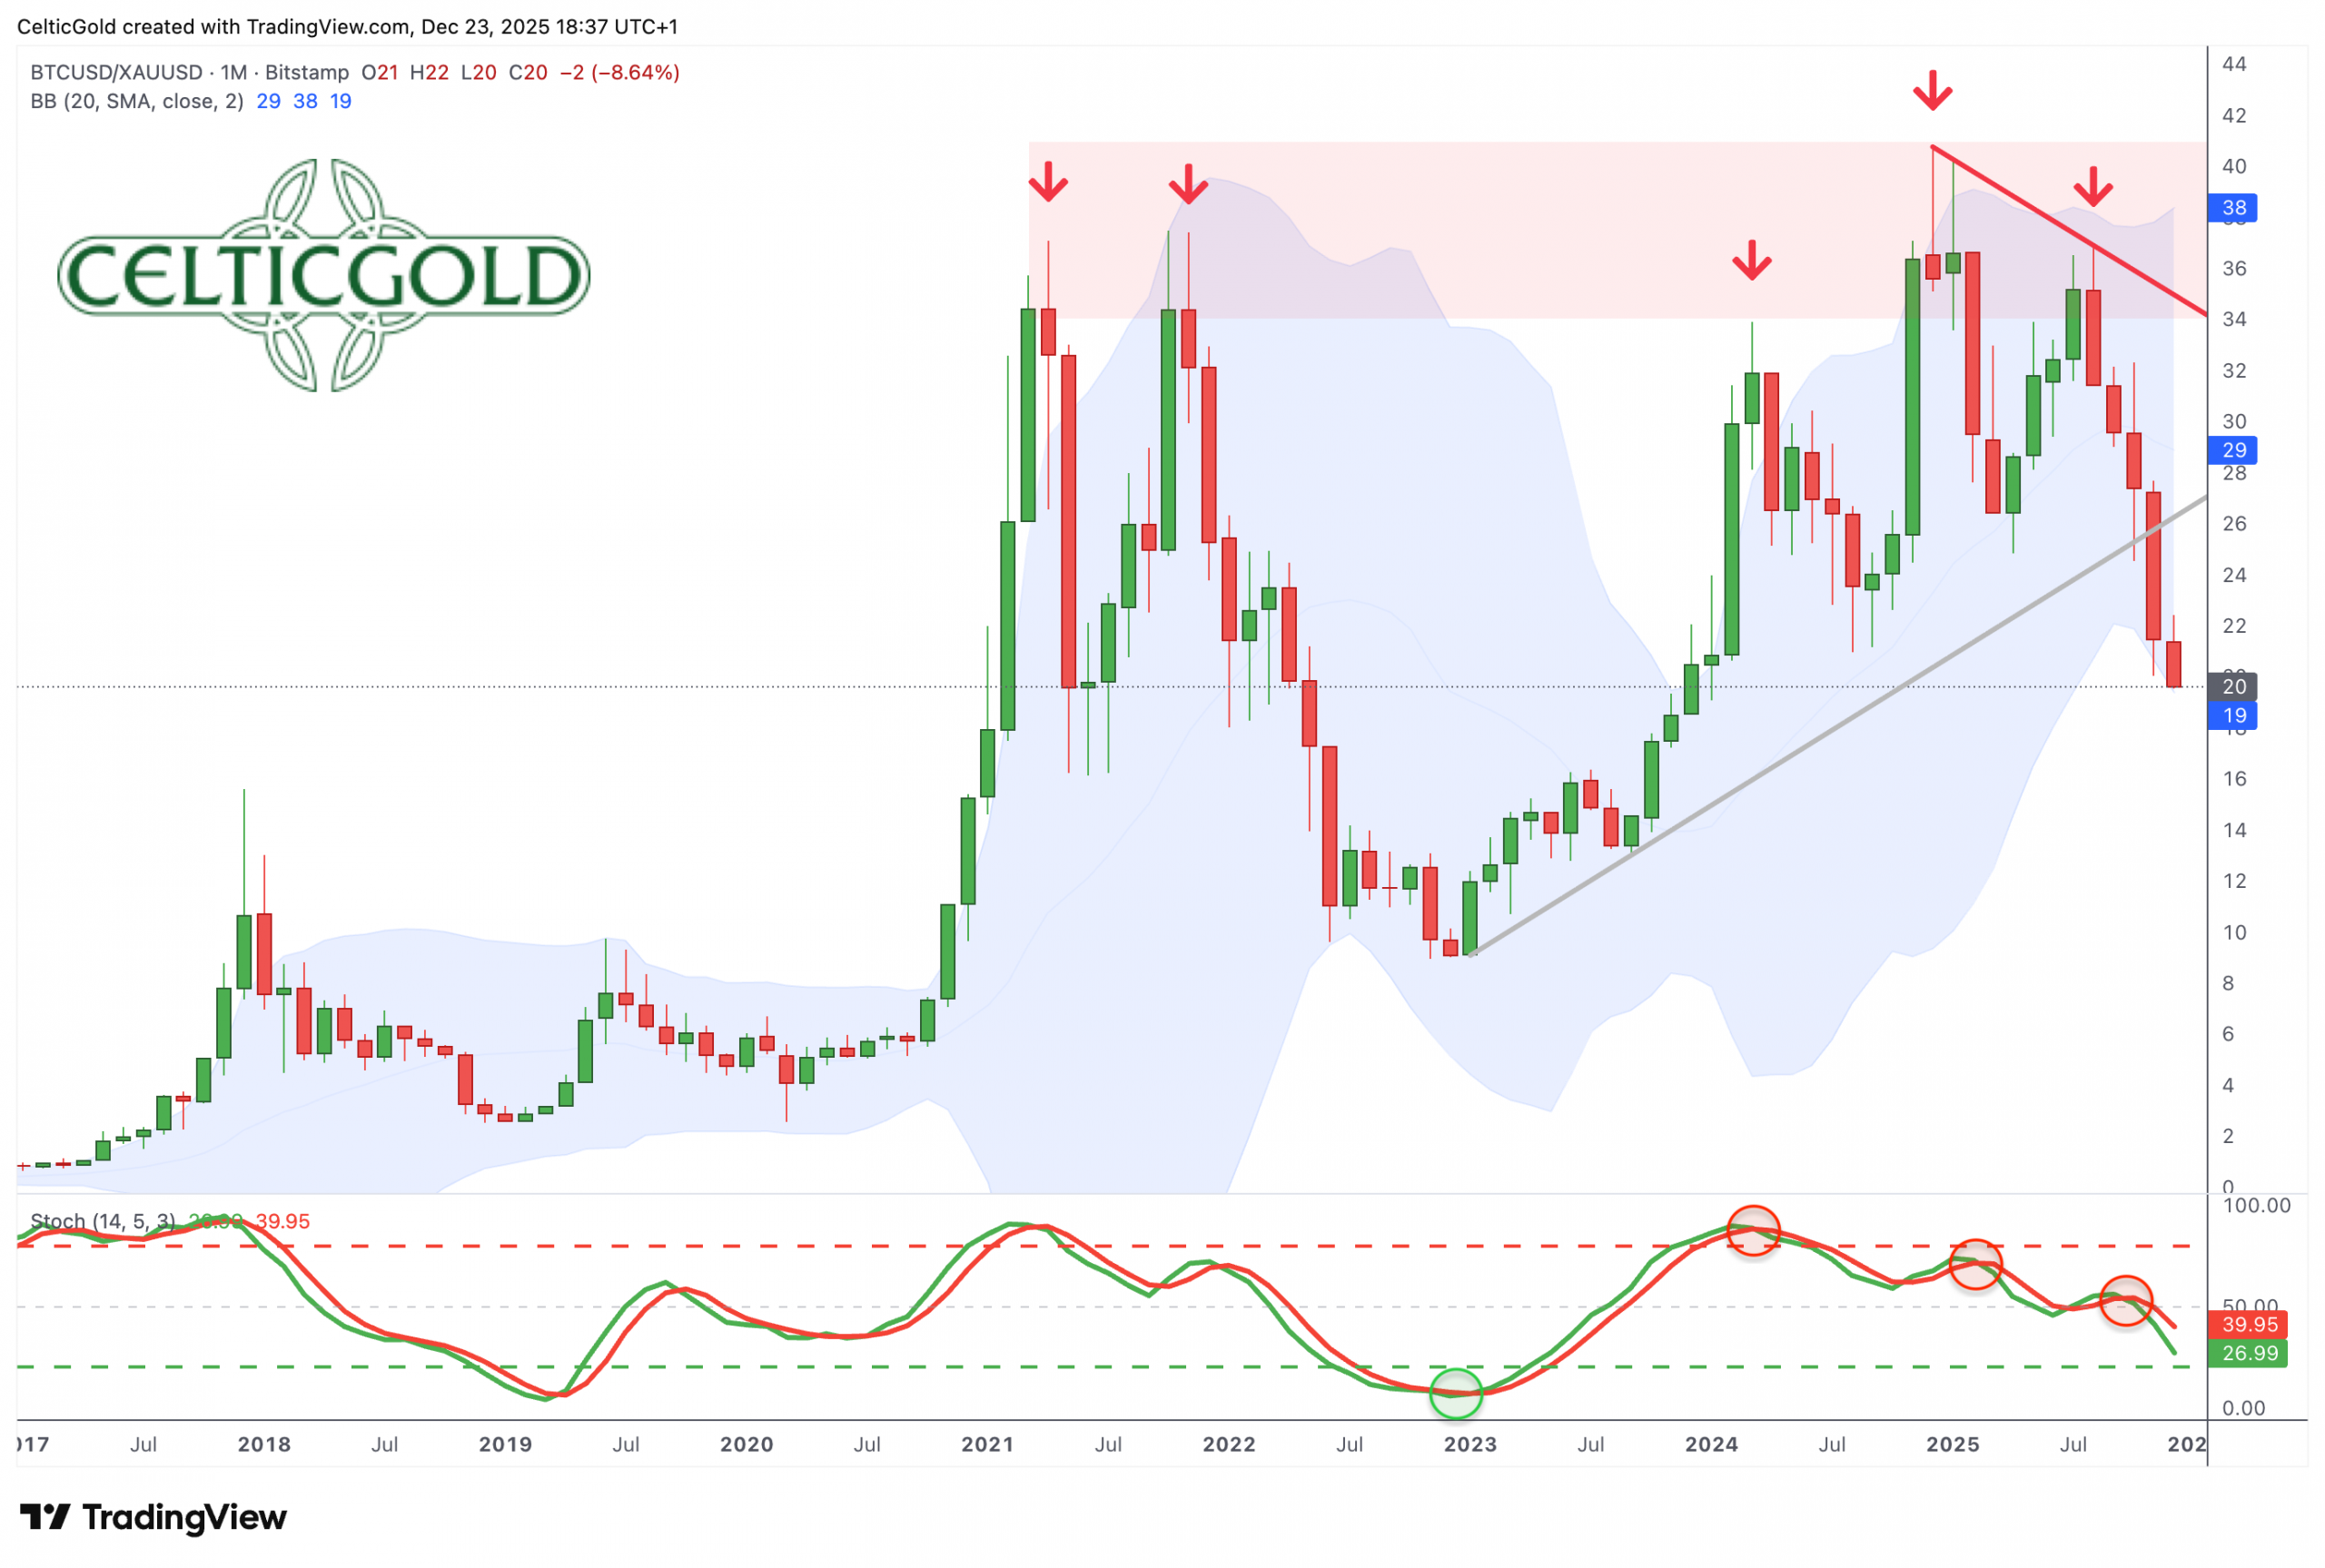 Bitcoin/Gold-ratio, daily chart as of December 23rd, 2025. Source: Tradingview
At current prices of roughly USD 87,250 per Bitcoin and USD 4,445 per ounce of gold, one Bitcoin equals about 19.62 ounces of gold—or one ounce of gold equals about 0.051 BTC. This means Bitcoin has lost another 15% relative to gold in recent weeks.
After failing five times to break through the 34–41 range, the ratio has been falling sharply since early August. Despite this, Bitcoin maximalists continue to claim BTC has “already beaten” gold. We consider that view misguided. In truth, the two assets complement each other well—they are distinct, largely uncorrelated stores of value. Gold, however, has clearly been the stronger performer over the past four and a half years.
Technically, the monthly chart shows the ratio curving lower along the bottom Bollinger Band, implying gold may continue to outperform. A meaningful reversal in monthly stochastic momentum could take time.
In summary, the Bitcoin/Gold-ratio is strongly oversold. However, Bitcoin’s downtrend against gold shows no signs of weakness yet.
Macro Update – Carry‑Trade Collapse, Crypto Winter, and the Liquidity Paradox
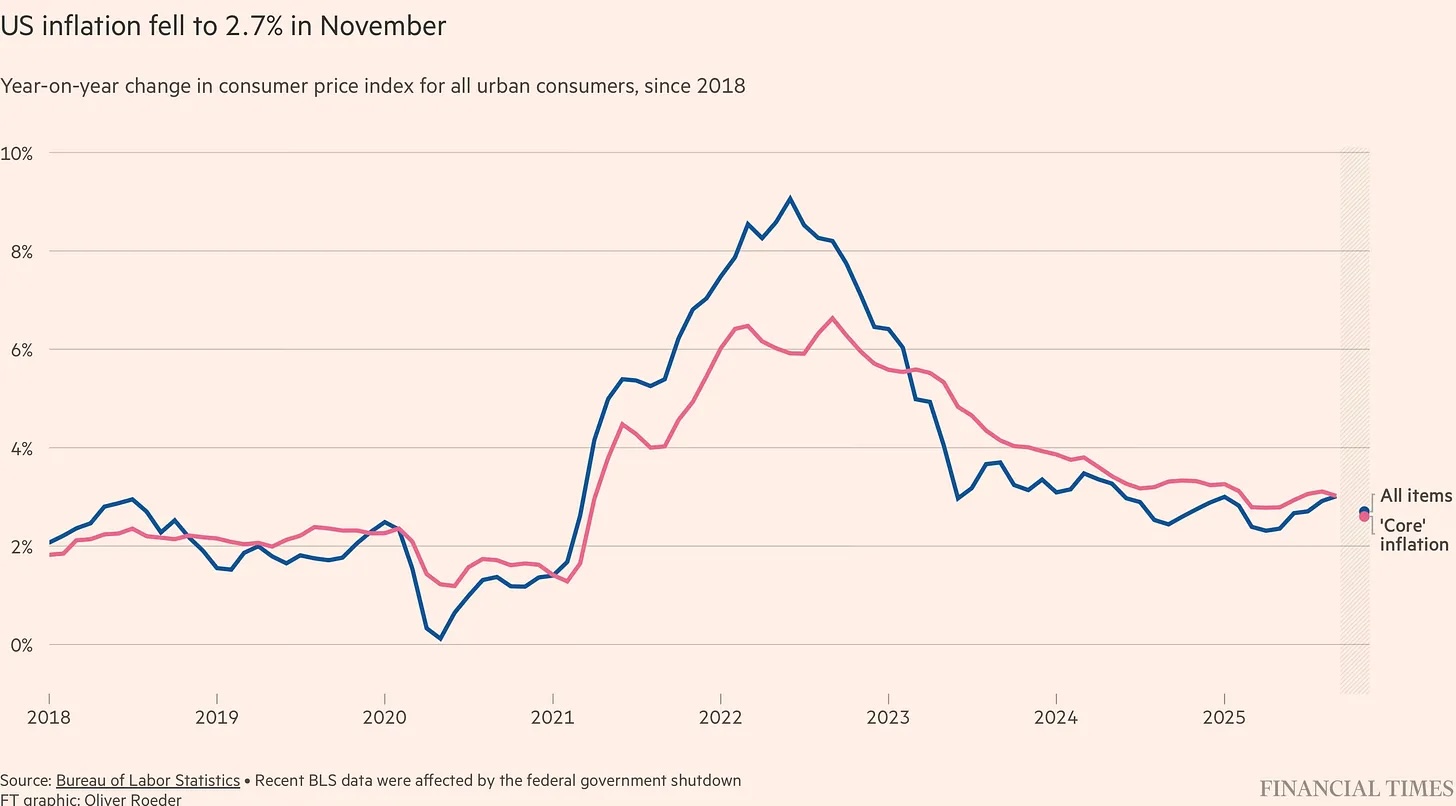 Year-on-year change in consumer price index since 2018, as of December 19th, 2025. Source: Financial Times
Global financial markets are entering the end of 2025 in a phase of profound transition. Geopolitical tensions, monetary easing, and structural shifts in the financial architecture are converging. With its third rate cut of the year (−25 bps), the Federal Reserve has officially ushered in a phase of liquidity expansion. After months of stability in equity indices and modest relief in inflation, core inflation has now fallen to 2.6%, indicating a sharper‑than‑expected cooling in underlying price pressures—even considering October’s missing data due to the government shutdown. This pivot comes at a fragile moment for markets.
Debt and market fragility
As G7 bond yields surge and sovereign markets in Japan, Italy, and the UK flirt with systemic instability, it becomes clear that a prolonged bond bear market now overlaps with overvalued equity markets. The world faces a potential deflationary shock in real assets, triggered by the unwinding of decades‑long distortions in the interest‑rate structure.
Japan’s pivotal role
Japan remains at the heart of this dynamic. The Bank of Japan’s zero‑rate era fueled a global credit carousel: Japanese pension funds, insurers, and hedge funds hold over USD 1.2 trillion in US Treasuries. Through offshore structures in Luxembourg, the Caymans, and London, these “carry trades” have ballooned to USD 3.3 trillion. Rising yields now threaten to unwind this machinery—with major implications for global dollar liquidity.
Bitcoin’s decoupling from global M2 liquidity
Bitcoin, meanwhile, has sharply decoupled from global M2 liquidity—a relationship that historically tracked central banks’ balance‑sheet expansions. Since the October 10 sell‑off—triggered by Trump’s 100% tariff announcement against China—that correlation has broken. Within a month, Bitcoin lost 25%, 1.64 million traders were liquidated, and the total crypto market cap fell by USD 1.1 trillion.
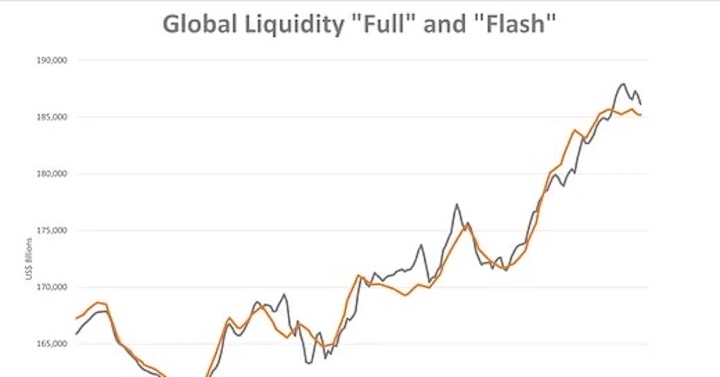
Global Liquidity, as of December 23rd, 2025. Source: Financial Times
Even as the Fed injects new liquidity—via a third rate cut and USD 40 billion in Treasury‑bill purchases over 30 days—the crypto sector has seen no rebound. Institutional outflows from ETFs continue; corporate treasuries are nearly depleted; whales have sold over USD 30 billion; and retail investors are sidelined. In this crypto winter, leverage‑sensitive assets like Bitcoin are buckling, while gold and silver shine amid scarcity and distrust.
Still, some institutional buyers are quietly accumulating again. The divergence between capital flows and market prices may signal early bottom formation—especially if the Fed’s liquidity injections through its Reserve Management Purchase (RMP) program gain traction.
Tokenization and structural integration
Looking ahead to 2026, the convergence of softening inflation, weak growth, and renewed central‑bank balance‑sheet expansion could favor hard assets—metals, commodities, and Bitcoin alike. As the most liquidity‑sensitive asset class, Bitcoin tends to react first when global credit cycles turn. Yet so far, no such reaction is visible.
China might add stimulus via fiscal measures and credit easing, while U.S. fiscal programs could continue supporting capital markets. At the same time, the market infrastructure itself is shifting toward tokenization. The SEC has approved the DTCC three‑year blockchain pilot for securities settlement, and Congress is working to allow Bitcoin and other digital assets in 401(k) retirement plans. Together, these steps point toward a gradual transition to a tokenized economy in which digital assets become native components of regulated capital markets.
From a macro perspective, this structural integration could mark a pivotal moment for the crypto sector. While outflows and weak risk appetite dominate the short term, a regulatory and institutional foundation is forming that could support digital assets in the long run. Markets are not yet pricing in these reforms—leaving room for revaluation in 2026.
The paradox of the Bitcoin fortress

The Bitcoin Paradigm Shift, as of December 9th, 2025. Source: Shanaka Anslem Perera
Meanwhile, MicroStrategy—the symbol of corporate Bitcoin adoption—is facing the downside of its leveraged strategy. After a drawdown of more than 35%, the company is reportedly under pressure to sell part of its Bitcoin reserves to service debt. Ironically, it was USD 1.4 billion in fresh fiat liquidity that stabilized Saylor’s self‑proclaimed Bitcoin fortress—a stark reminder that “the Dollar saves the Bitcoin missionary.”
Between weakness and structural strength
The outlook remains mixed. Technically, further downside risk persists. Fundamentally, signals of a broader market re‑rating are forming. The decoupling from liquidity cycles may not mark a structural break—but a temporary disruption before monetary easing once again feeds through.
Should carry trades in Japan or Europe implode, the U.S. Dollar could strengthen further, pressuring risk assets like Bitcoin in the short term. Yet medium term, renewed global stimulus could lift both Bitcoin and gold as alternative stores of value.
In essence, short‑term weakness meets long‑term structural strength. Bitcoin remains the seismograph of global liquidity—highly volatile yet uniquely sensitive to the tectonic shifts of the financial system. A deeper correction toward USD 70,000 could finally attract aggressive buyers again.
Conclusion: Bitcoin – Crypto Winter Despite the Tokenization Boom
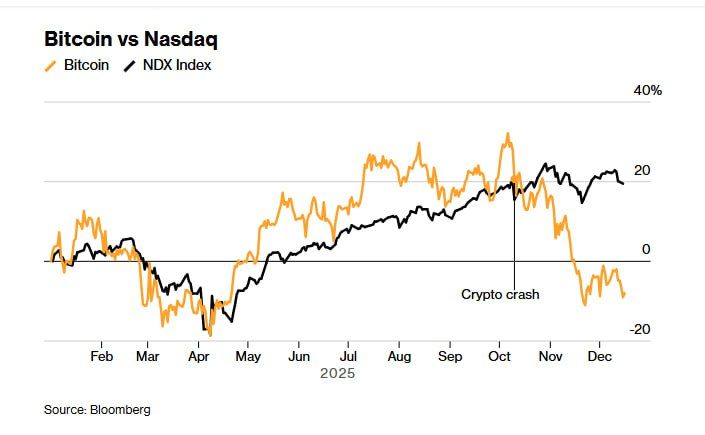
Bitcoin used to track NASDAQ, as of December 23rd, 2025. Source: Anton Golub
As 2025 draws to a close, Bitcoin faces macroeconomic uncertainty and technical weakness. Despite Fed easing, the correlation with global M2 liquidity has broken since the October crash. Chart patterns remain bearish, with Bitcoin trading below its declining 50‑day moving average. The next downside target lies near USD 70,000, which could present the first contrarian buying opportunity. Only a breakout above USD 95,000 would brighten the outlook and confirm a broader recovery.
The “December 23rd, 2025, Bitcoin – Crypto Winter Despite the Tokenization Boom” analysis is sponsored and initially published on December 23rd, 2025, by www.celticgold.eu. Translated into English and partially updated on December 23rd, 2025.
Join us in our free Telegram channel for daily charts, real time data and a great community. If you like to get regular updates on precious metals, commodities, and bitcoin, subscribe to our free newsletter.
Disclosure:
This article and the content are for informational purposes only and do not contain investment advice or recommendations. Every investment and trading move involves risk, and readers should conduct their own research when making a decision. The views, thoughts, and opinions expressed here are the author’s alone. They do not necessarily reflect or represent the views and opinions of Midas Touch Consulting.

