


Nobody knows the future – but …
we do know the past! As much as every moment is unique and we are continuously expanding towards an unforeseeable future, human behavior repeats itself to a certain extent. It is this behavior harnessed in technical analysis that supports our decision making process and allows for risk control.
In last weeks crypto chart-book we warned for risk being on the downside as much as we had short setups:
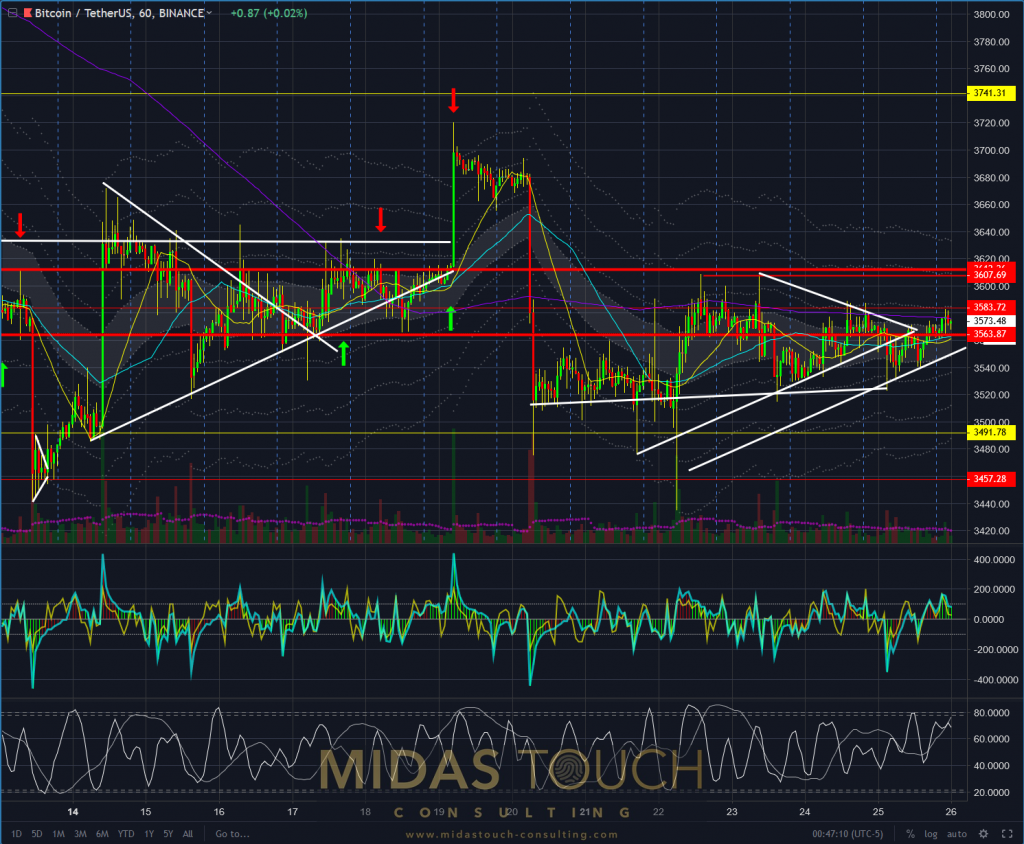
BTCUSDT hourly chart as of January 26th, 2019
Only an hour later after we posted our chart-book, we got the first scenario proving our hypothesis with a breakout to the upside:
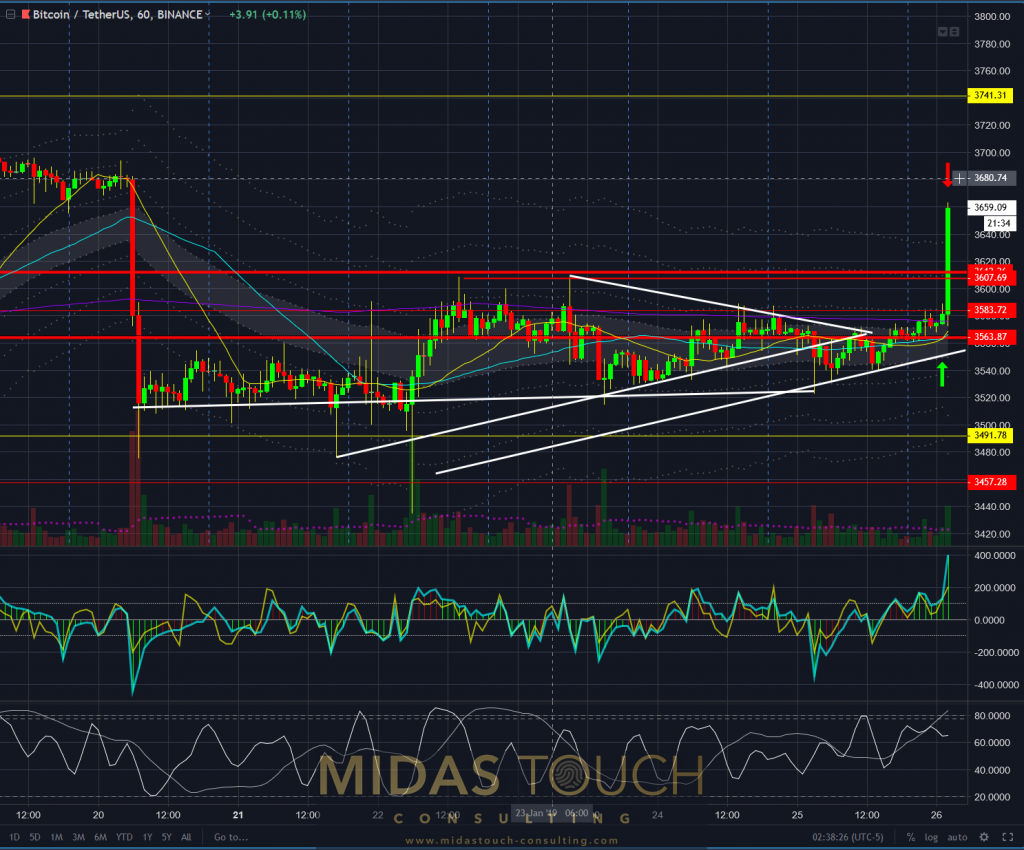
BTCUSDT hourly chart as of February 2nd, 2019
Within a day a second setup of a failed breakout to the downside (see red box with a hundred percent retracement), illustrates these risks again:
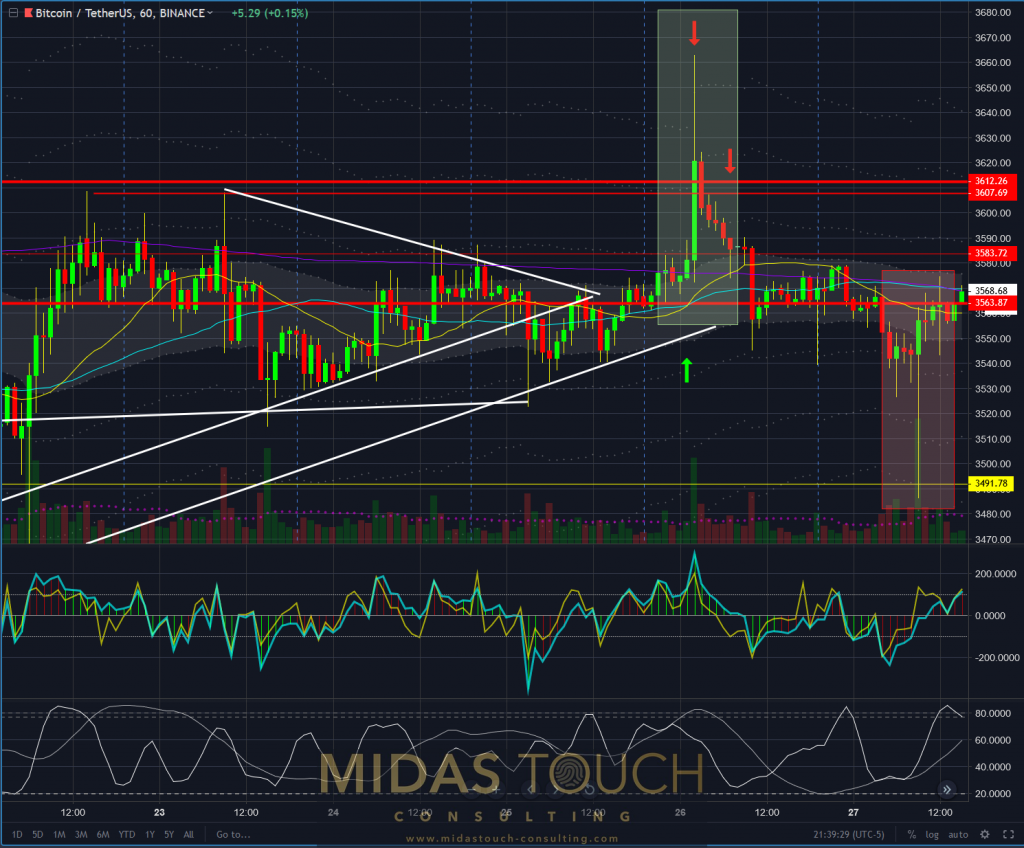
BTCUSDT hourly volatility chart as of February 2nd, 2019
Consistent returns are provided if you:
- stay out of harms way
- identify low risk opportunities
- be disciplined with your way of participating in the markets
This being said, the daily chart shows last weeks predictions to be true:
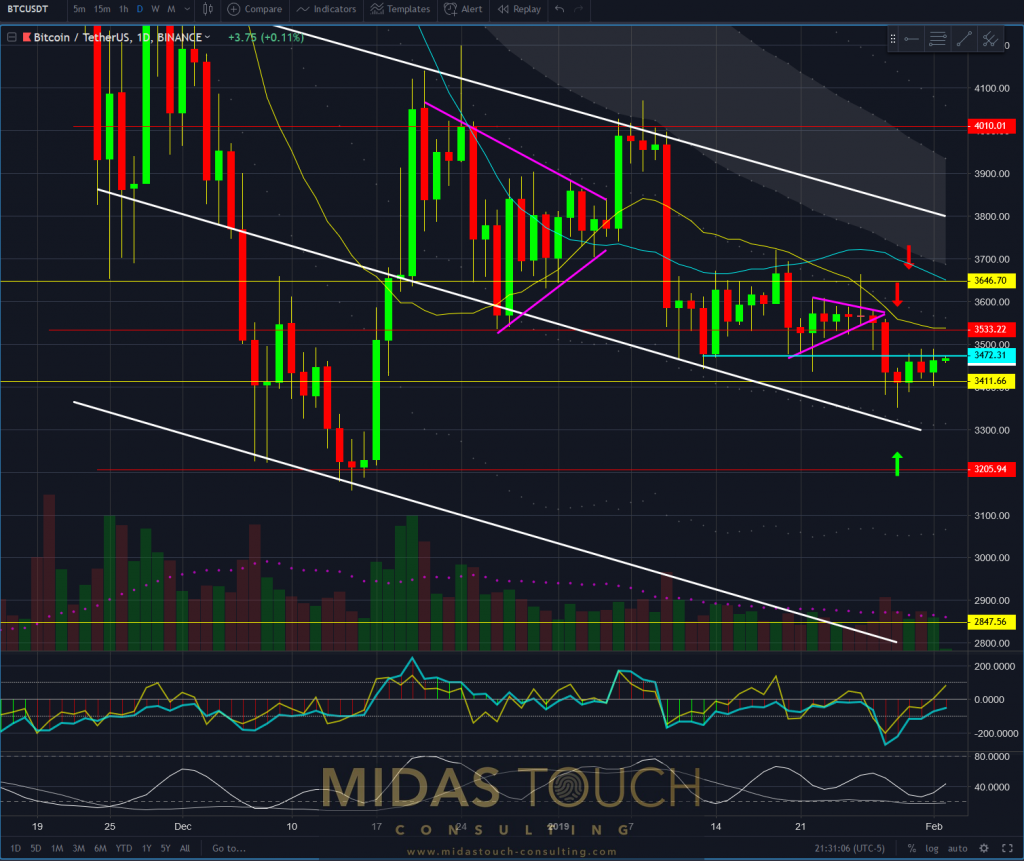
BTCUSDT daily chart as of February 2nd, 2019
As long as we stay in the upper bounds of the down sloping channel (white lines), risk will continue to be to the downside. The market is still going through its lager time frame sideways bottom building period for now.
We advise to temporarily pause participating in the markets should prices decline below the mid white line!
All charts timely posted in our telegram channel.

