


Precious Metals – Slap In The Face and Year-End Wake-Up Call
As 2025 draws to a volatile close, gold and silver once again take center stage – this time in a drama that blurs the line between market correction and geopolitical power play. What first appeared a jarring slap in the face for precious metals investors may, in fact, be the clearest wake‑up call yet about the shifting global balance underpinning today’s financial system. Precious Metals – Slap In The Face and Year-End Wake-Up Call.
1. Review – Silver’s Soaring Flight and Sudden Crash
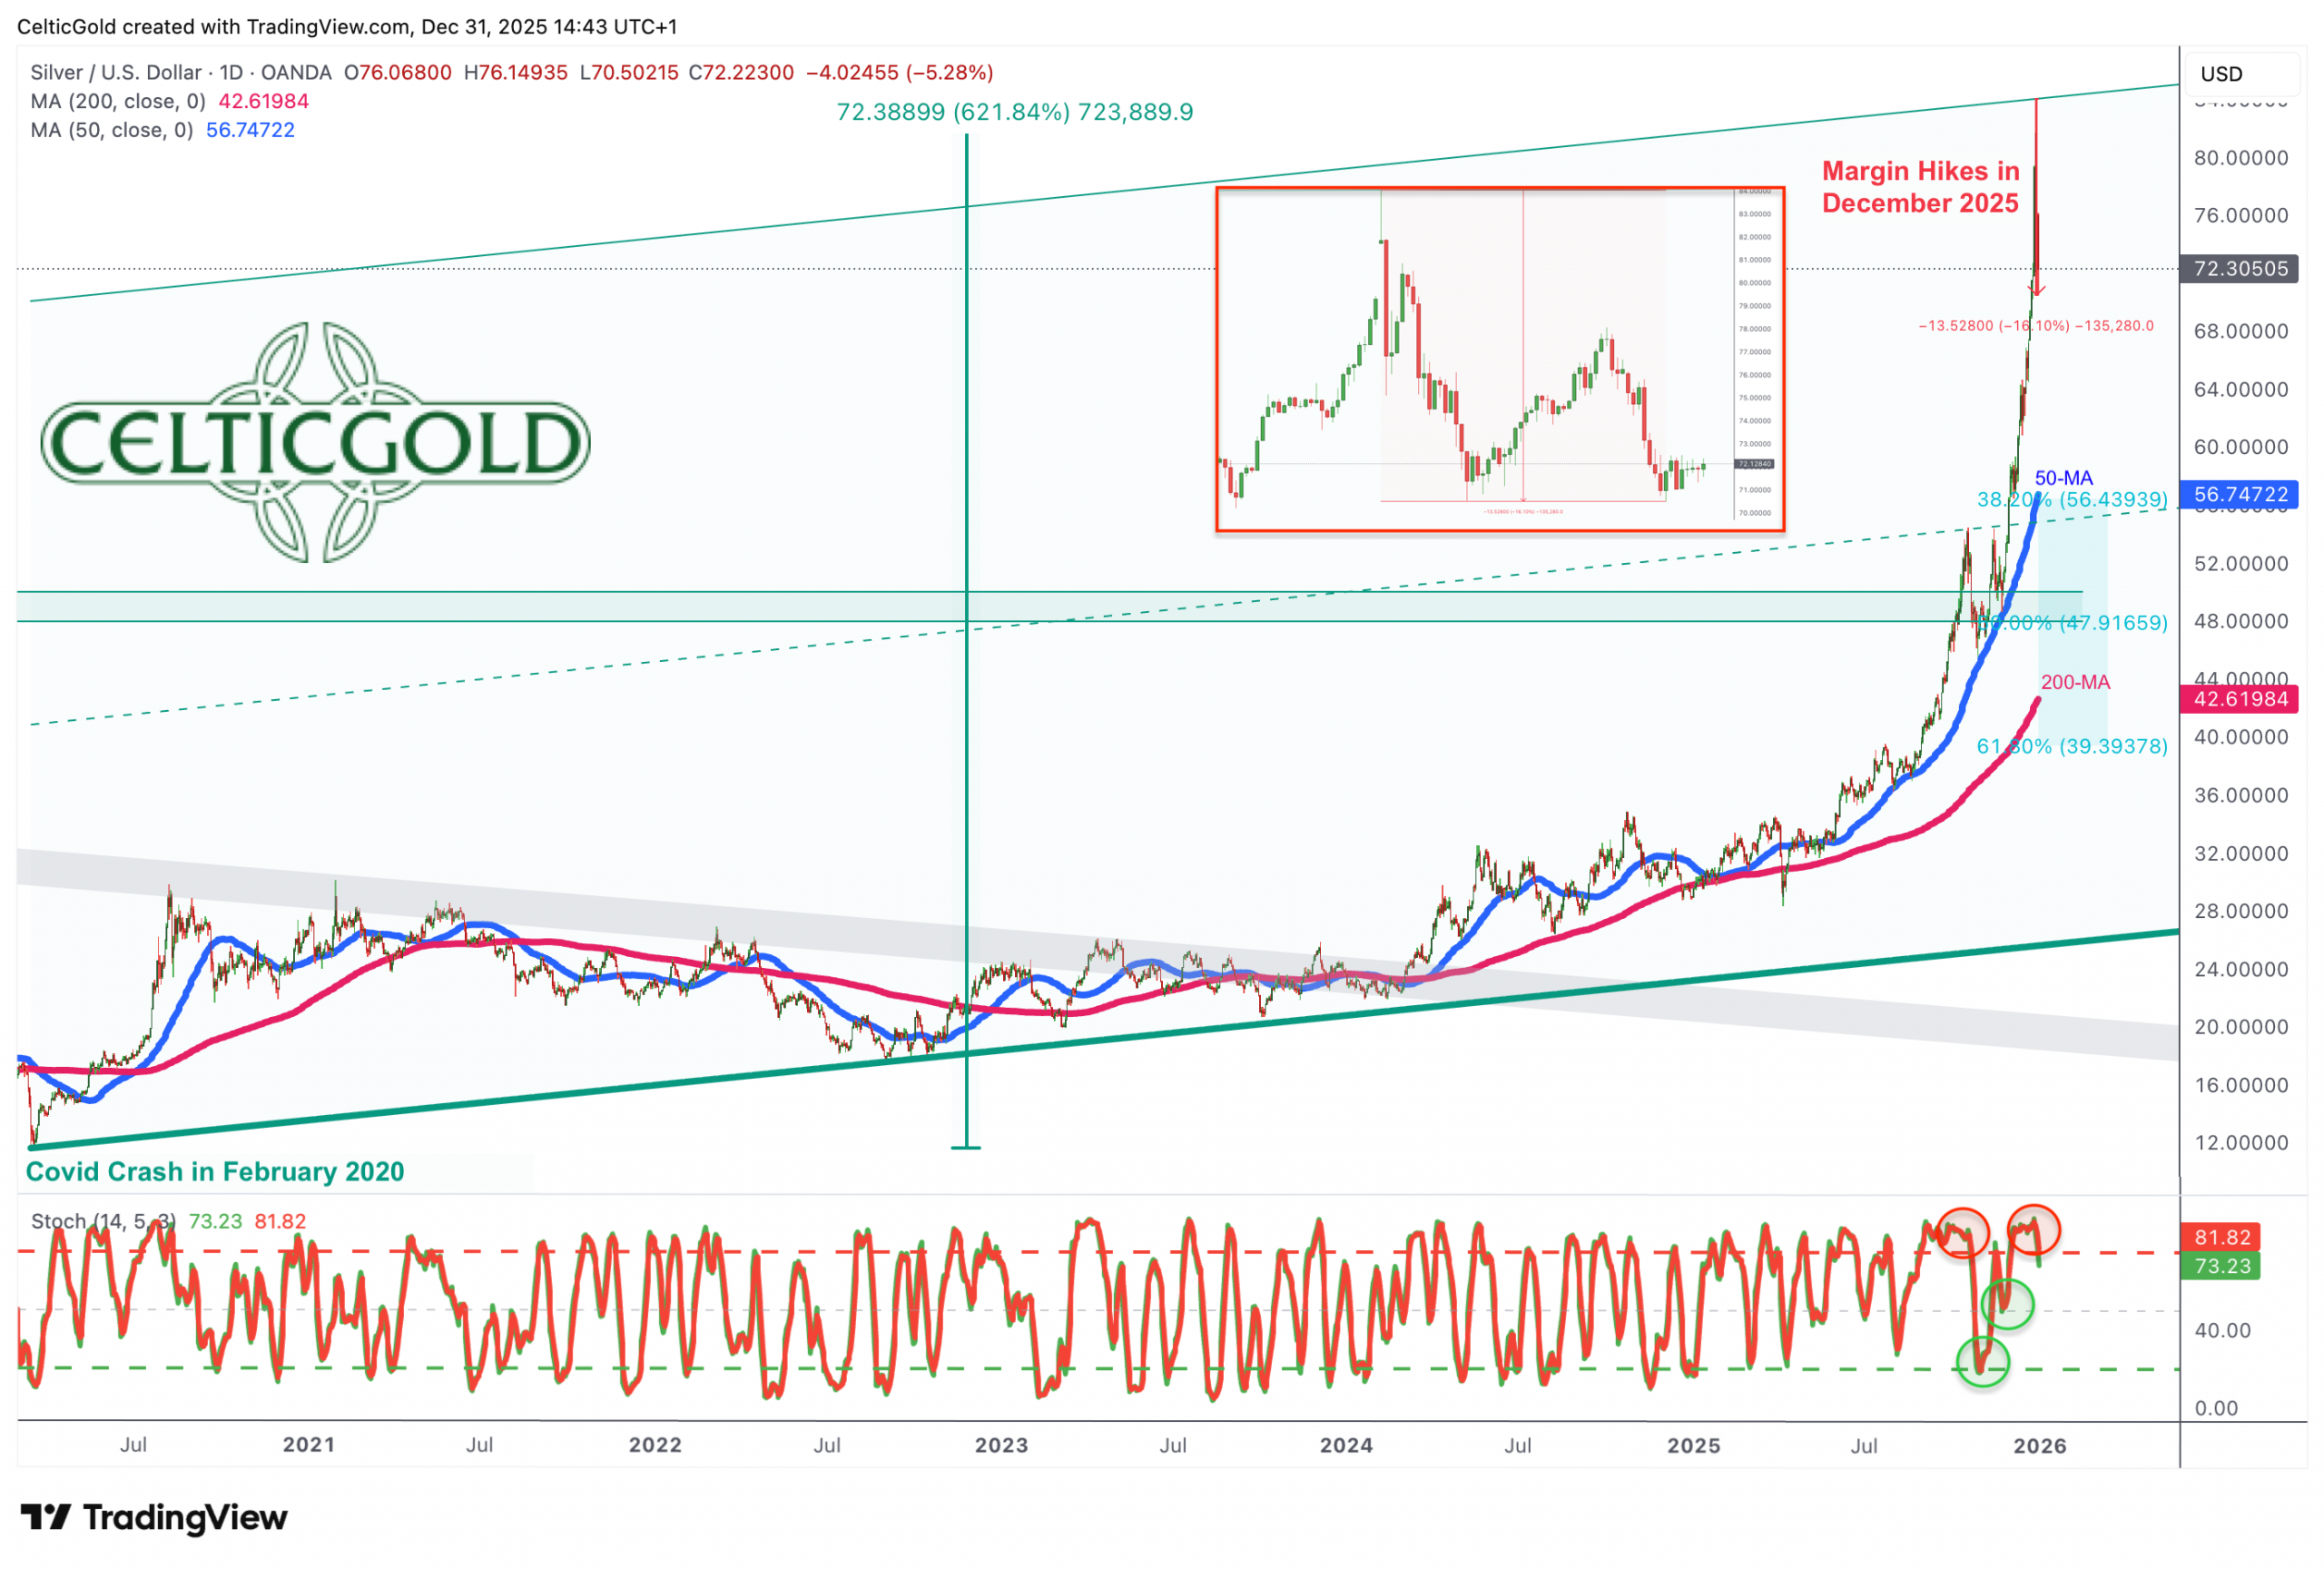
Silver in US-Dollar, daily chart as of December 31st, 2025. Source: Tradingview
The fourth quarter, and especially the final weeks of 2025, were dominated by silver, which massively outperformed not only gold but nearly all other asset classes. On Monday, December 29th, silver hit a new all-time high at USD 84.03 immediately after trading opened, only to crash later in the day by 16.07%, closing at USD 70.52.
This sharp pullback followed an astonishing rally in the preceding weeks: from the last significant low of USD 45.55 on October 28th, silver had surged +84.48% within just two months. Besides clear signs of overheating, profit-taking and increased margin requirements were the main catalysts behind this sudden & brutal drop.
China’s Intervention and a Geopolitical Turning Point
Behind the immediate volatility lies a deeper structural shift: China has upended the tightly balanced global silver market by imposing export license requirements for silver effective January 1st, 2026—a geopolitical maneuver with far-reaching implications.
By reclassifying silver as a strategic dual-use material, Beijing signals that silver is not merely an industrial commodity but also a resource of national security significance. This move strongly echoes China’s rare earth export strategy a decade ago, when similar restrictions strengthened domestic industries and increased global dependence.
A New Power Logic in Precious Metals
Since China dominates global silver refining, the new regulation grants it substantial leverage within the supply chain—particularly given surging demand from solar energy, electric vehicles, semiconductors, and defense technologies.
These dynamics are already reflected in market prices: the premium between physical silver in Shanghai and paper contracts on COMEX recently widened to around USD 6 per ounce, a clear sign of physical scarcity.
Gold, by contrast, has been more restrained in recent weeks, largely mirroring silver’s trajectory. Nonetheless, it too reached a new all-time high of USD 4,550 on Christmas Day, before tumbling sharply at the start of this week. The low at USD 4,302 (-5.41%) has since been followed by a rapid rebound of more than USD 100, then a failure at USD 4,404, another sharp sell-off down to a new low at USD 4,274, followed by a another bounce back to USD 4,402 followed by yet another deep sell-off to USD 4,315.
Overall, the final weeks of 2025 have thus exposed a clear division between paper and physical precious metals markets and underscored once again the geopolitical significance of metals and raw materials. The silver boom represents far more than speculative excess—it reflects the new power logic of a multipolar global economy, where control over gold represents trust and control over silver represents influence. The coming months will reveal whether China’s move proves a temporary disruption or the start of a structural revaluation of one of today’s most vital industrial metals.
2. Chart Analysis – Gold in US Dollars
Weekly Chart: Bearish Reversal Pattern Forming?
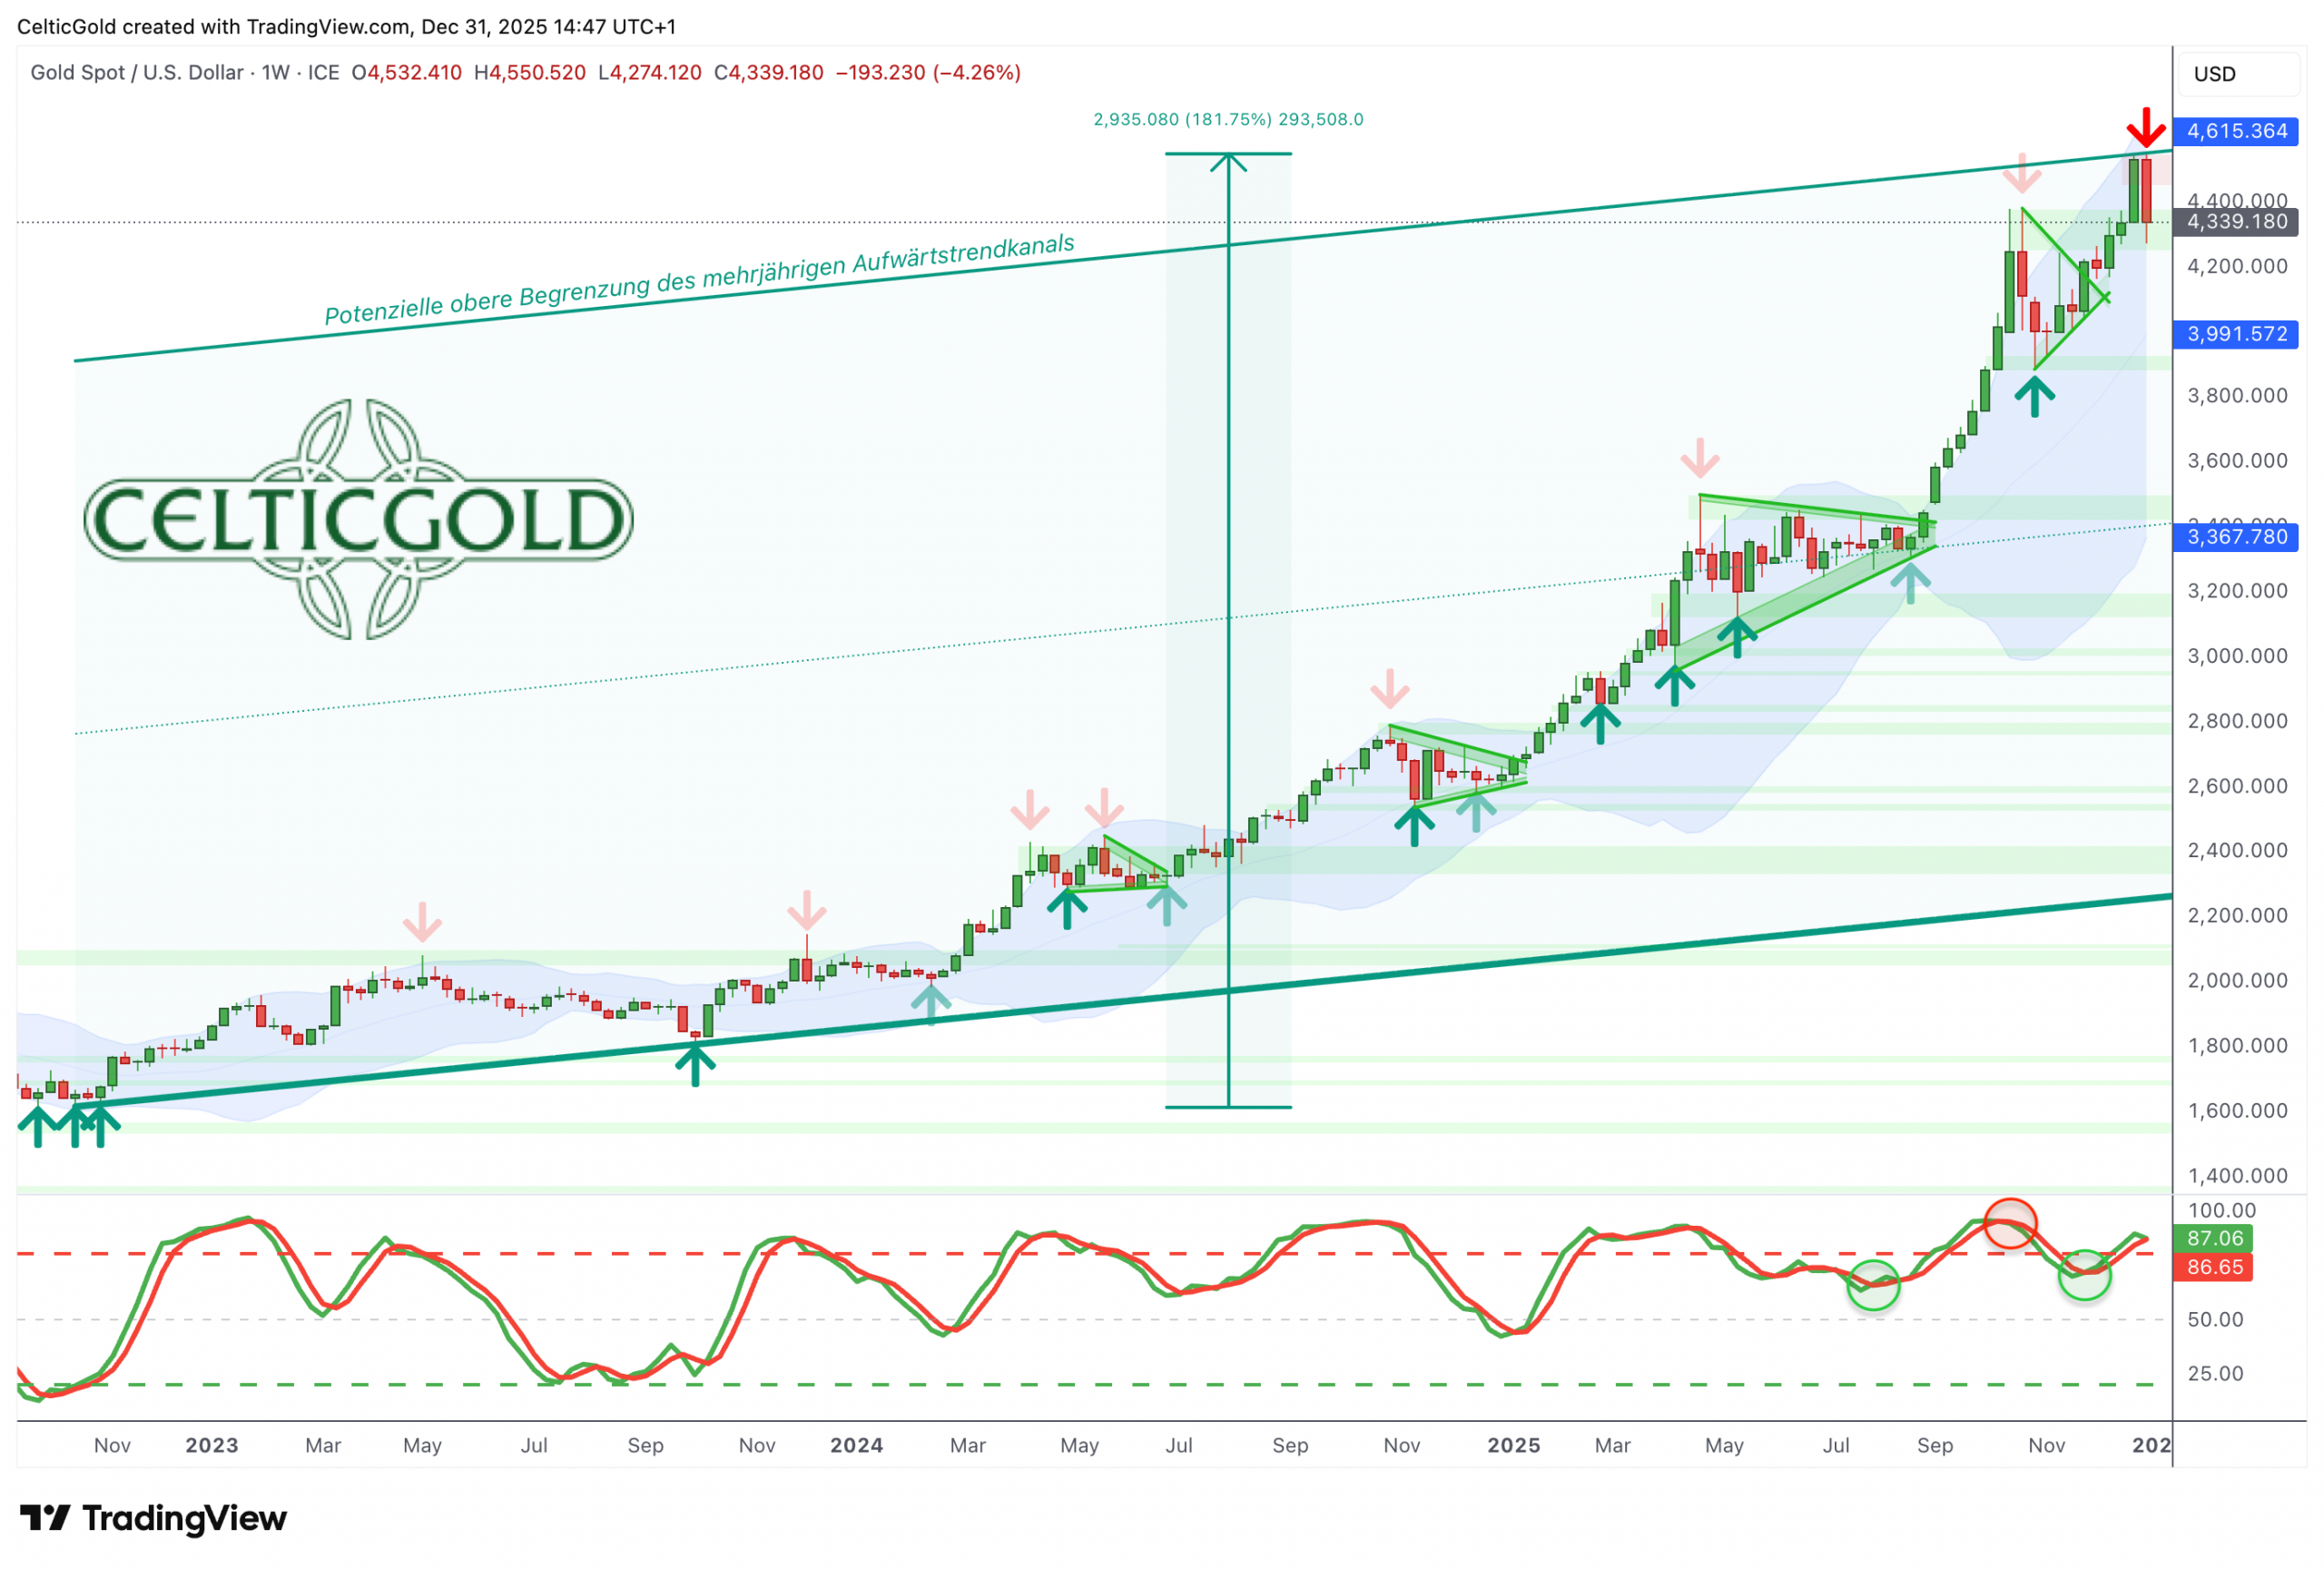
Gold in US-Dollar, weekly chart as of December 31st, 2025. Source: Tradingview
Since the prominent triple bottom at USD 1,615 in the fall of 2022, the weekly chart has essentially known only one direction: up. While multi-week and even multi-month consolidation phases occurred retrospectively, the net result is a spectacular rise of nearly 300% over just over three years.
From the new all-time high of USD 4,550, combined with the sharp pullback since Monday morning, a bearish engulfing pattern is emerging for the first time in this phenomenal uptrend. This two-candle reversal pattern forms when the body of the second (red) candle completely engulfs the prior green candle’s body, signaling a potential end to the uptrend. It typically appears after prolonged advances, indicating buyers are losing momentum while sellers gain strength. If bulls fail to improve the picture by Friday’s weekly close, the odds of a downside reversal rise sharply.
In the worst case, the entire advance from USD 1,615 to USD 4,550 could be corrected, with potential targets around USD 3,500. This area aligns with the middle trendline of the overarching uptrend channel and the lower Bollinger Band (currently USD 3,369). Gold consolidated here for about four months earlier this year.
Given silver’s steep recent advance, a pronounced interim high in precious metals would not surprise. However, gold’s weekly stochastic has not yet turned down, so—as in the past 21 months—a high-level consolidation remains possible. In this best-case scenario, the low from the “cold shower” likely finds support between USD 4,120 and USD 4,200.
Overall, the weekly chart remains bullish for now. The potential candle reversal pattern should be confirmed or negated by Friday evening, setting the course for the coming months. If confirmed, the explosive rally – peaking in excessive euphoria and significant margin increases – may pause for a well-deserved breather.
Daily Chart: Rising 50-Day Moving Average as Logical Target
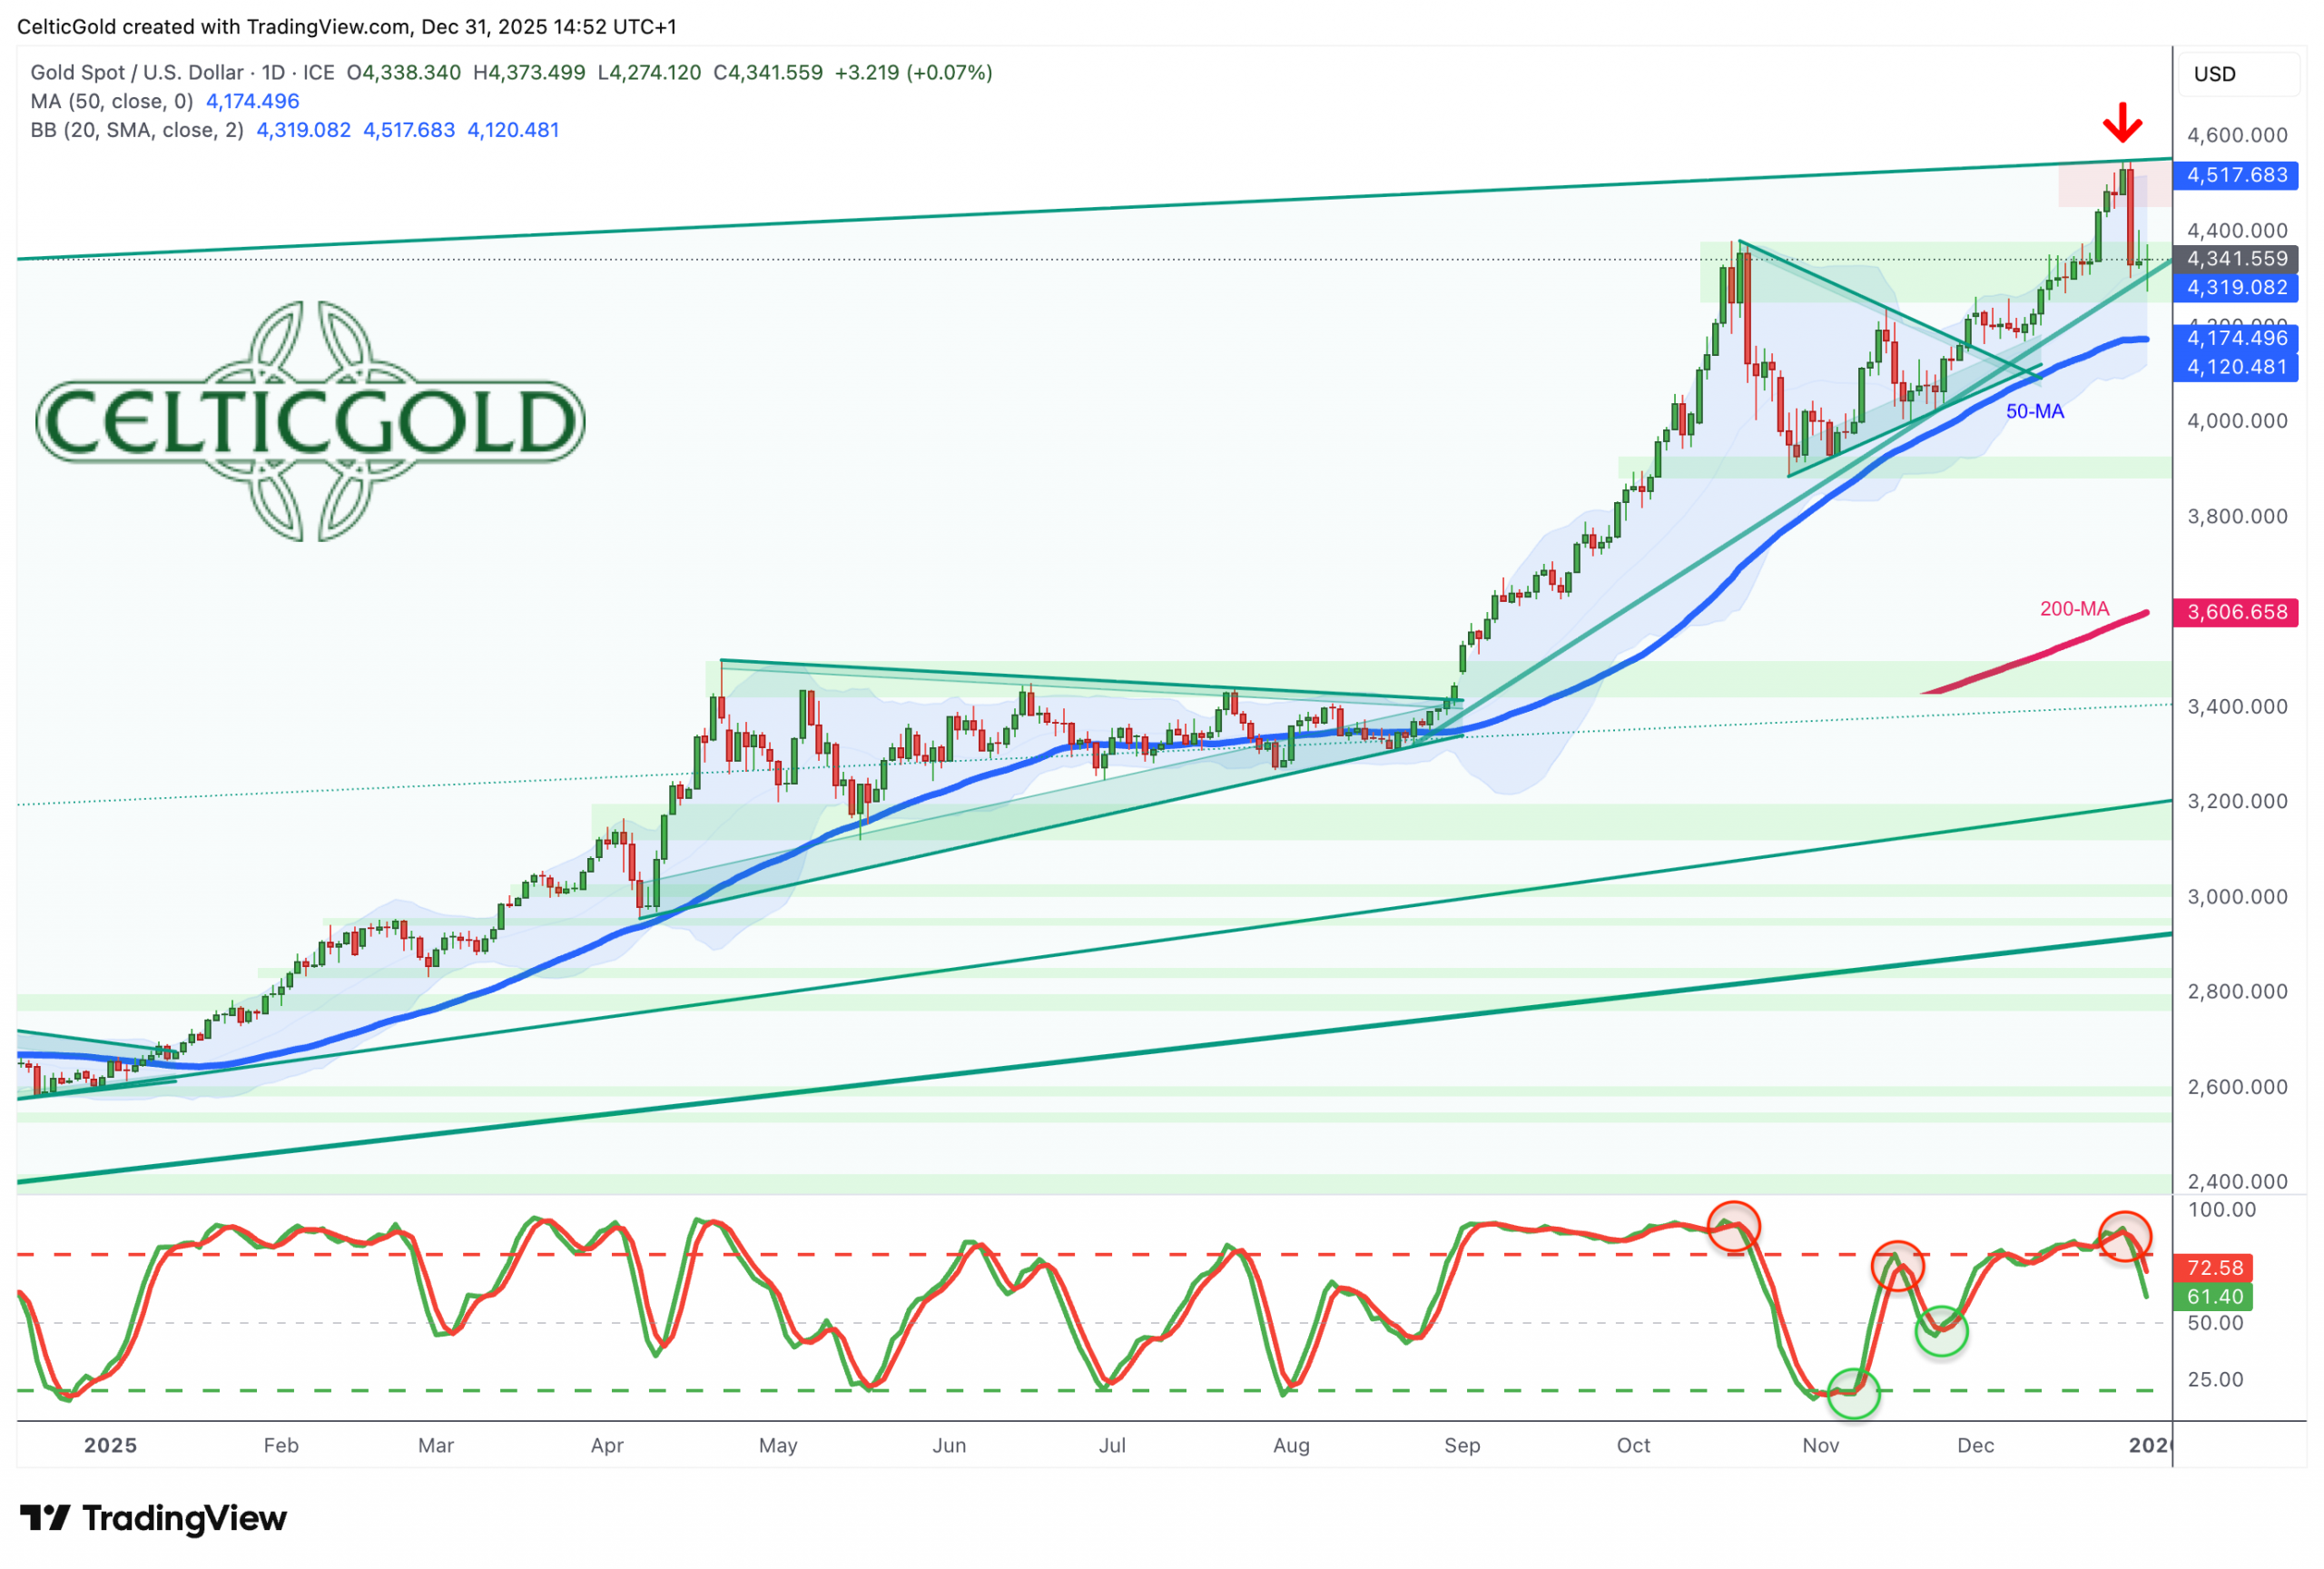
Gold in US-Dollar, daily chart as of December 31st, 2025. Source: Tradingview
On the daily chart, gold rose from USD 3,386 to USD 4,550 in two months after the sharp late-October pullback—a gain of about USD 665 or +17%. Compared to silver’s explosive +84.85% rally, this advance appeared modest, consistent yet somewhat fatigued.
The sharp pullback since Monday night has ended the two-month uptrend. The slide may not be over, as the daily stochastic has just triggered a sell signal, with lots of room still to reach oversold territory.
The rising 50-day moving average at USD 4,175—which has caught every pullback since spring 2024—serves as the logical target this time too. Combined with the daily lower Bollinger Band (USD 4,120) and a downtrend line from the October high, a retreat to USD 4,150–4,175 would surprise no one.
In summary, the daily chart is bearish. USD 4,400 is acting as strong resistance. Next support lies around USD 4,320. Below that, the path clears to the 50-day moving average (USD 4,175) and the lower Bollinger Band (USD 4,120). Upside requires reclaiming USD 4,410, ideally USD 4,450, to flip the battered picture.
3. Commitments of Traders for Gold
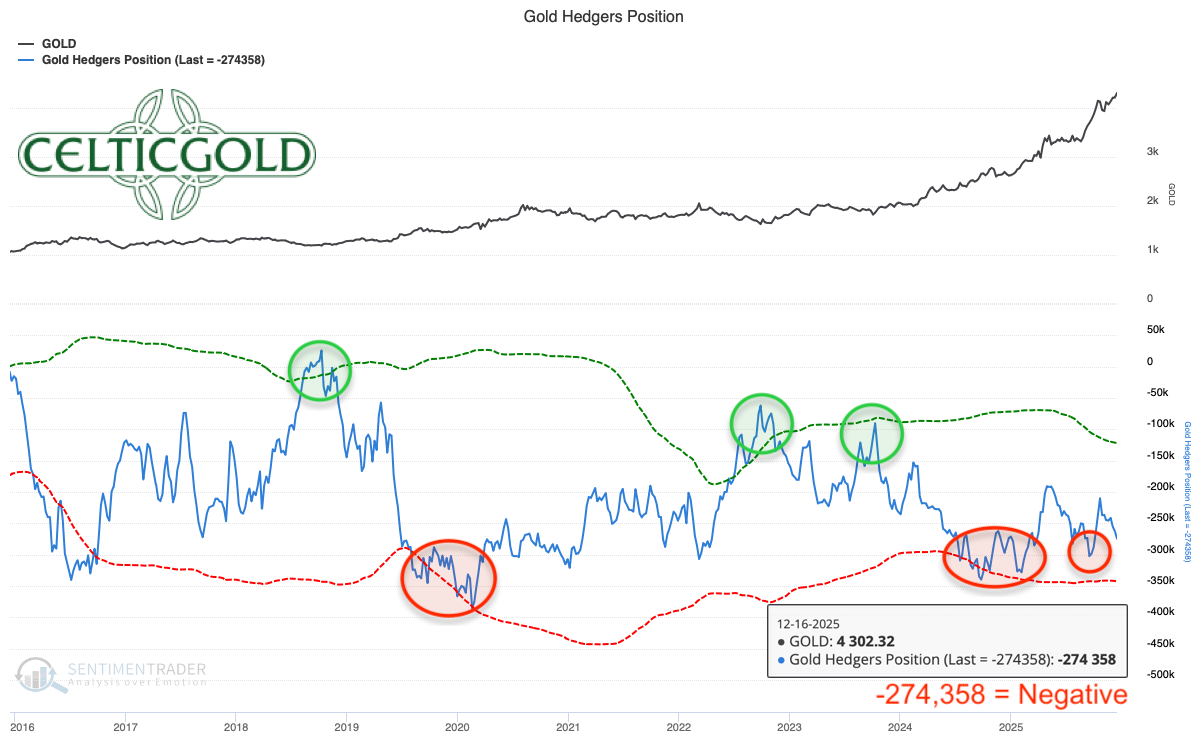
Commitments of Traders Report for gold futures as of December 16th, 2025. Source: Sentimenttrader
Publication of Commitments of Traders (COT) data was interrupted by the US government shutdown from October 1 to November 12, 2025. Data was submitted piecemeal afterward, preventing coherent current analysis. The CFTC plans to resume normal weekly releases in January 2026, meaning complete, up-to-date COT data for gold will only be available then.
Current data from December 16th shows commercials holding a cumulative short position of 274,358 gold futures contracts at a closing price around USD 4,302. This commercial short position is high historically and acts as a warning signal.
However, the Anglo-Saxon futures and paper gold market has lost pricing power in recent years due to strong physical demand from Asia, especially China. Recent drastic margin hikes likely triggered the selloff. COMEX announced these gold futures margin increases end-December 2025, effective December 29: CME Group raised initial margins to USD 22,000 (maintenance) and USD 24,200 (for HRP/spec) per contract (COMEX 100 oz, GC), citing heightened volatility and price surges. This demands extra liquidity from traders.
Overall, the COT report rates negatively based on the last 22 years.
4. Sentiment for Gold – Will a cold shower be enough?
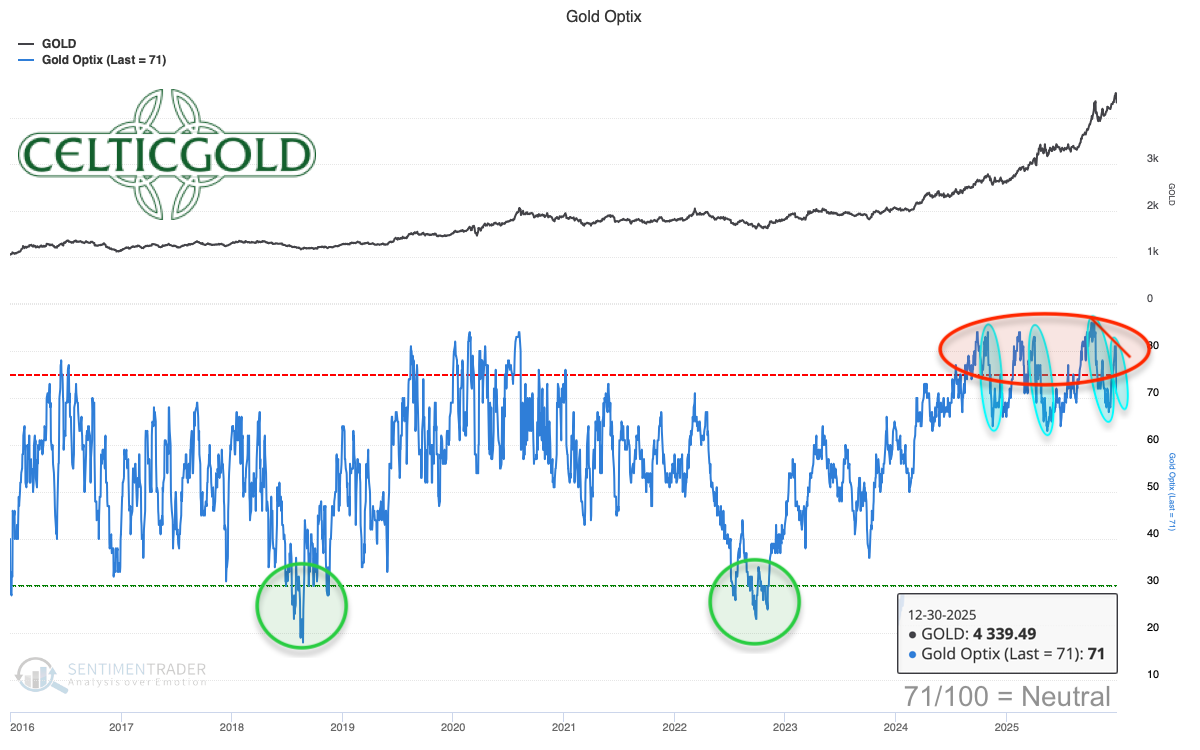
Sentiment Optix for gold as of December 30th, 2025. Source: Sentimentrader
The sharp pullback since week-start has cooled overheated sentiment again, dropping Optix to 71. The latest sentiment peak was less euphoric than October 21’s. Thus, it’s unclear if this “cold shower” suffices or if deeper sentiment cleansing precedes the next leg up.
Sentiment has retreated to neutral, but the cold shower lingers. Ideally, Optix turns around above 55. Otherwise, odds rise for an extended correction.
5. Seasonality for Gold – Green lights into spring
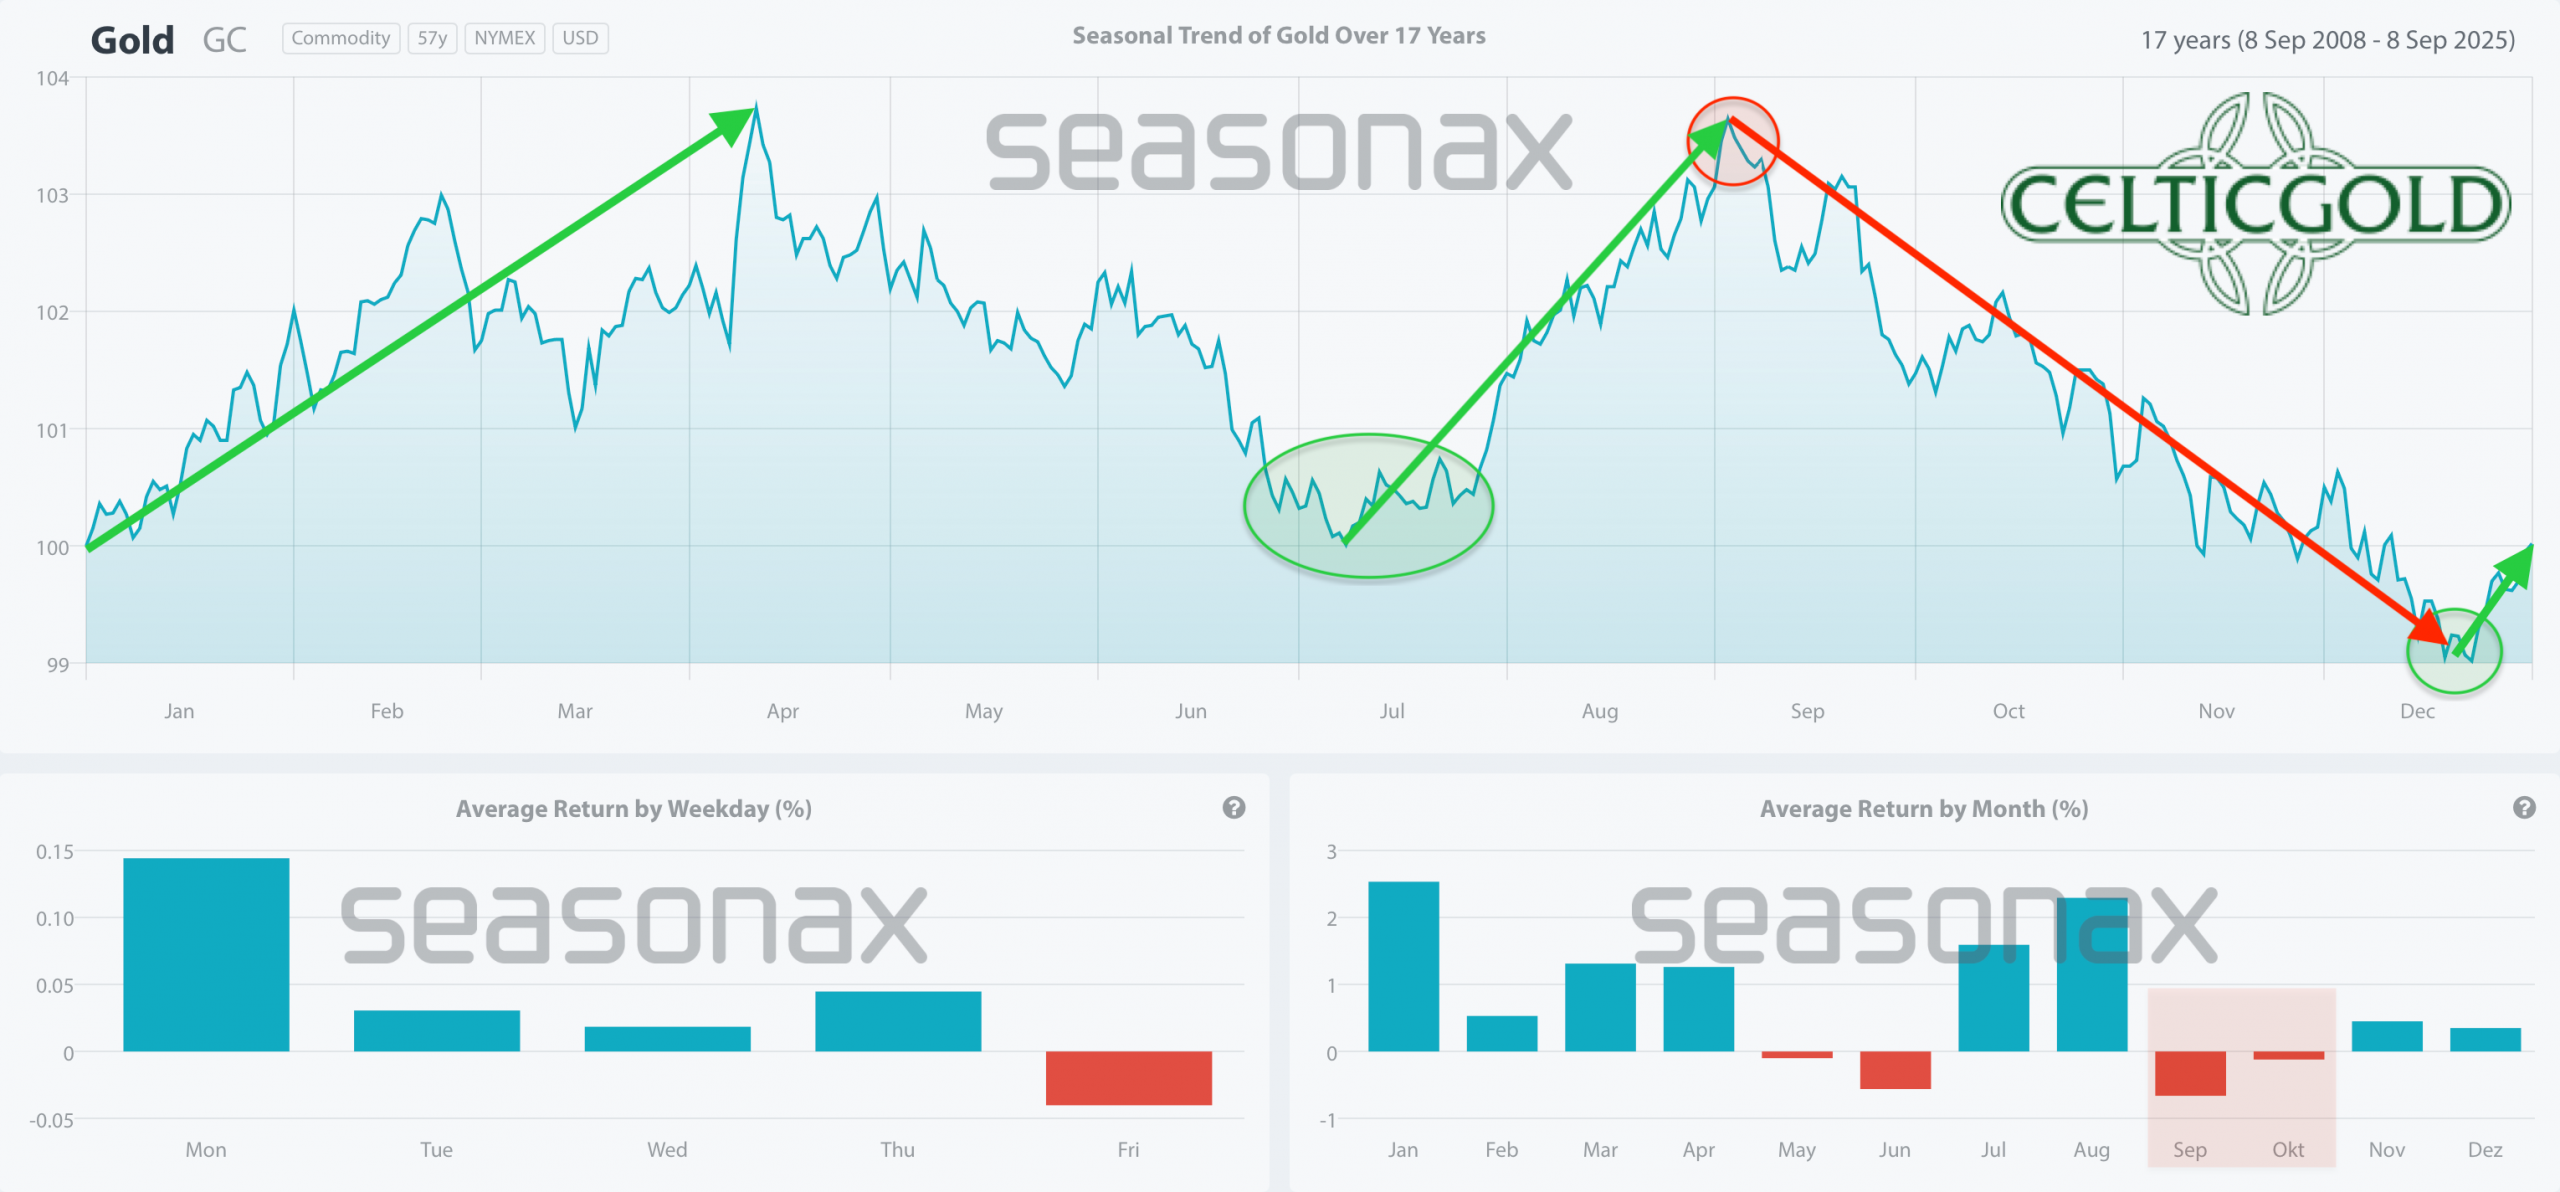 Seasonality for gold over the last 17-years as of September 8th, 2025. Source: Seasonax
Gold surged sharply from mid-December, hitting the targeted seasonal turn precisely! Alongside silver’s explosion, precious metals overshot briefly. Seasonality still signals green into spring.
Chinese New Year 2026 (Spring Festival) from February 17 could draw massive gift-buying. Yet, January may atypically weaken due to the pullback, before February’s seasonal gains resume.
Overall, the seasonal light stays green at least through March.
6. Macro Update – Silver as Industrial Hegemon, Gold as Reserve Anchor
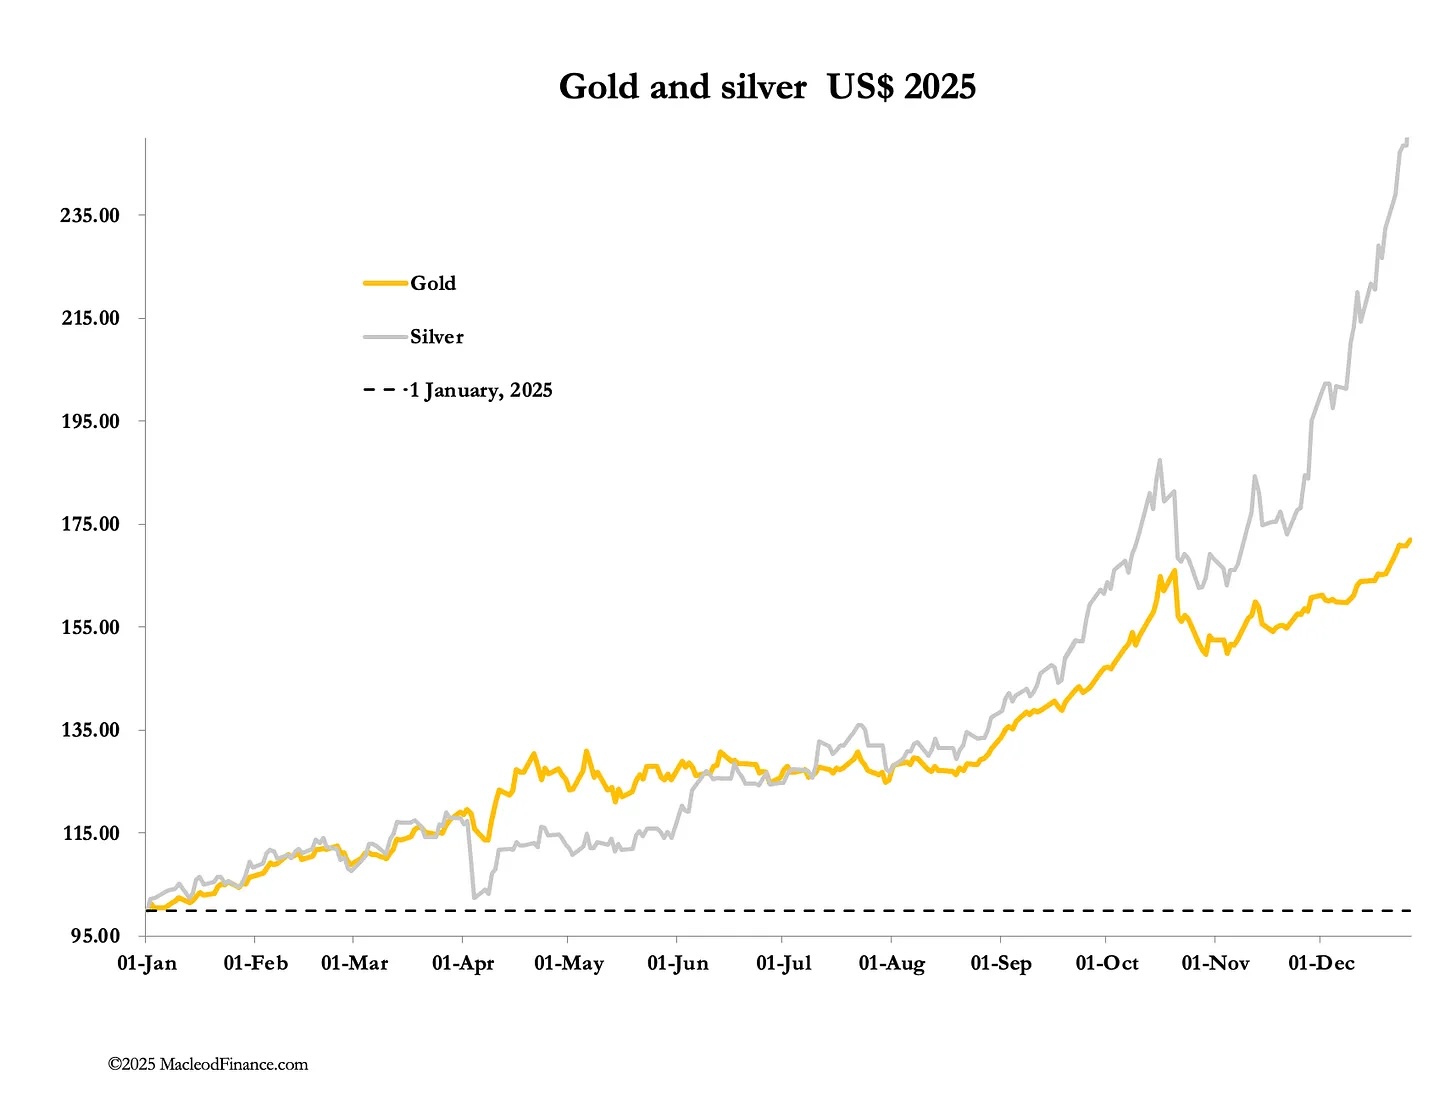
Gold and silver in US dollars in 2025, as of December 26, 2025. Source: Alasdair MacLeod
After a sensational rally, precious metals end 2025 with extreme volatility. The year featured new all-time highs in gold, silver, and platinum, but the final days’ sharp correction leaves a bitter aftertaste.
Silver hit USD 84.03 on December 29th before crashing over -16% to USD 70.52. Gold fell from USD 4,550 to USD 4,274.
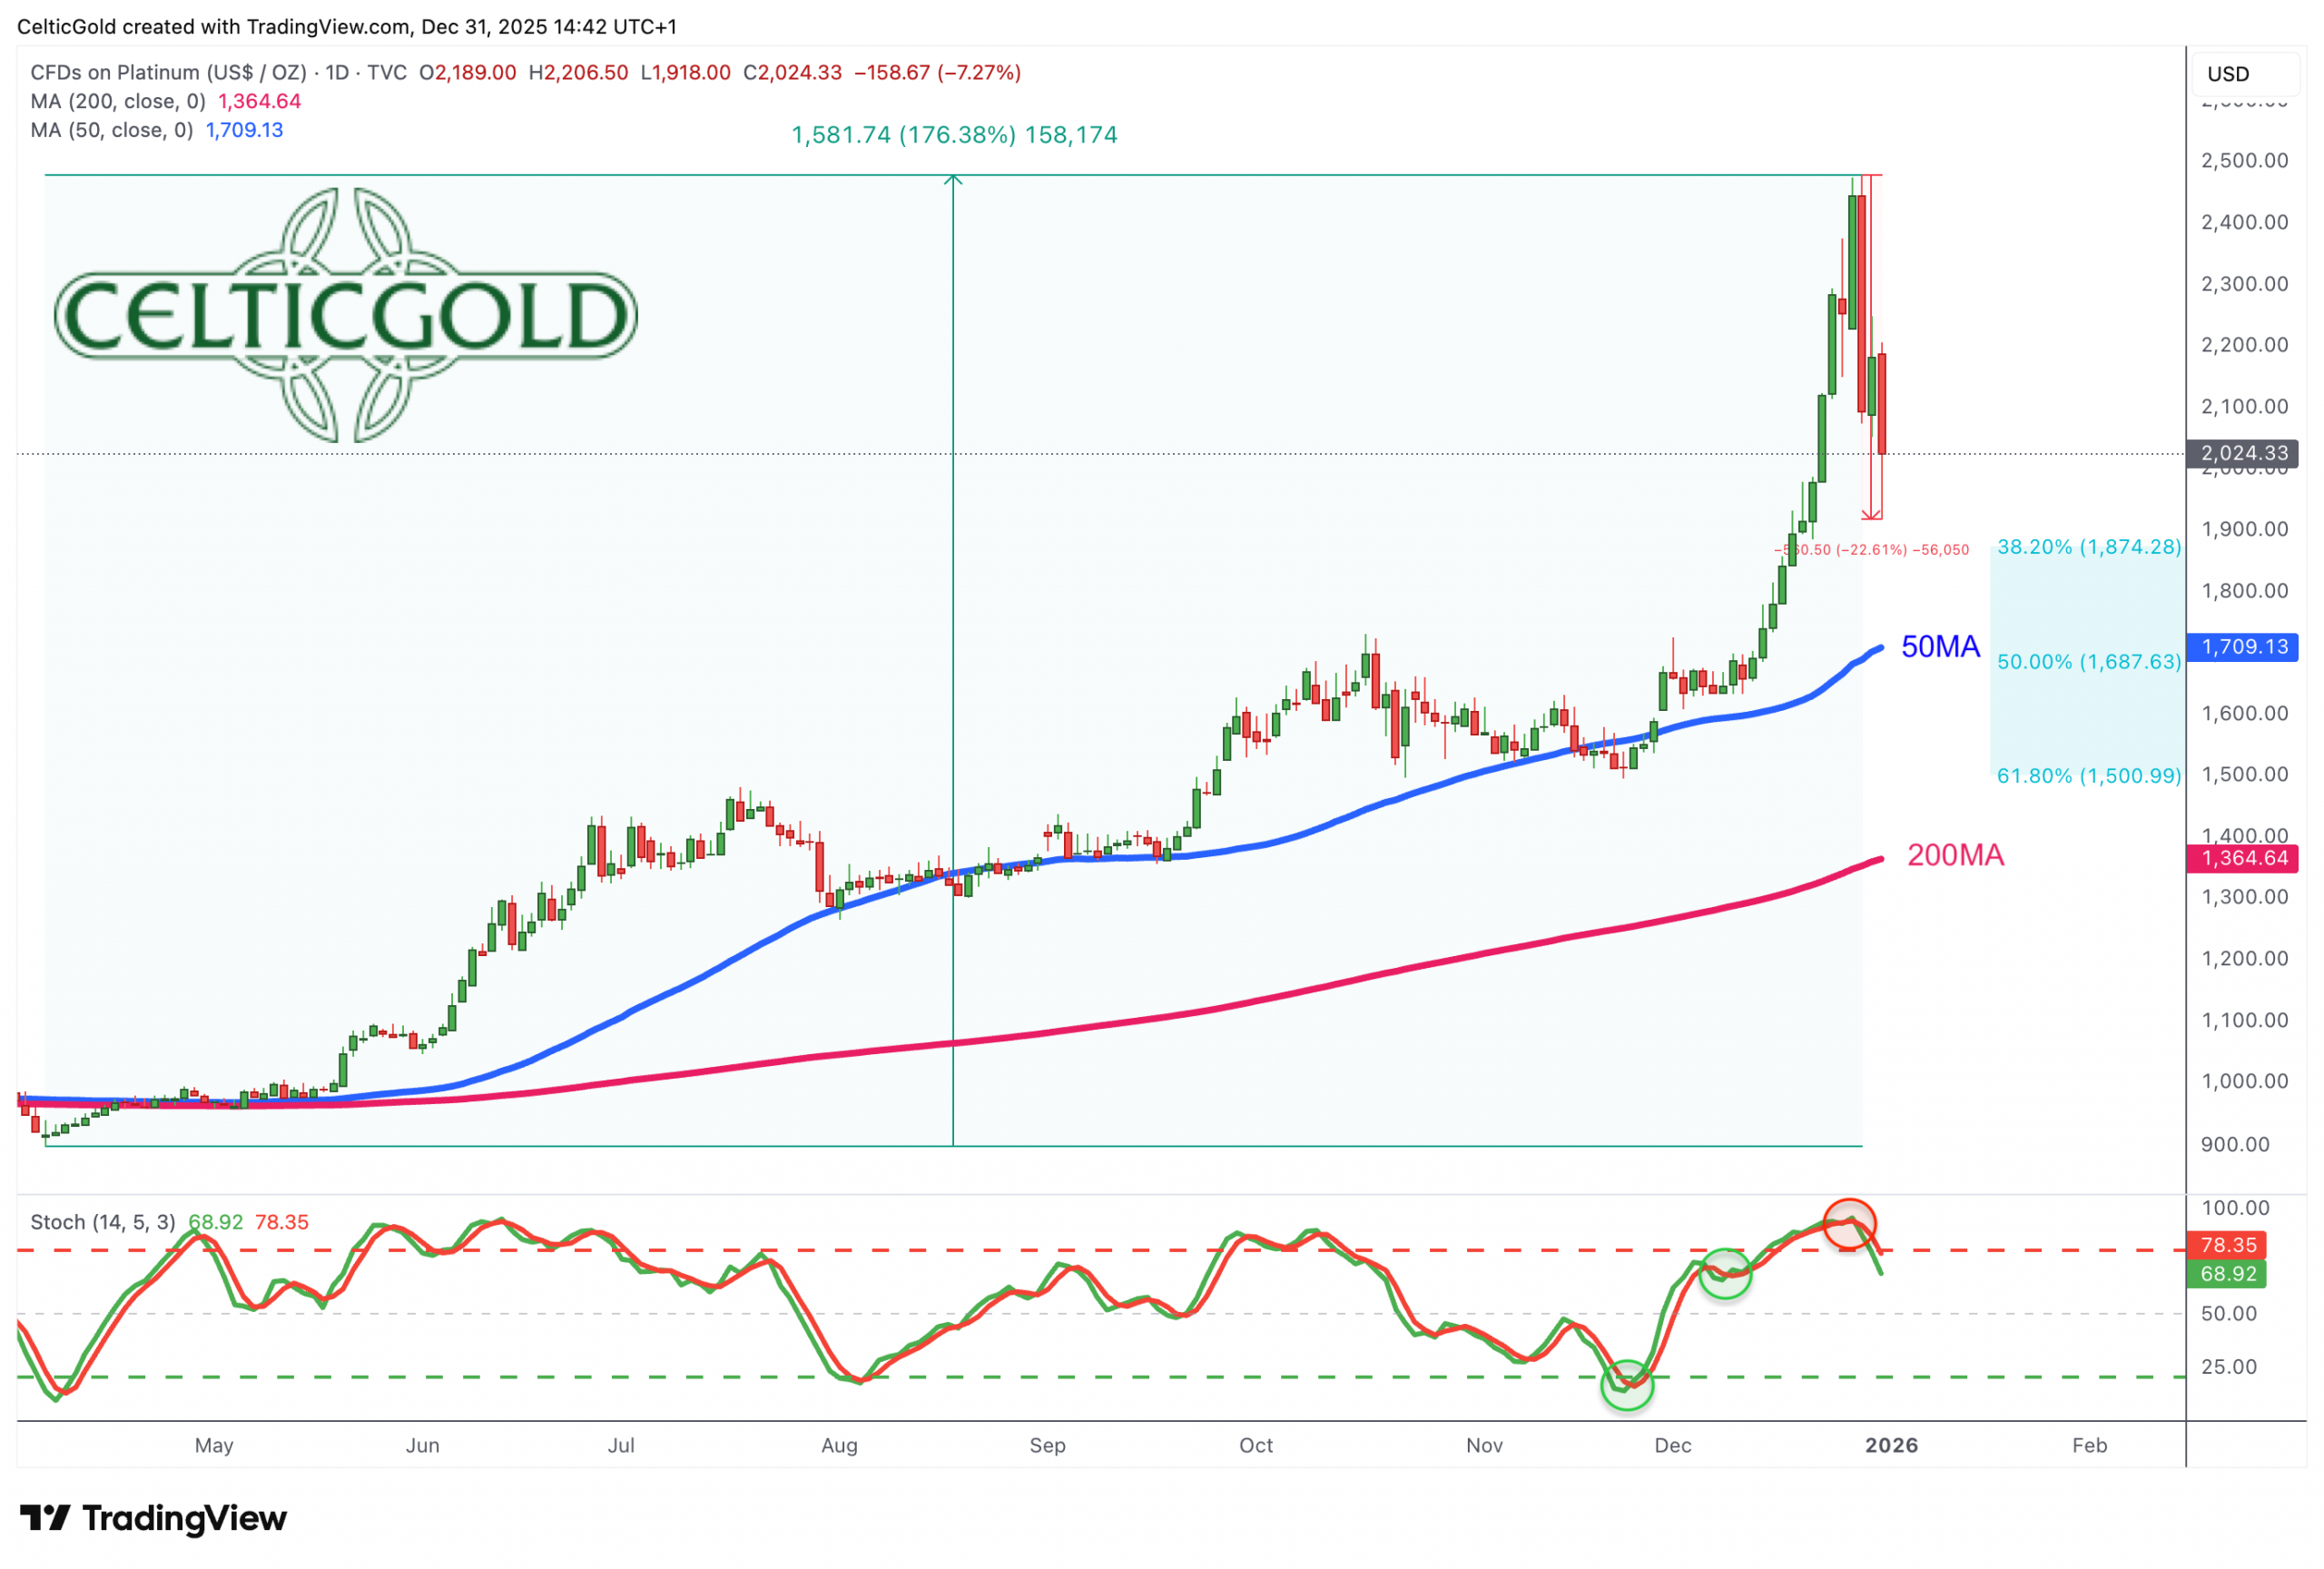
Platinum in US dollars, daily chart as of December 31, 2025. Source: Tradingview
Platinum suffered hardest, plunging over -25% from USD 2,525 to USD 1,891. These moves reveal the chasm between COMEX paper prices in New York and physical markets in the Middle East and Asia.
Margin Hikes – Echo of the Hunt Brothers Era
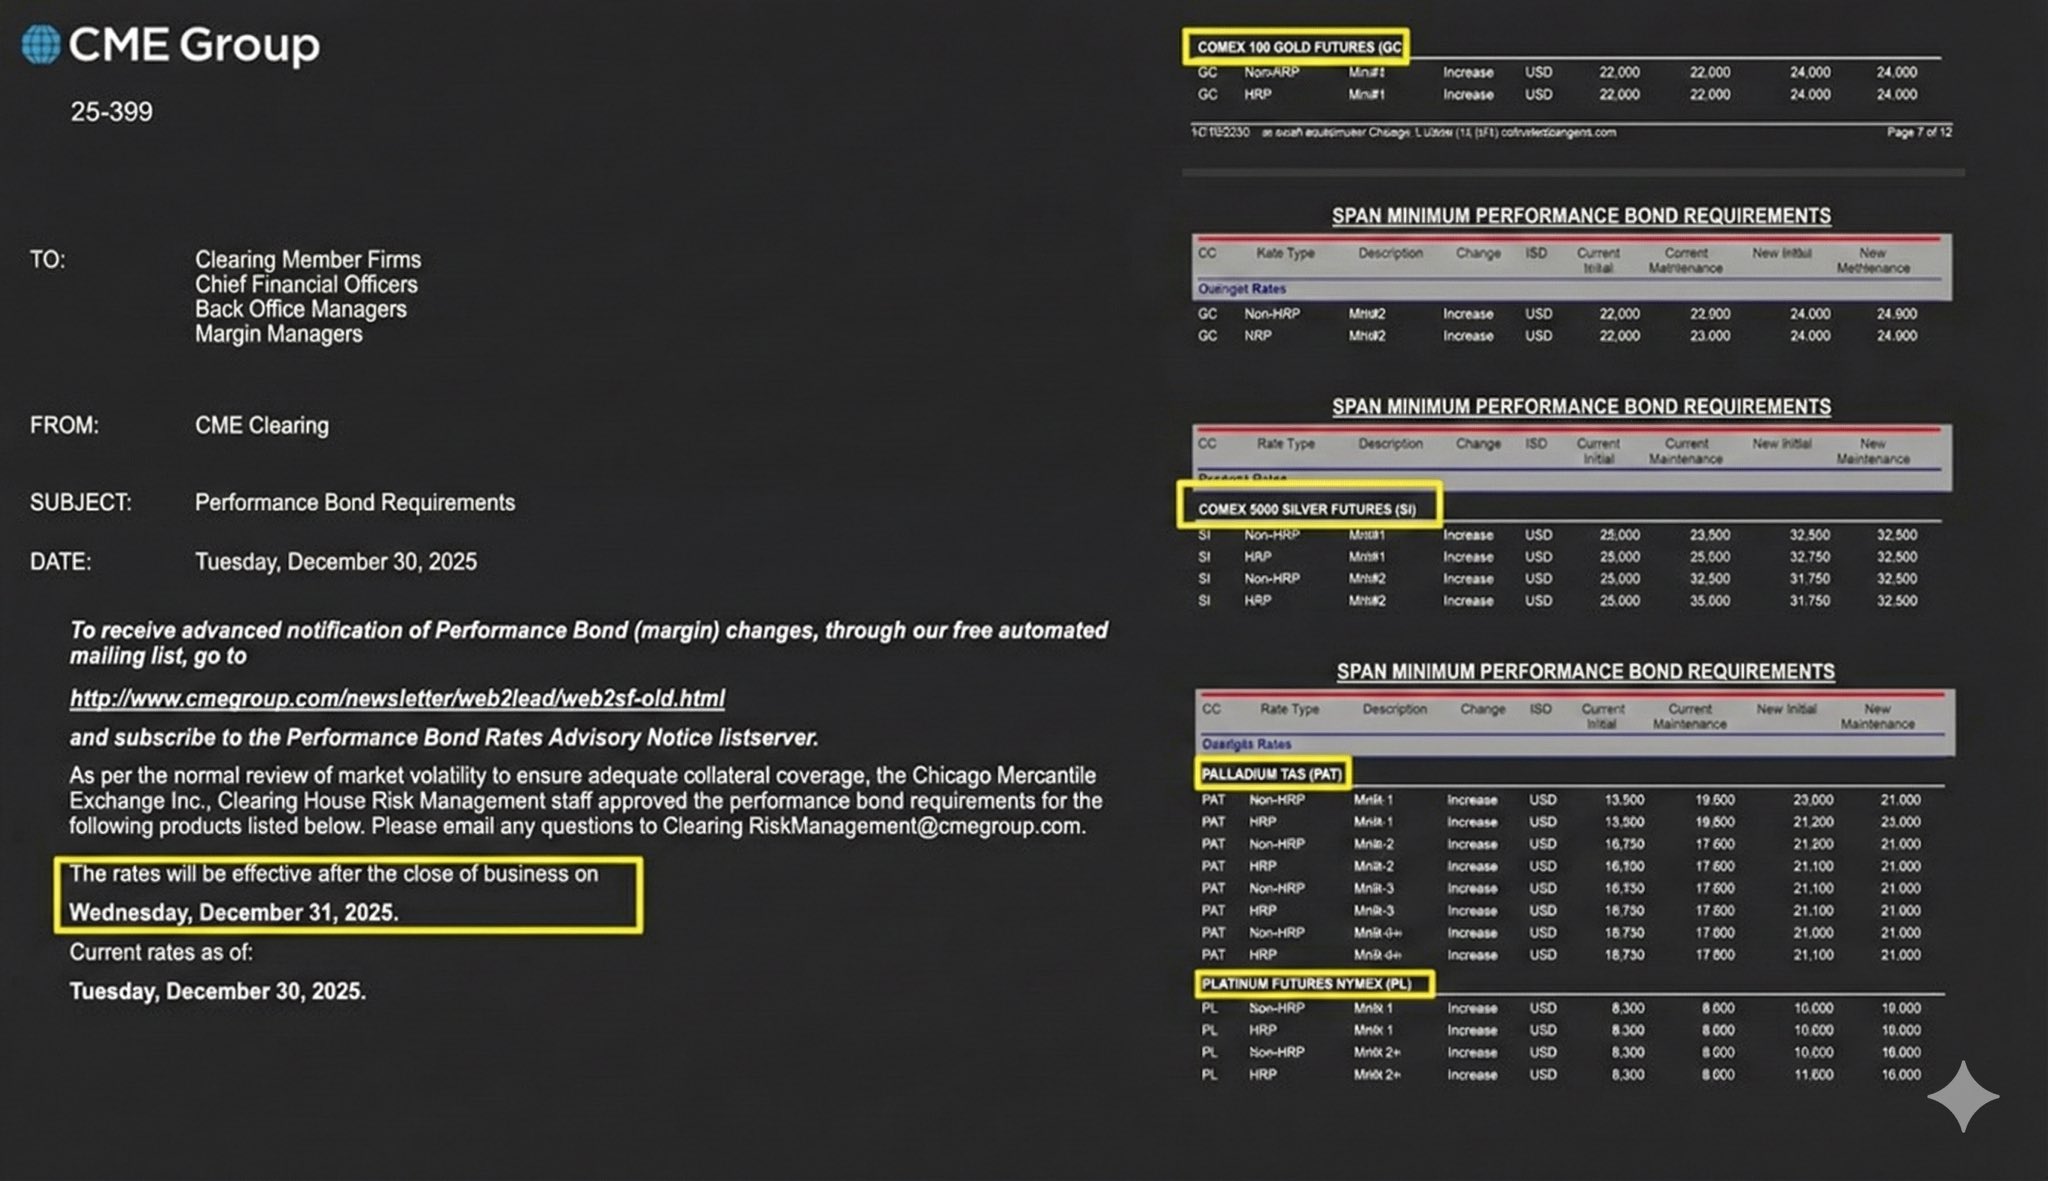
CME Group margin increases, as of December 30, 2025. Source: NoLimits
Unsurprisingly, CME Group—the world’s largest derivatives exchange operator—aggressively hiked COMEX margins by December 31st. Maintenance margin for silver rose 30% to USD 32,500, followed by platinum (+25%) and palladium (+22%). This second hike in a week aims at profit-taking and forced liquidations to brake or break upward momentum, protecting Western banks’ “naked shorts.”
This echoes COMEX’s January 1980 emergency measures against the Hunt brothers’ silver speculation. Nelson Bunker Hunt and William Herbert Hunt amassed physical silver and futures (up to 69% of COMEX open interest), driving prices from under USD 2 (1973) to around USD 50 (1980).
Silver Rule 7: Lessons from 1980
On January 7th, 1980, COMEX introduced “Silver Rule 7” to end this speculation, imposing strict margin-buy limits, position caps at 3 million ounces per trader, and later “liquidation only” trading—no new longs. This forced offsets against shorts, halting buys, triggering a crash culminating in “Silver Thursday” on March 27, 1980 (prices fell >50% to USD 10). The Hunt brothers missed margin calls, lost billions and filed bankruptcy. It spurred reforms like stricter limits and CFTC oversight.
China’s Silver Export Halt: Geopolitical Game-Changer
Unlike that, China’s silver export curbs from January 1st, 2026, mark a geopolitical pivot likely outweighing COMEX efforts. As top refiner, Beijing controls solar, EV, and semiconductor chains, intensifying physical shortages and fostering backwardation between London spot and COMEX futures. The West has lost control; pricing has shifted to Dubai, Shanghai, Mumbai—where physical demand rules. Deep US capital markets matter little when paper lacks backing.
BRICS Diversification and Gold Corridors
Instead, central banks—led by BRICS—diversify from USD, bolstering reserves with physical assets. China builds “gold corridors” via Shanghai Gold Exchange for an alternative reserve system undermining dollar hegemony. This leverages gold’s scarcity as neutral store-of-value amid eroding fiat trust, fostering dedollarized trade via commodities.
Gold remains finance’s indispensable trust anchor; silver advances as industry’s strategic powerhouse. Geopolitically, US-China rivalry escalates: US pivots to Latin America; China dominates manufacturing and Asia. Global liquidity flows increasingly to real assets and commodities.
Multipolar Power Struggle: US vs. China
In sum, 2025 year-end turbulence signals not the secular bull market’s end, but a dramatic shift to Eastern physical reality overtaking Western paper illusion.
While COMEX/CME desperately hikes margins and invokes Silver Rule 7 to save shorts, China’s strategic export controls and BRICS demand dictate true value. The result: a multipolar power shift cementing gold as reserve anchor and silver as industrial hegemon.
7. Conclusion – Precious Metals – Slap In The Face and Year-End Wake-Up Call
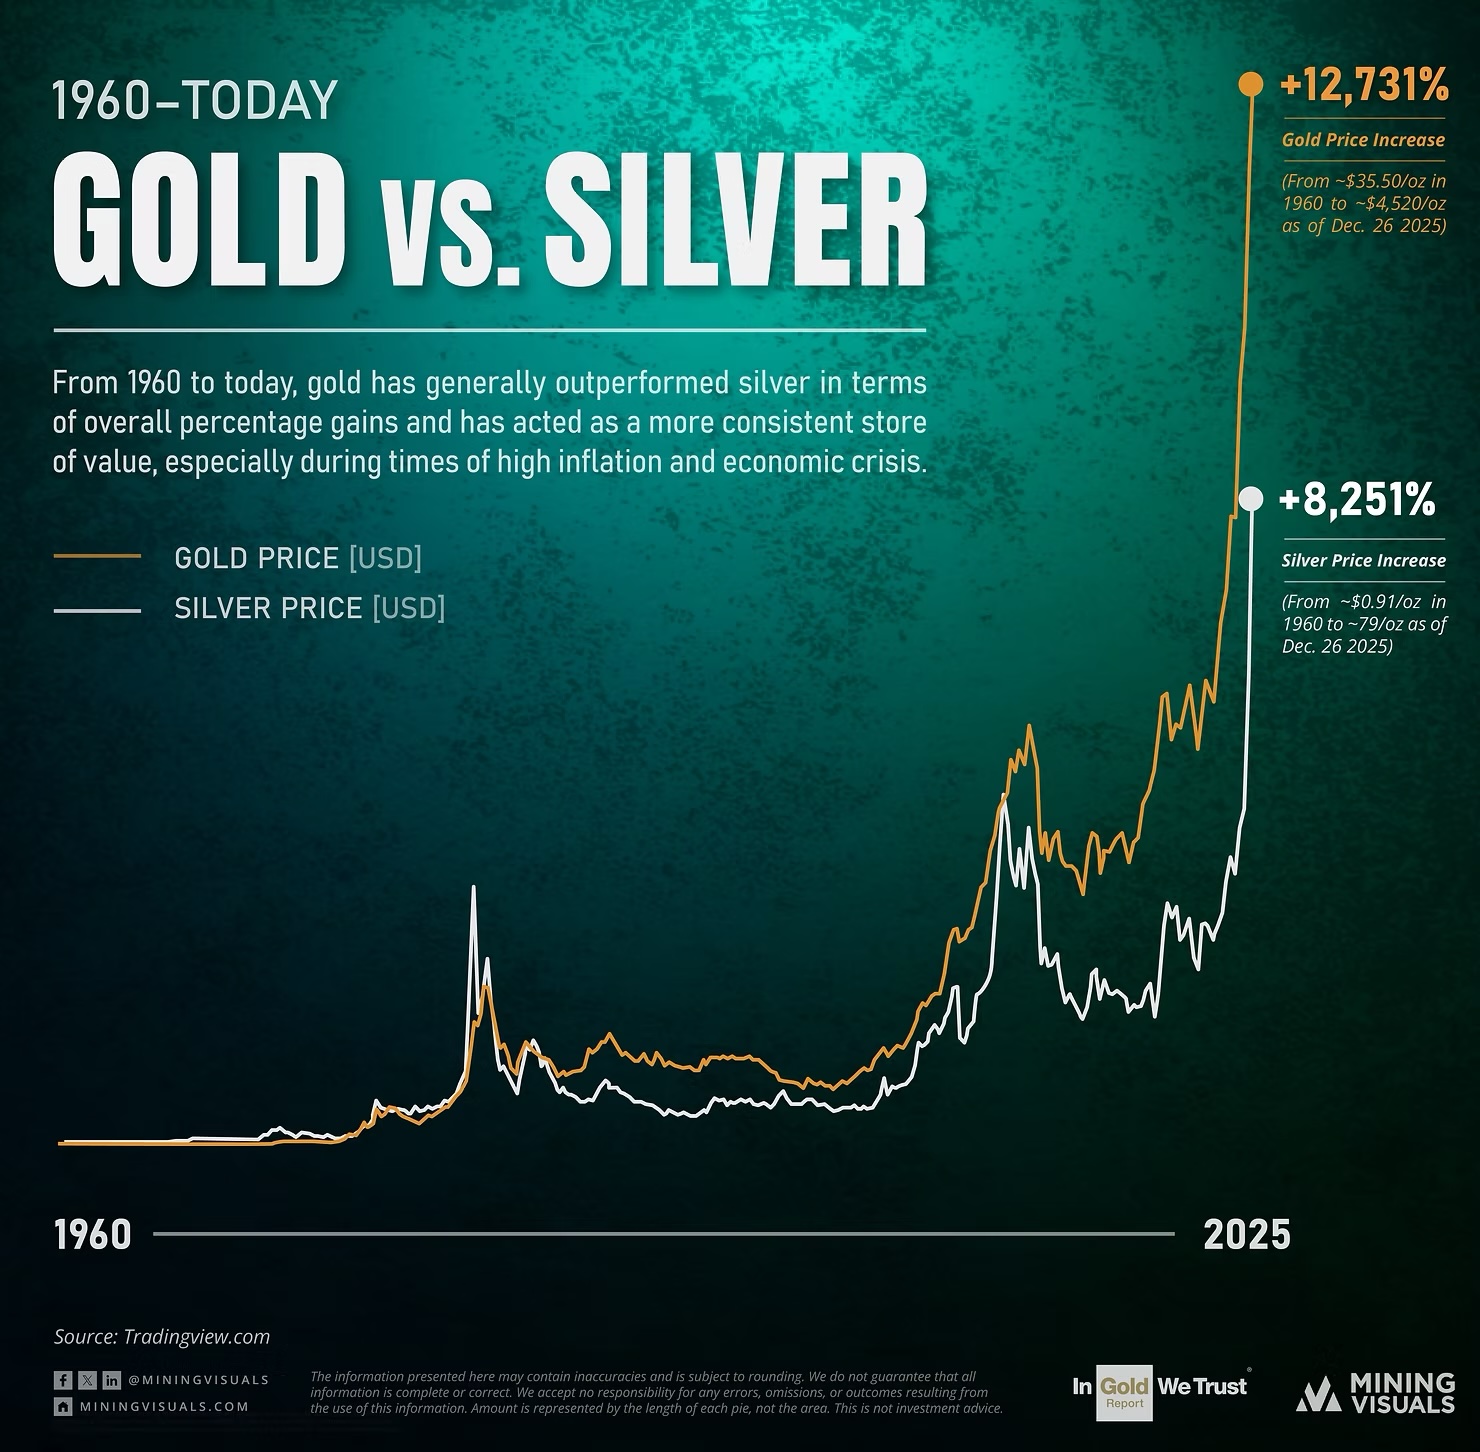
65-year gold-silver race, as of December 29, 2025. Source: Mining Visuals
2025 year-end volatility—silver’s USD 84 peak and 16% crash, gold’s drop from USD 4,550 to USD 4,274—signals not a bubble burst, but the final break between COMEX paper and Eastern physical reality. CME hikes up to 30% expose desperate protection of Western banks’ shorts, while China’s January 2026 export halt strangles solar/EV chains, cementing silver backwardation.
Technically, gold faces a bearish weekly engulfing pattern, warranting cautious skepticism into the new year.
Best-Case Scenario
If the signal averts via strong weekly close and high-level consolidation, the low hits USD 4,175–4,200 soon. Targets of USD 5,000–5,200 remain realistic by spring/early summer 2026.
Worst-Case Scenario
A major correction drags over weeks: weak January, then February/March seasonality aids recovery but fails prior highs (gold USD 4,550, silver USD 84). USD 3,500 targets reachable later.
Investors should stay physically positioned, using deep pullbacks as entry opportunities.
“December 31st, 2025, Precious Metals – Slap In The Face and Year-End Wake-Up Call” – analysis was initially published on December 31st, 2025, by www.celticgold.de and translated into English on December 31st, 2025.
Feel free to join us in our free Telegram channel for daily real time data and a great community. If you like to get regular updates on our gold model, precious metals and cryptocurrencies you can subscribe to our free newsletter.
Disclosure:
This article and the content are for informational purposes only and do not contain investment advice or recommendations. Every investment and trading move involves risk, and readers should conduct their own research when making a decision. The views, thoughts and opinions expressed here are the author’s alone. They do not necessarily reflect or represent the views and opinions of Midas Touch Consulting.

