


Silver – on the dot
Last week we identified the turning point for Silver by the day (chart-book from Jan 21st).
Here is the chart from last week.
Entry opportunity for the reload called on the dot:
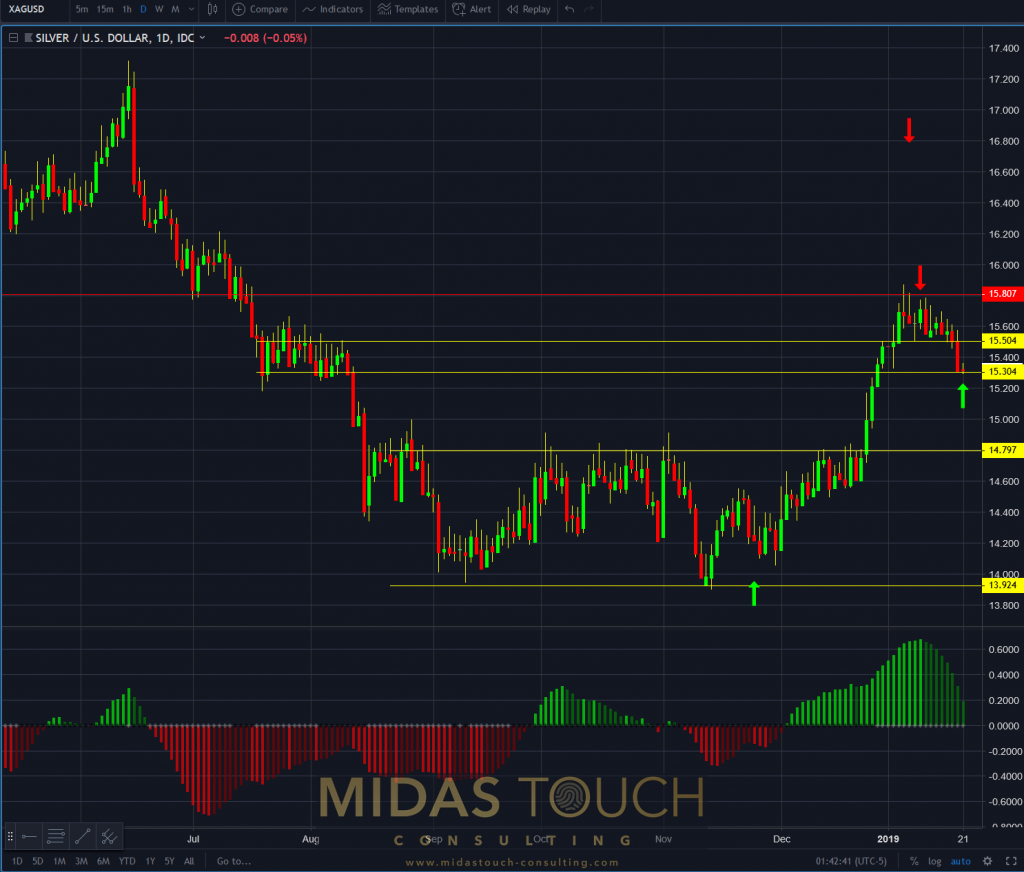
Silver in US Dollar, daily chart as of January 21st 2019.
And this is the price action of Silver versus the US Dollar since then:
3 percent move up within a week:
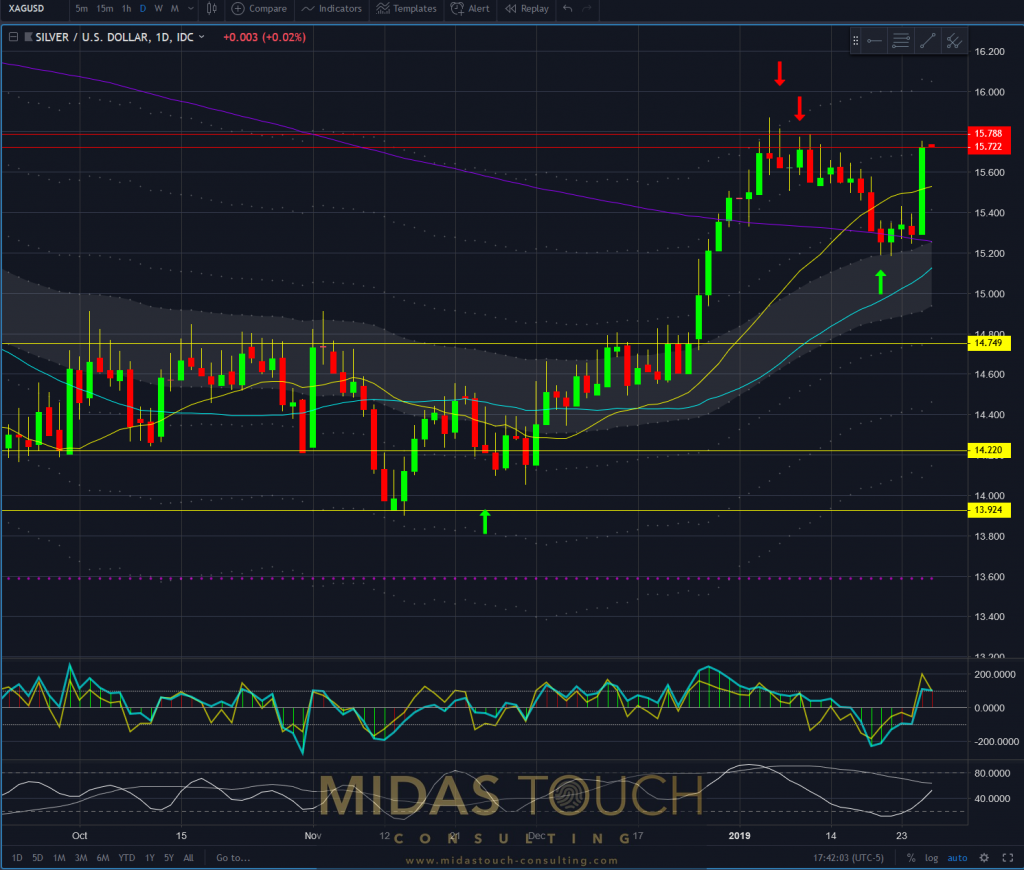
Silver in US Dollar, daily chart as of January 26th 2019.
After a thrust up of nearly 50 cents into a resistance zone, it is now advised to take partial profits. No matter what time frame you are exposed in (besides long term monthly or annual holdings), this zone near 15.75 USD warrants most likely for a temporary pause.
Especially since the risk reward ratio is limited, taking some gains off the table is a fair move money management wise. This can be seen on the weekly chart here where the light blue line represents the next distribution zone:
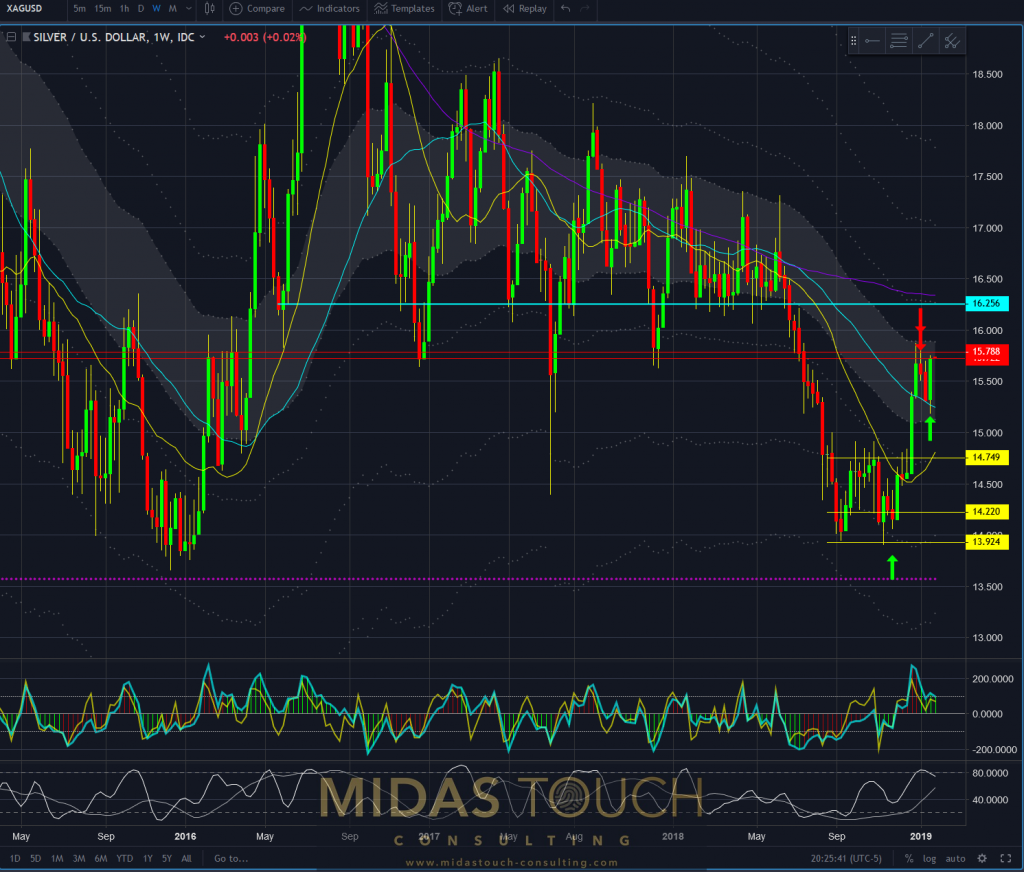
Silver in US Dollar, weekly chart as of January 26th 2019.
Looking at the typical behavior at supply/demand zones, marked as red squares here on this daily chart, it illustrates how Silver behaves near support/resistance. The yellow wicks of the candle stick represent typical overshoots and as such have also limit the risk/reward ratio. As such target exits for partial profit taking are prudent.
How Silver trades:
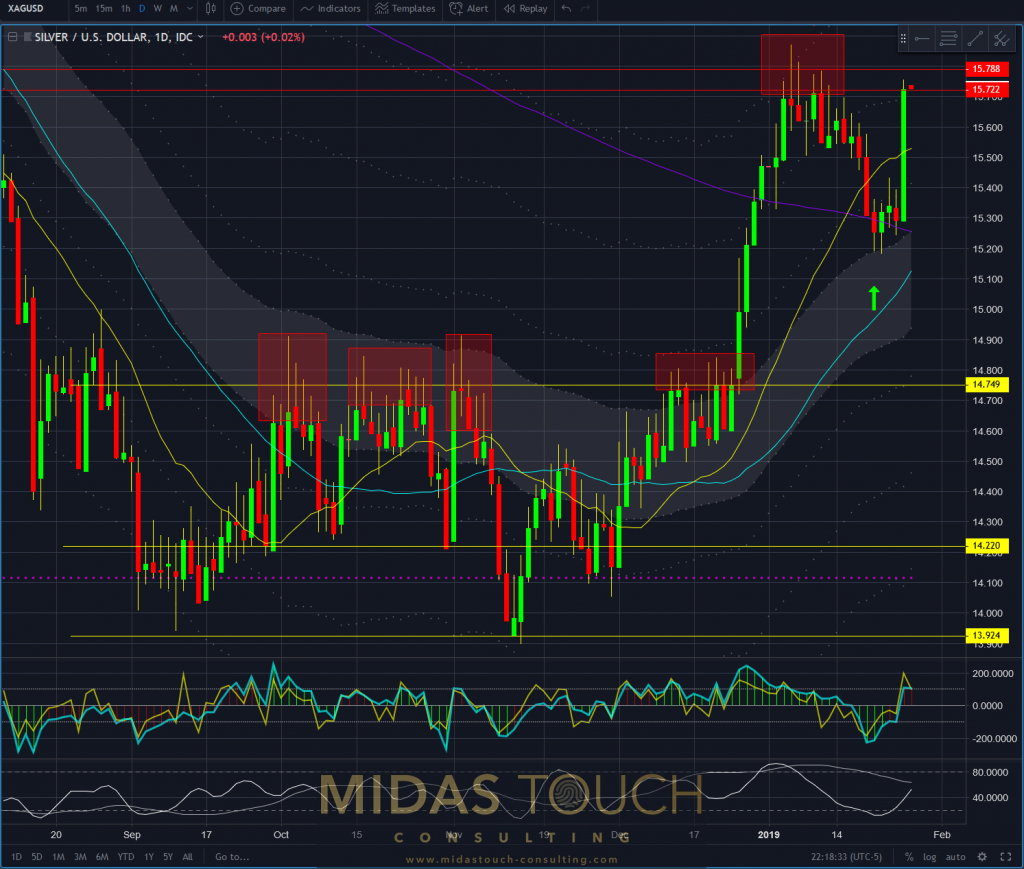
Silver in US Dollar, daily chart as of January 26th. 2019 trading behavior
Follow us in our telegram channel.

