


Euphoria with warning signs on the horizon
Gold’s powerful rally has pushed prices to new all-time highs amidst a complex backdrop of macroeconomic forces. Amidst the euphoric atmosphere surrounding gold and silver prices, some warning signs are showing up on the horizon. Gold – Euphoria with warning signs on the horizon.
1. Review
For more than four months, starting in late April, gold prices have been consolidating at a high level, moving sideways. The powerful rally that began at the start of the year initially peaked on April 22nd at a new all-time high of USD 3,500 before sharply correcting down to USD 3,120. Although bulls managed a solid recovery afterwards, all breakout attempts above the resistance zone between USD 3,400 and 3,450 failed over the following months. At the same time, bears made little progress on the downside.
As a result, from late spring into midsummer, prices oscillated mostly between USD 3,200 and 3,400. In August, this trading range narrowed before another pullback took gold down to USD 3,311.
From that low point—particularly after the Jackson Hole central bankers’ symposium – gold began a fresh upward move. Breaking out of the multi-month consolidation triangle unleashed pent-up energy, and for the past four weeks prices have been climbing almost daily to new record highs. With the latest peak at USD 3,791, gold has gained nearly 44.5% year-to-date in dollar terms, and 27.7% in euro terms.
Silver Surges Past USD 40 for First Time in 14 Years
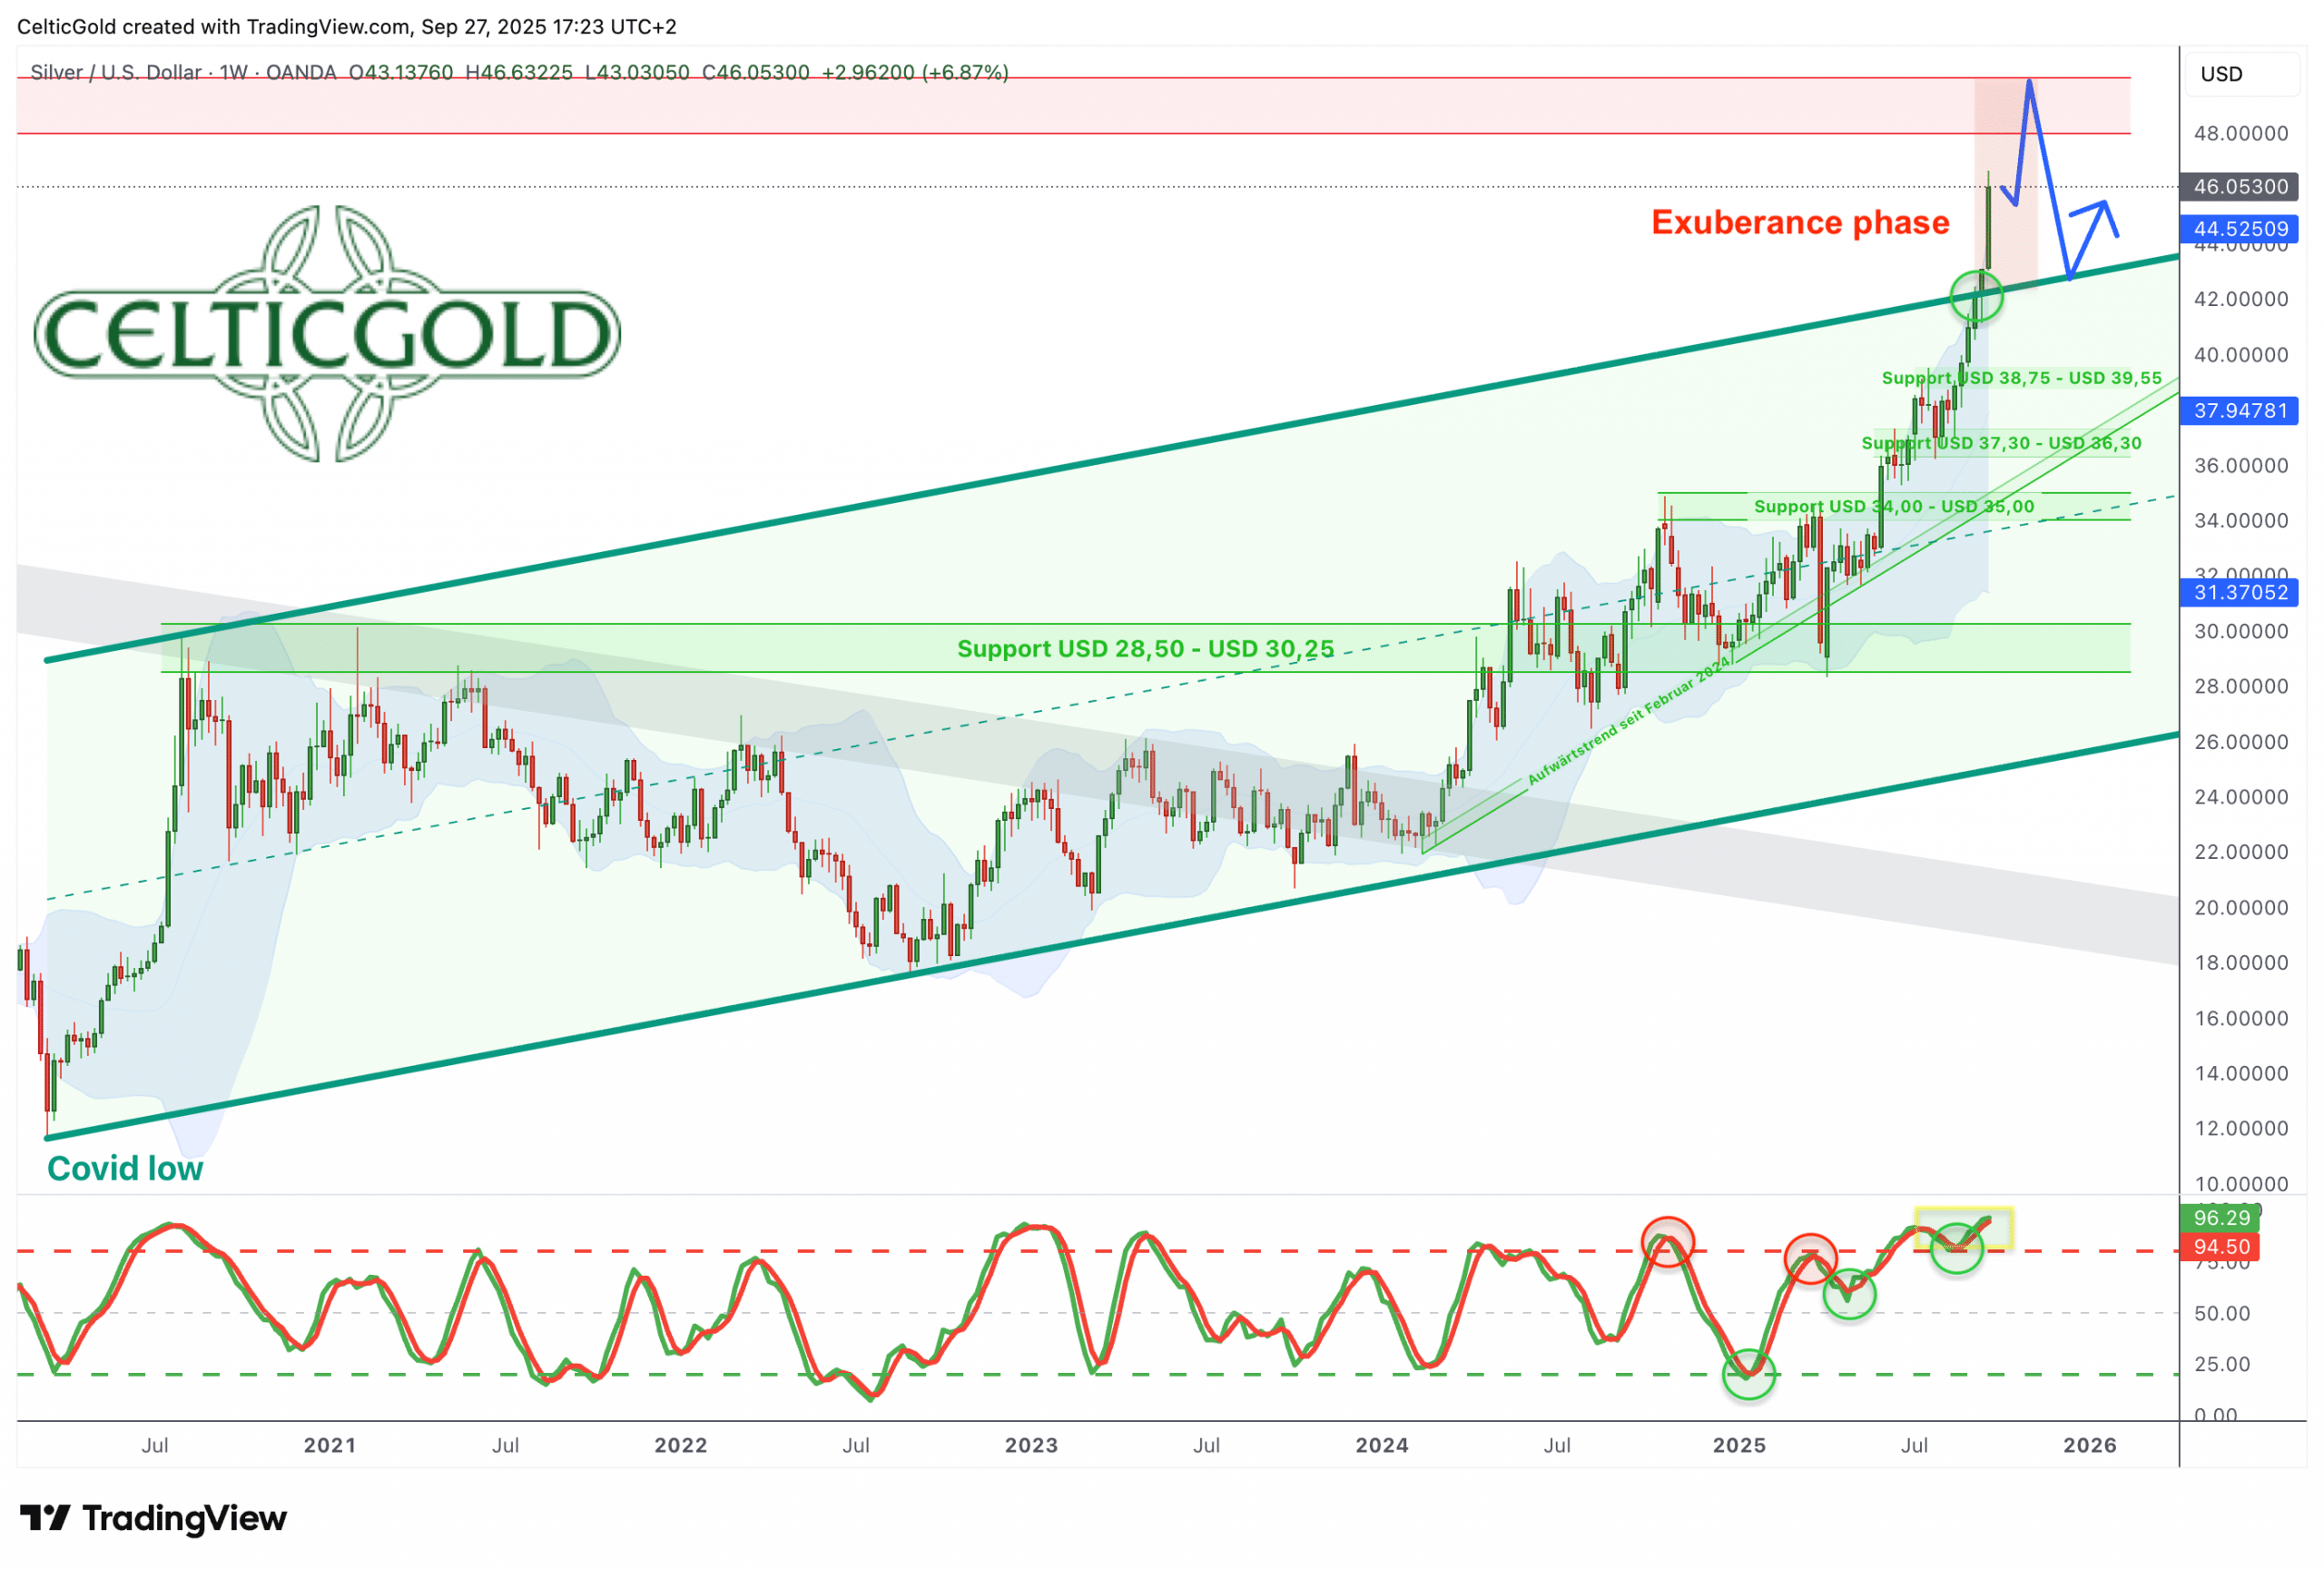
Silver in US-Dollar, weekly chart as of September 27th, 2025. Source: Tradingview
Silver has also rallied strongly in recent weeks, most notably overcoming the psychologically important USD 40 mark – a level last seen 14 years ago, in August 2011. While silver’s moves had largely followed gold’s lead, the breakout above USD 40 and subsequent climb beyond USD 46 suggest the market is now moving independently and could soon test the all-time high near USD 50. Around this level, however, a temporary top or at least increased volatility in precious metals is likely. Following their rapid rise, gold, silver, and mining stocks all appear overheated and due for some form of a breather soon.
2. Chart Analysis – Gold in US Dollars
Weekly Chart: Next Target USD 4,000 – October or Spring 2026?
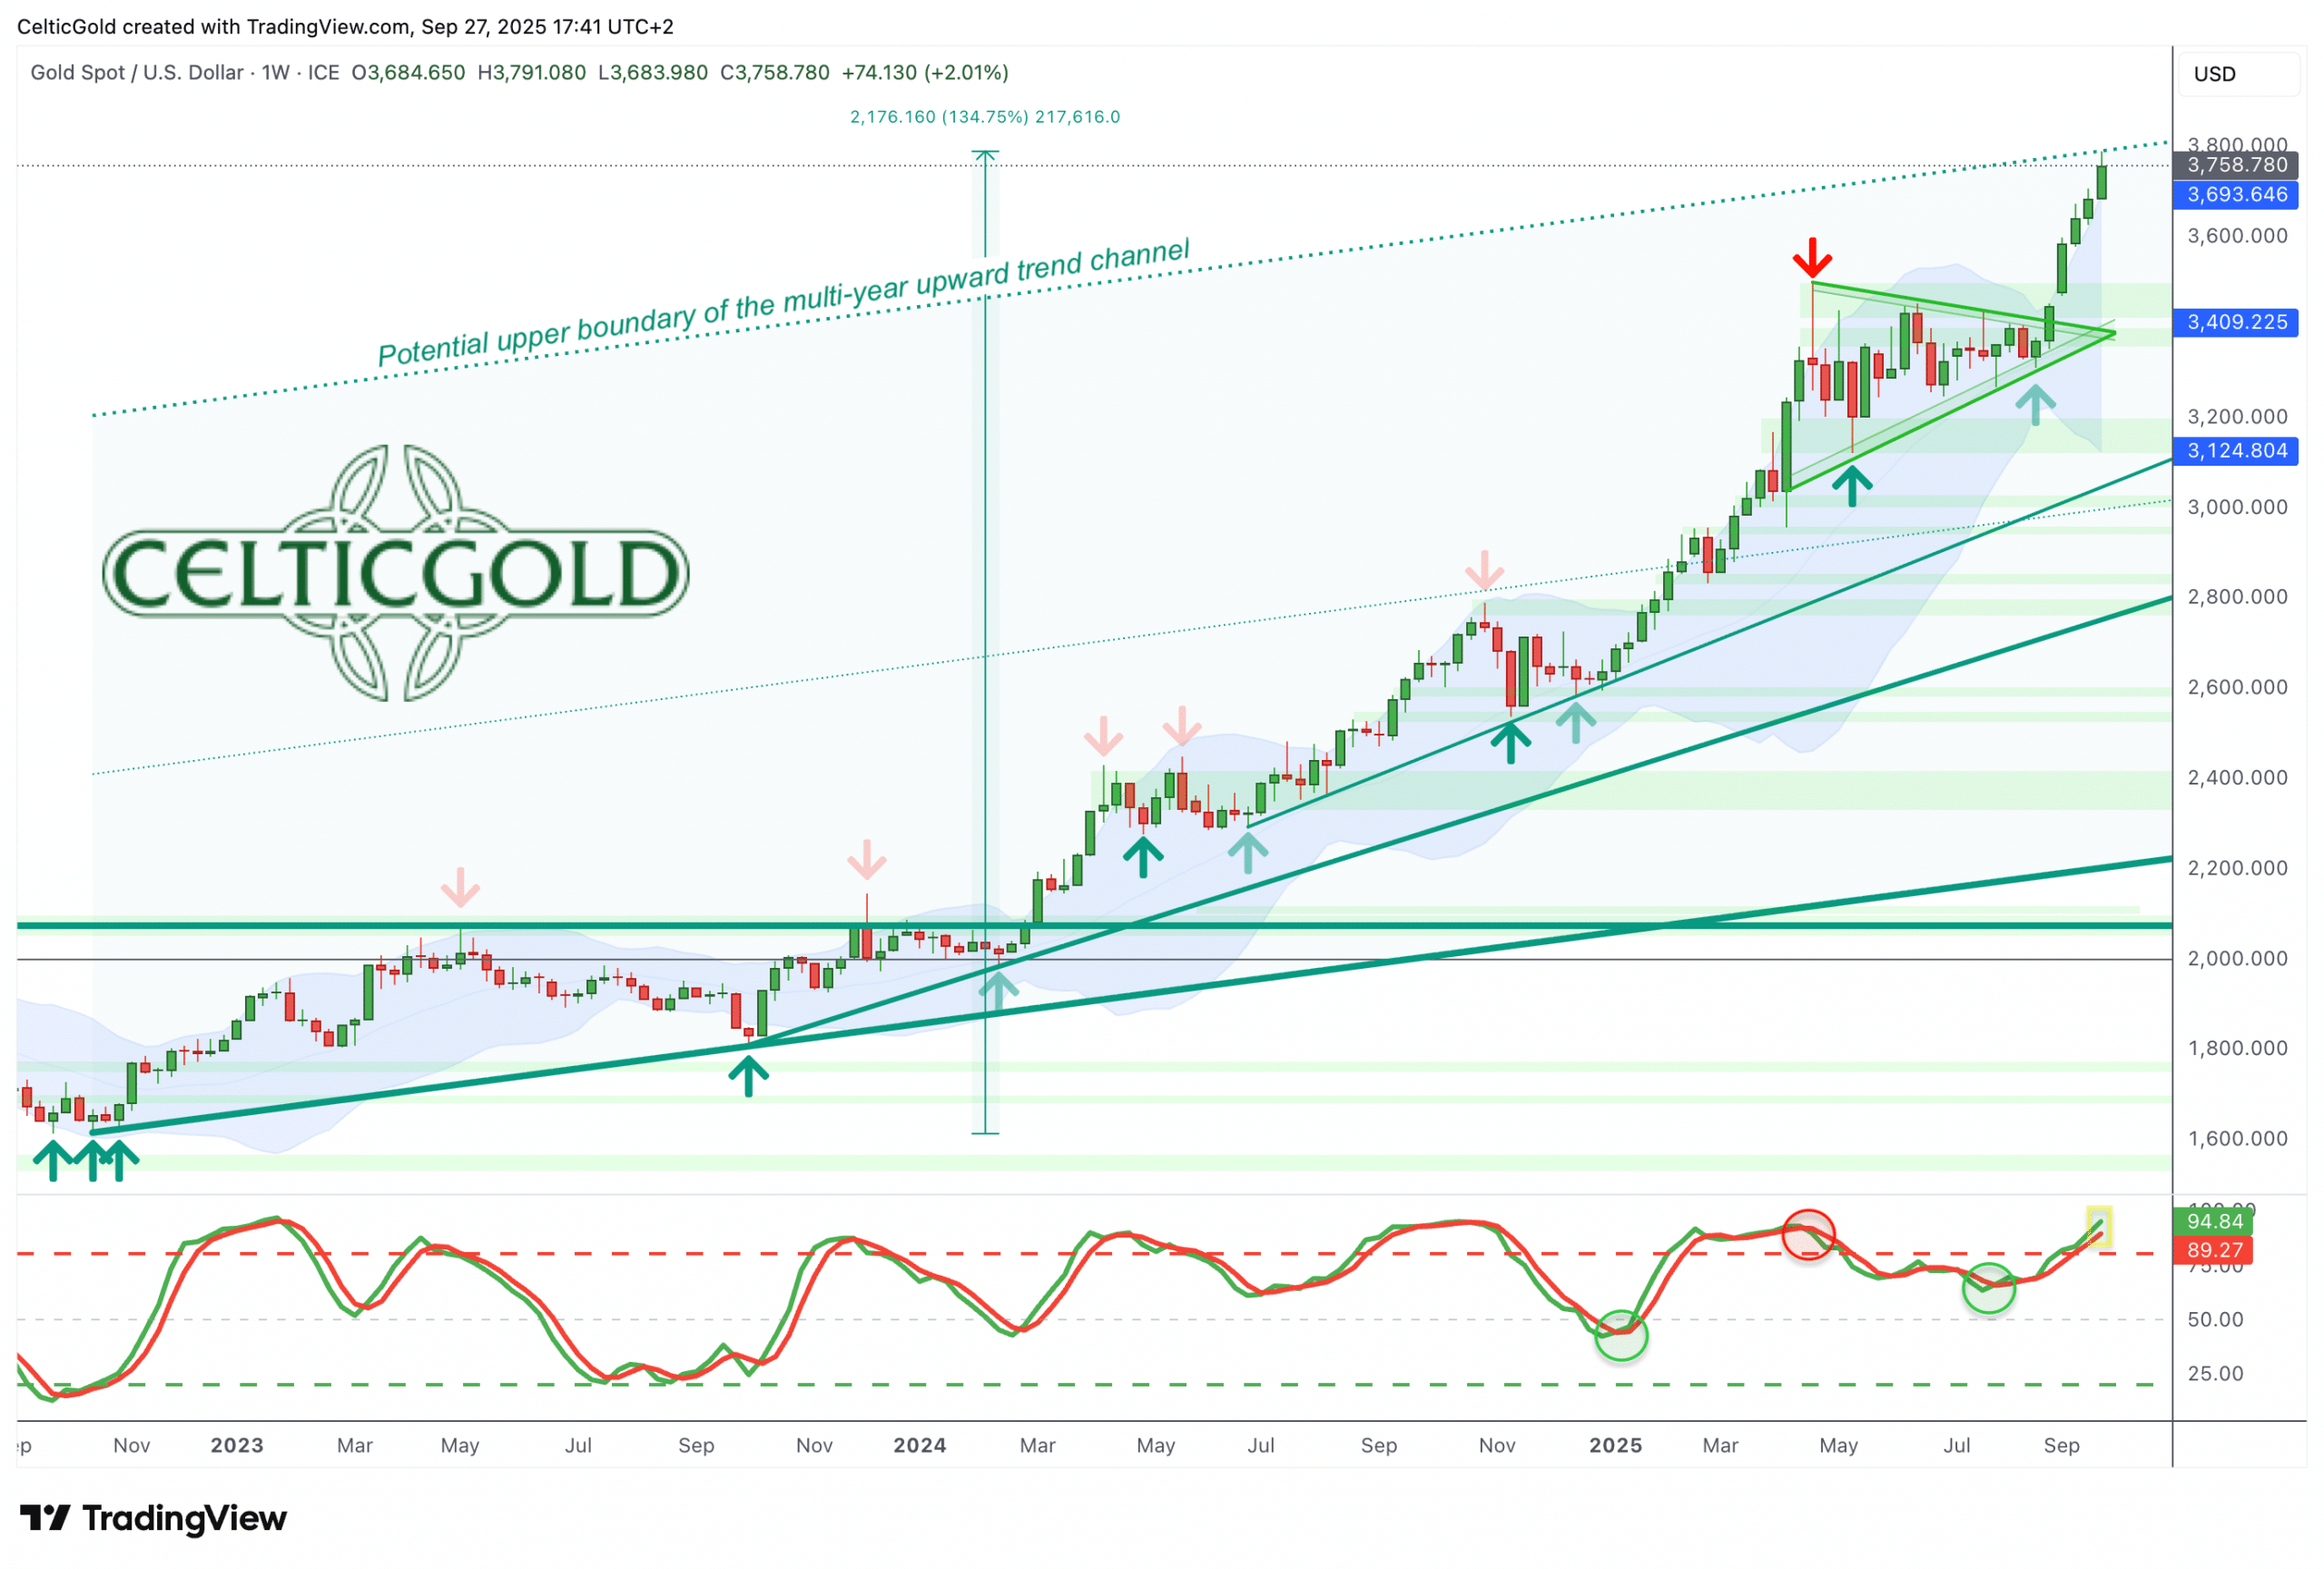
Gold in US-Dollar, weekly chart as of September 27th, 2025. Source: Tradingview
The breakout from the four-month consolidation triangle marked the next leg of the secular bull market. The strength and speed of the recent rally make clear that bulls are in firm control.
On higher timeframes, gold is heavily overbought, but this is typical for strong bull markets, where surprises tend to be on the upside. The weekly stochastic has shifted into a bullish embedded state, anchoring the uptrend. At the same time, gold is now trading well above its weekly Bollinger Band (USD 3,693), heightening the risk of sudden pullbacks. Still, no sell signals have emerged – trend momentum currently appears unstoppable.
Having already reached the initial target of USD 3,750 derived from the triangle, attention now turns to the critical USD 4,000 level. A sustained rally into the 4,300–4,400 area looks plausible by spring 2026, though near-term upside may be limited. Should gold start to consolidate around USD 3,800 first, the journey to USD 4,000 and beyond could be delayed until the first quarter of 2026.
Daily Chart: Waning Momentum
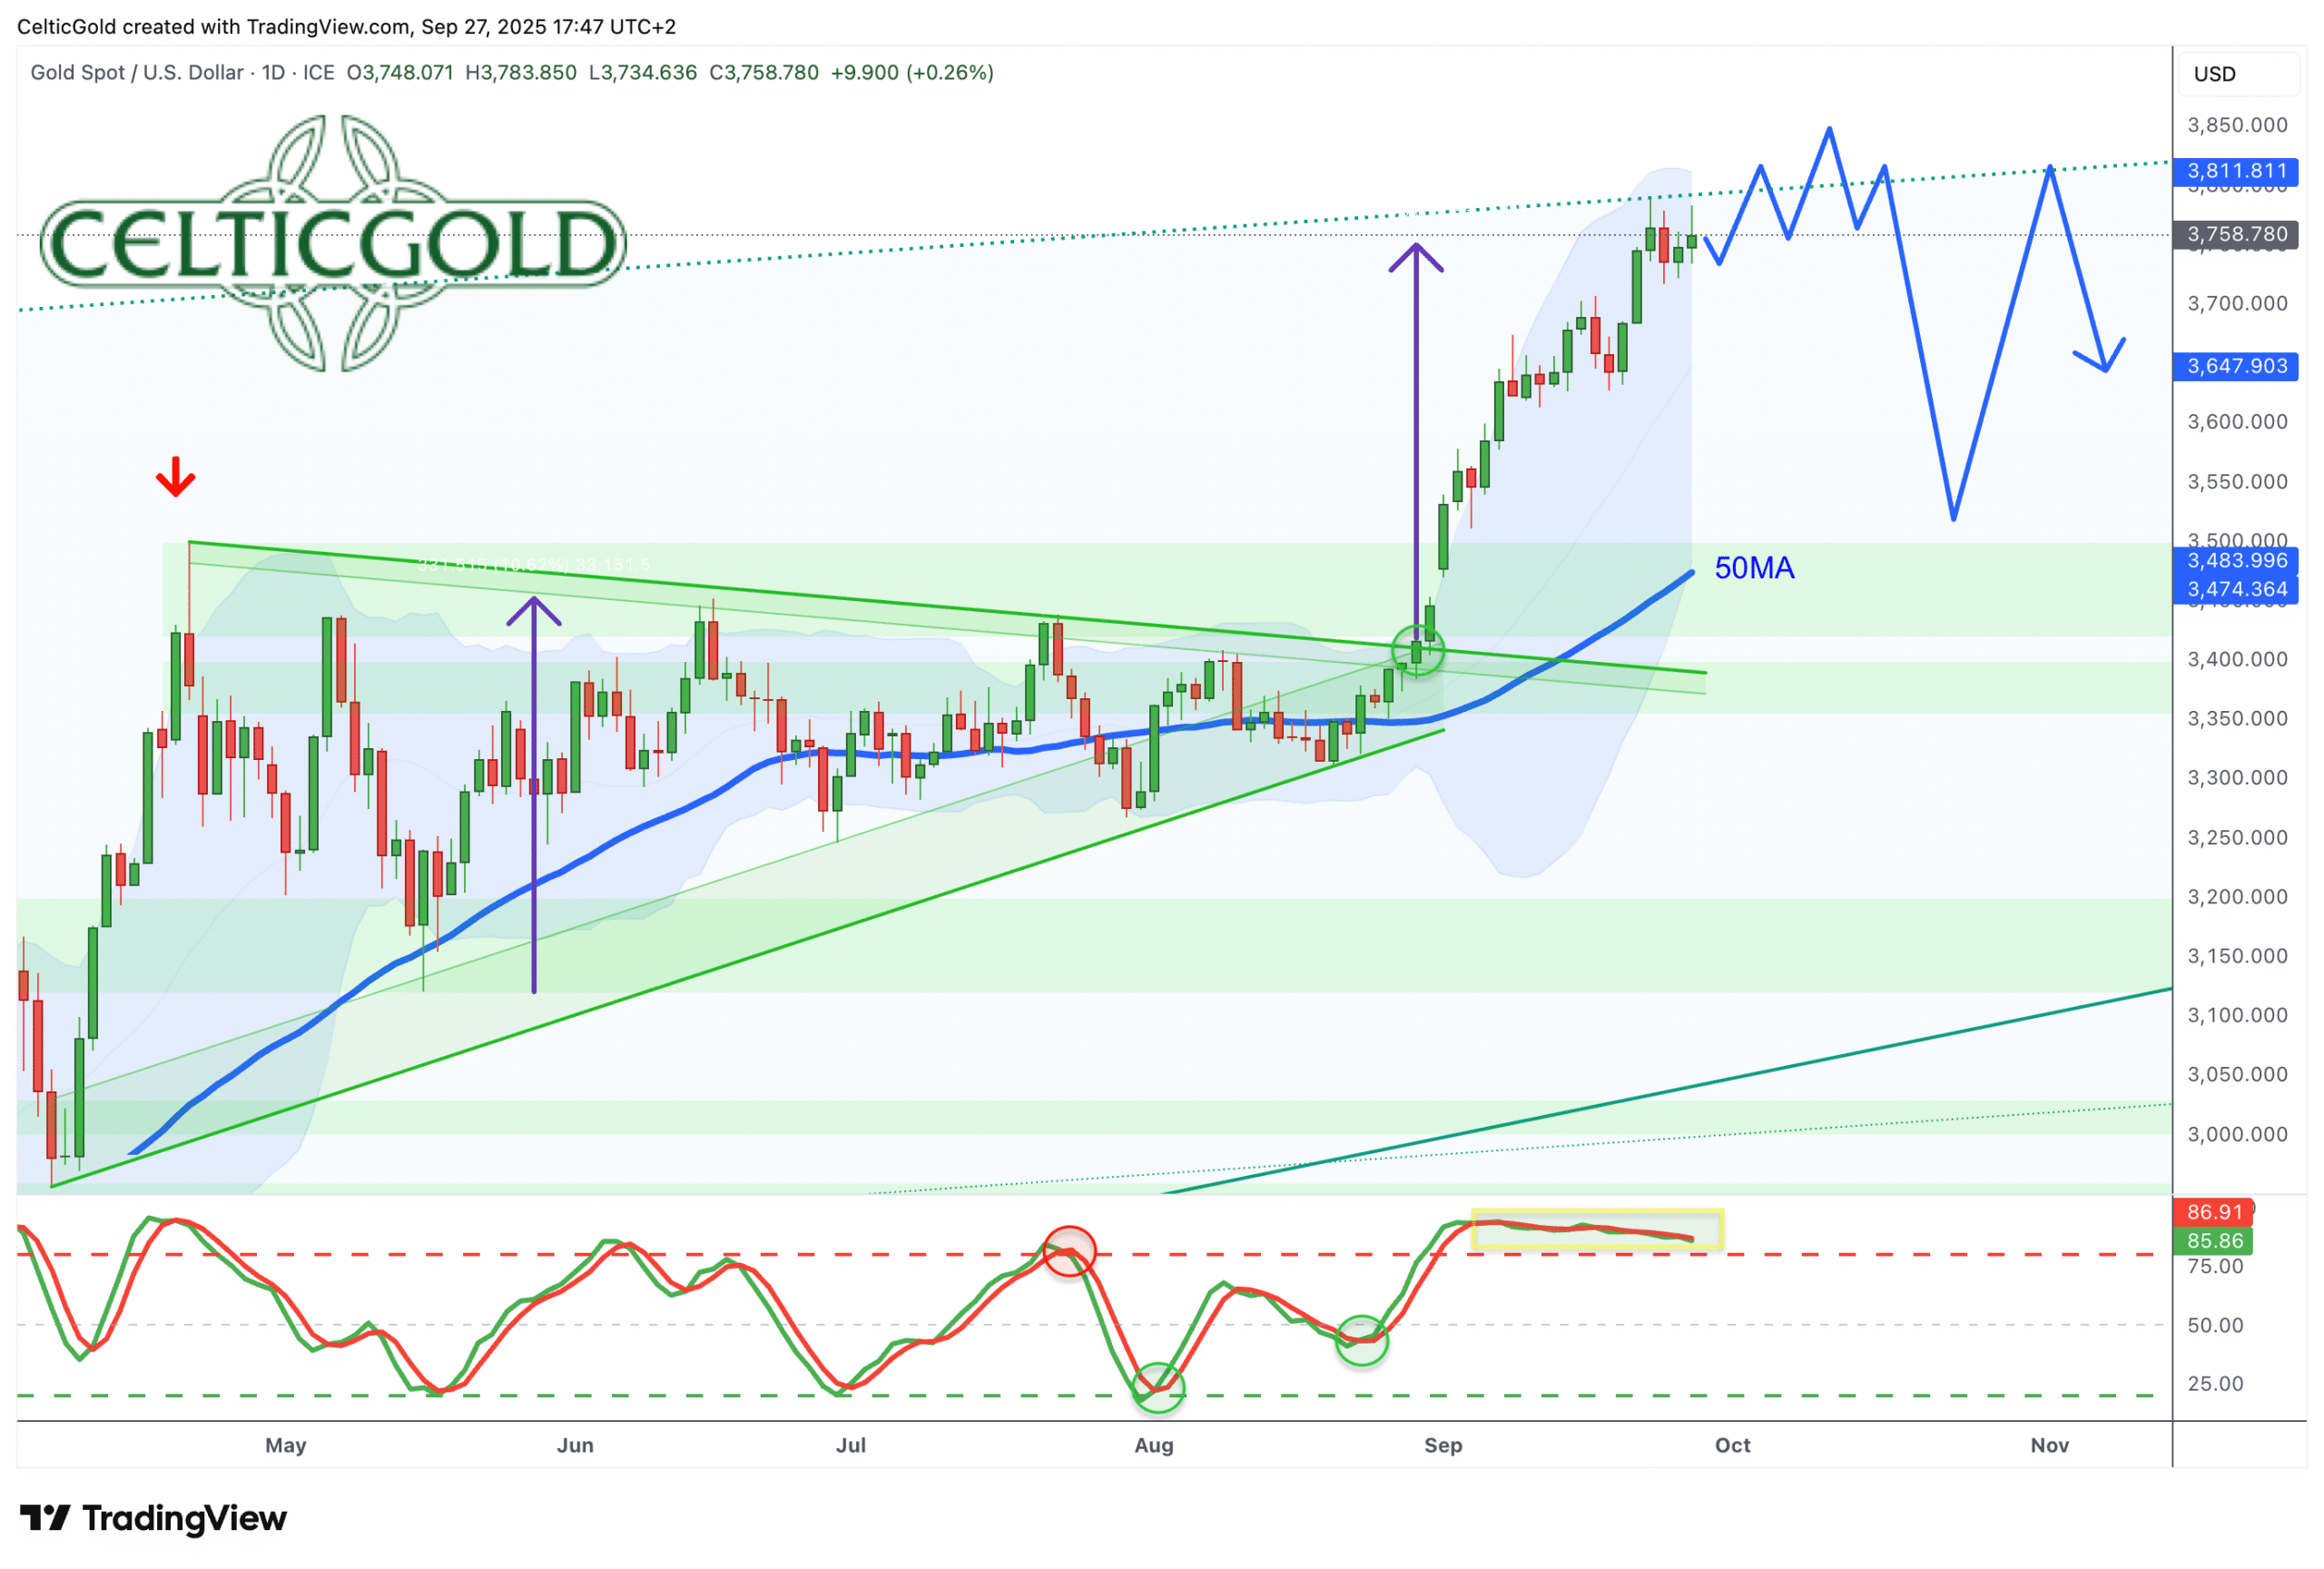
Gold in US-Dollar, daily chart as of September 27th, 2025. Source: Tradingview
On the daily chart, gold has broken through all resistance levels and entered uncharted territory with no clear support or resistance lines. The Bollinger Bands stretch between USD 3,806 and 3,492, while the stochastic oscillator barely maintained its bullish embedded state into the weekend. Although no reversal signals have formed, momentum has noticeably weakened over the past three sessions.
Our USD 3,750 target has already been met, with USD 4,000 now the next milestone. If silver continues towards USD 50, gold could benefit and push higher too. For now, possible extensions towards USD 3,800 – 3,850 remain on the table, though a breakthrough towards USD 4,000 may prove more difficult. Capital rotation into stocks and crypto markets from mid-October could pose headwinds for overbought precious metals.
3. Commitments of Traders for Gold – Bearish
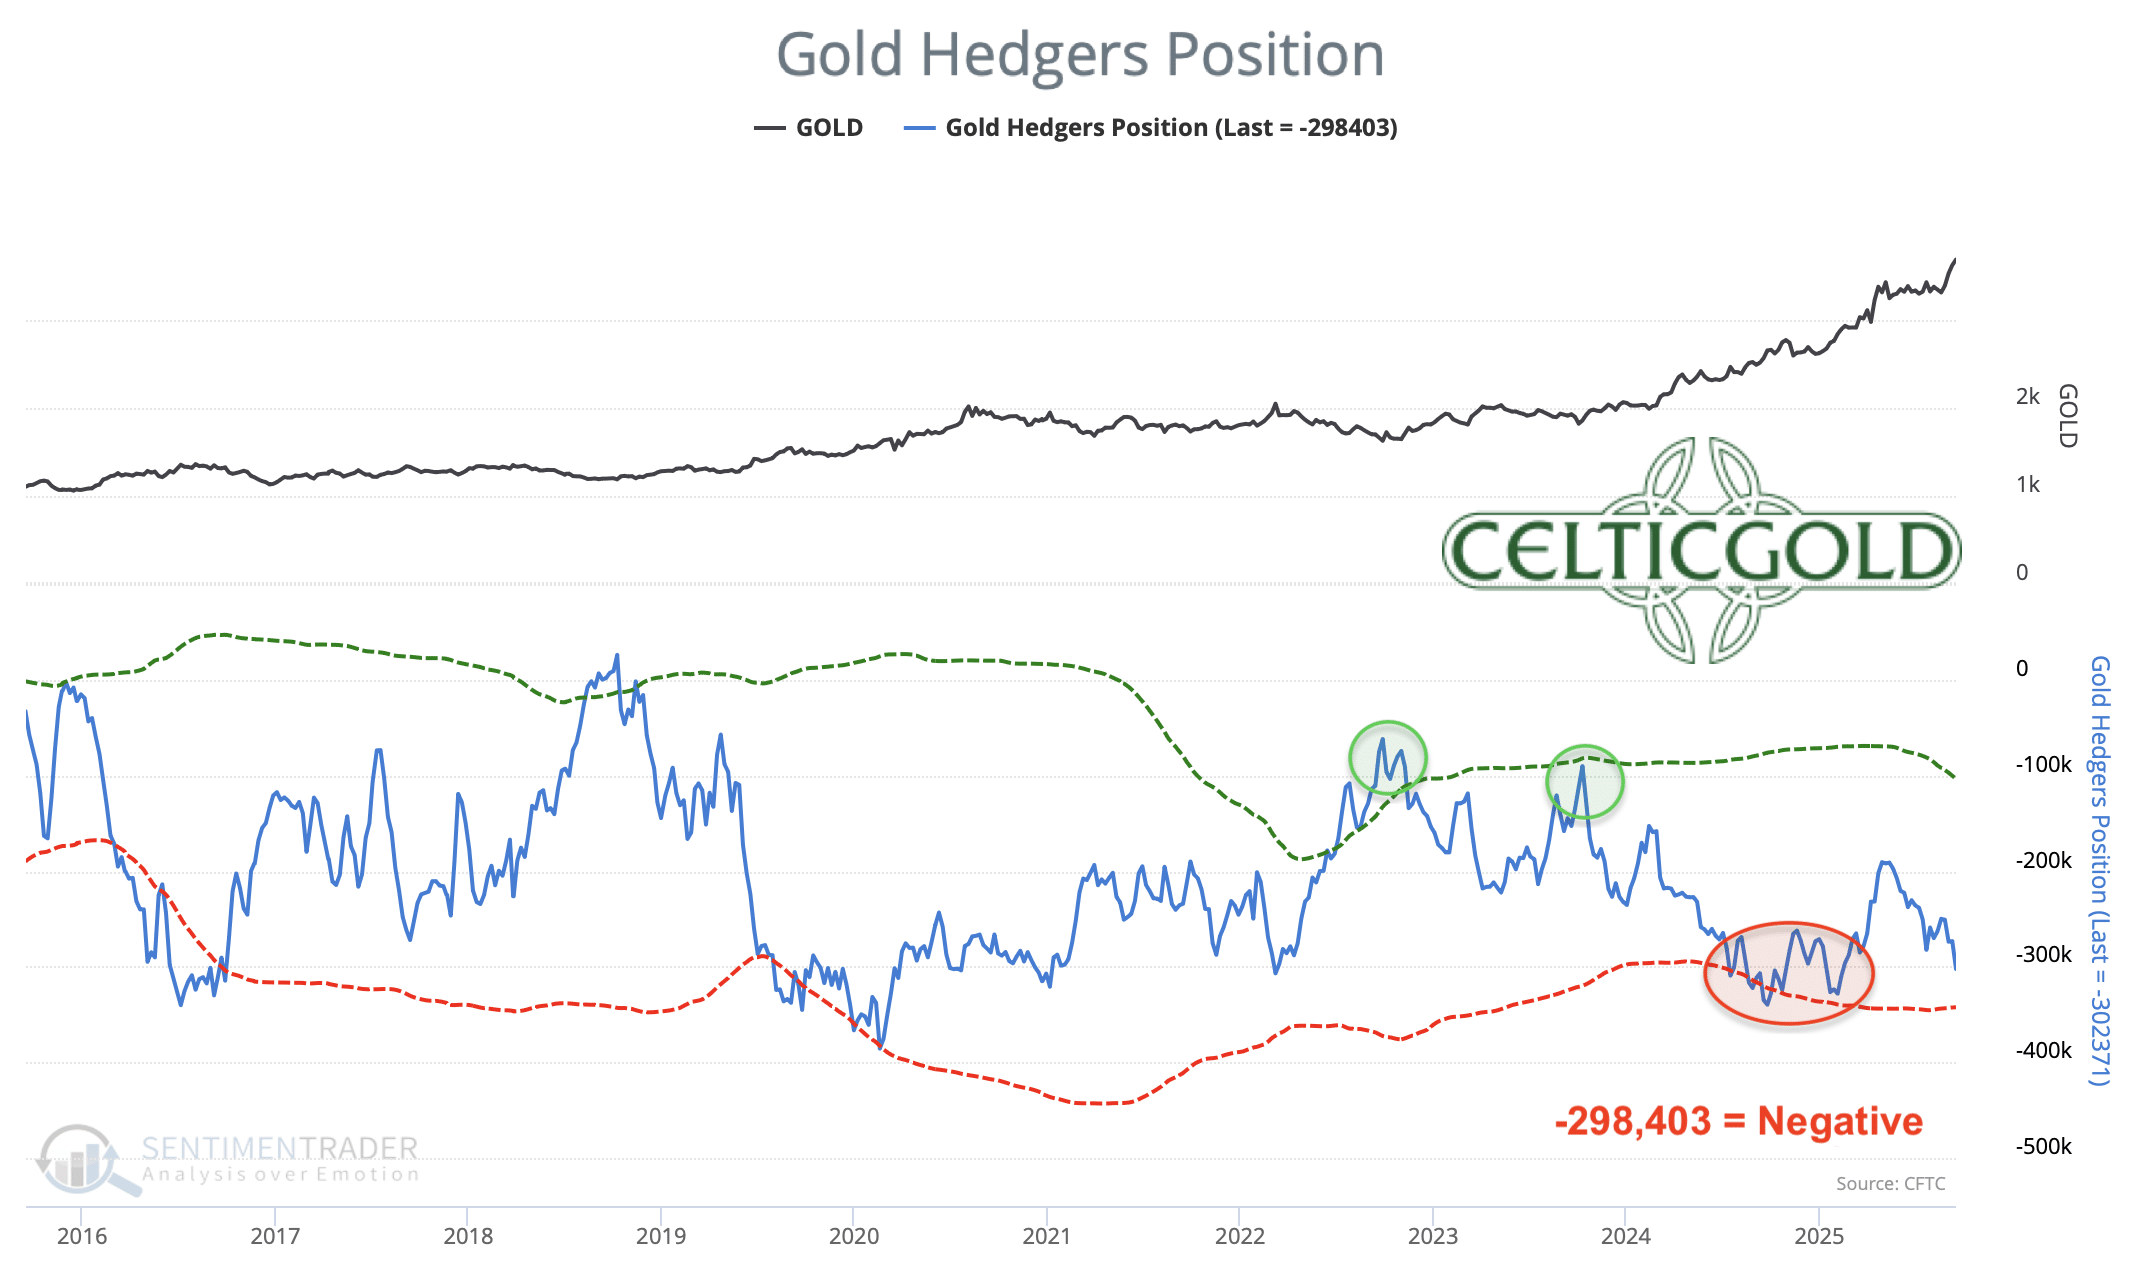
Commitments of Traders (COT) for gold as of September 23rd, 2025. Source: Sentimentrader
At around USD 3,691 on September 23, commercial traders held a net short position of 298,403 gold futures contracts. This sharp increase mirrors the rally seen in recent weeks. While this represents a clear warning signal, it should neither be overstated nor dismissed. The physical market remains dominant, as paper-trading dynamics appear to have lost control.
Based on 25 years of data, the CoT report is flashing a strong sell signal.
4. Sentiment for Gold – Euphoria
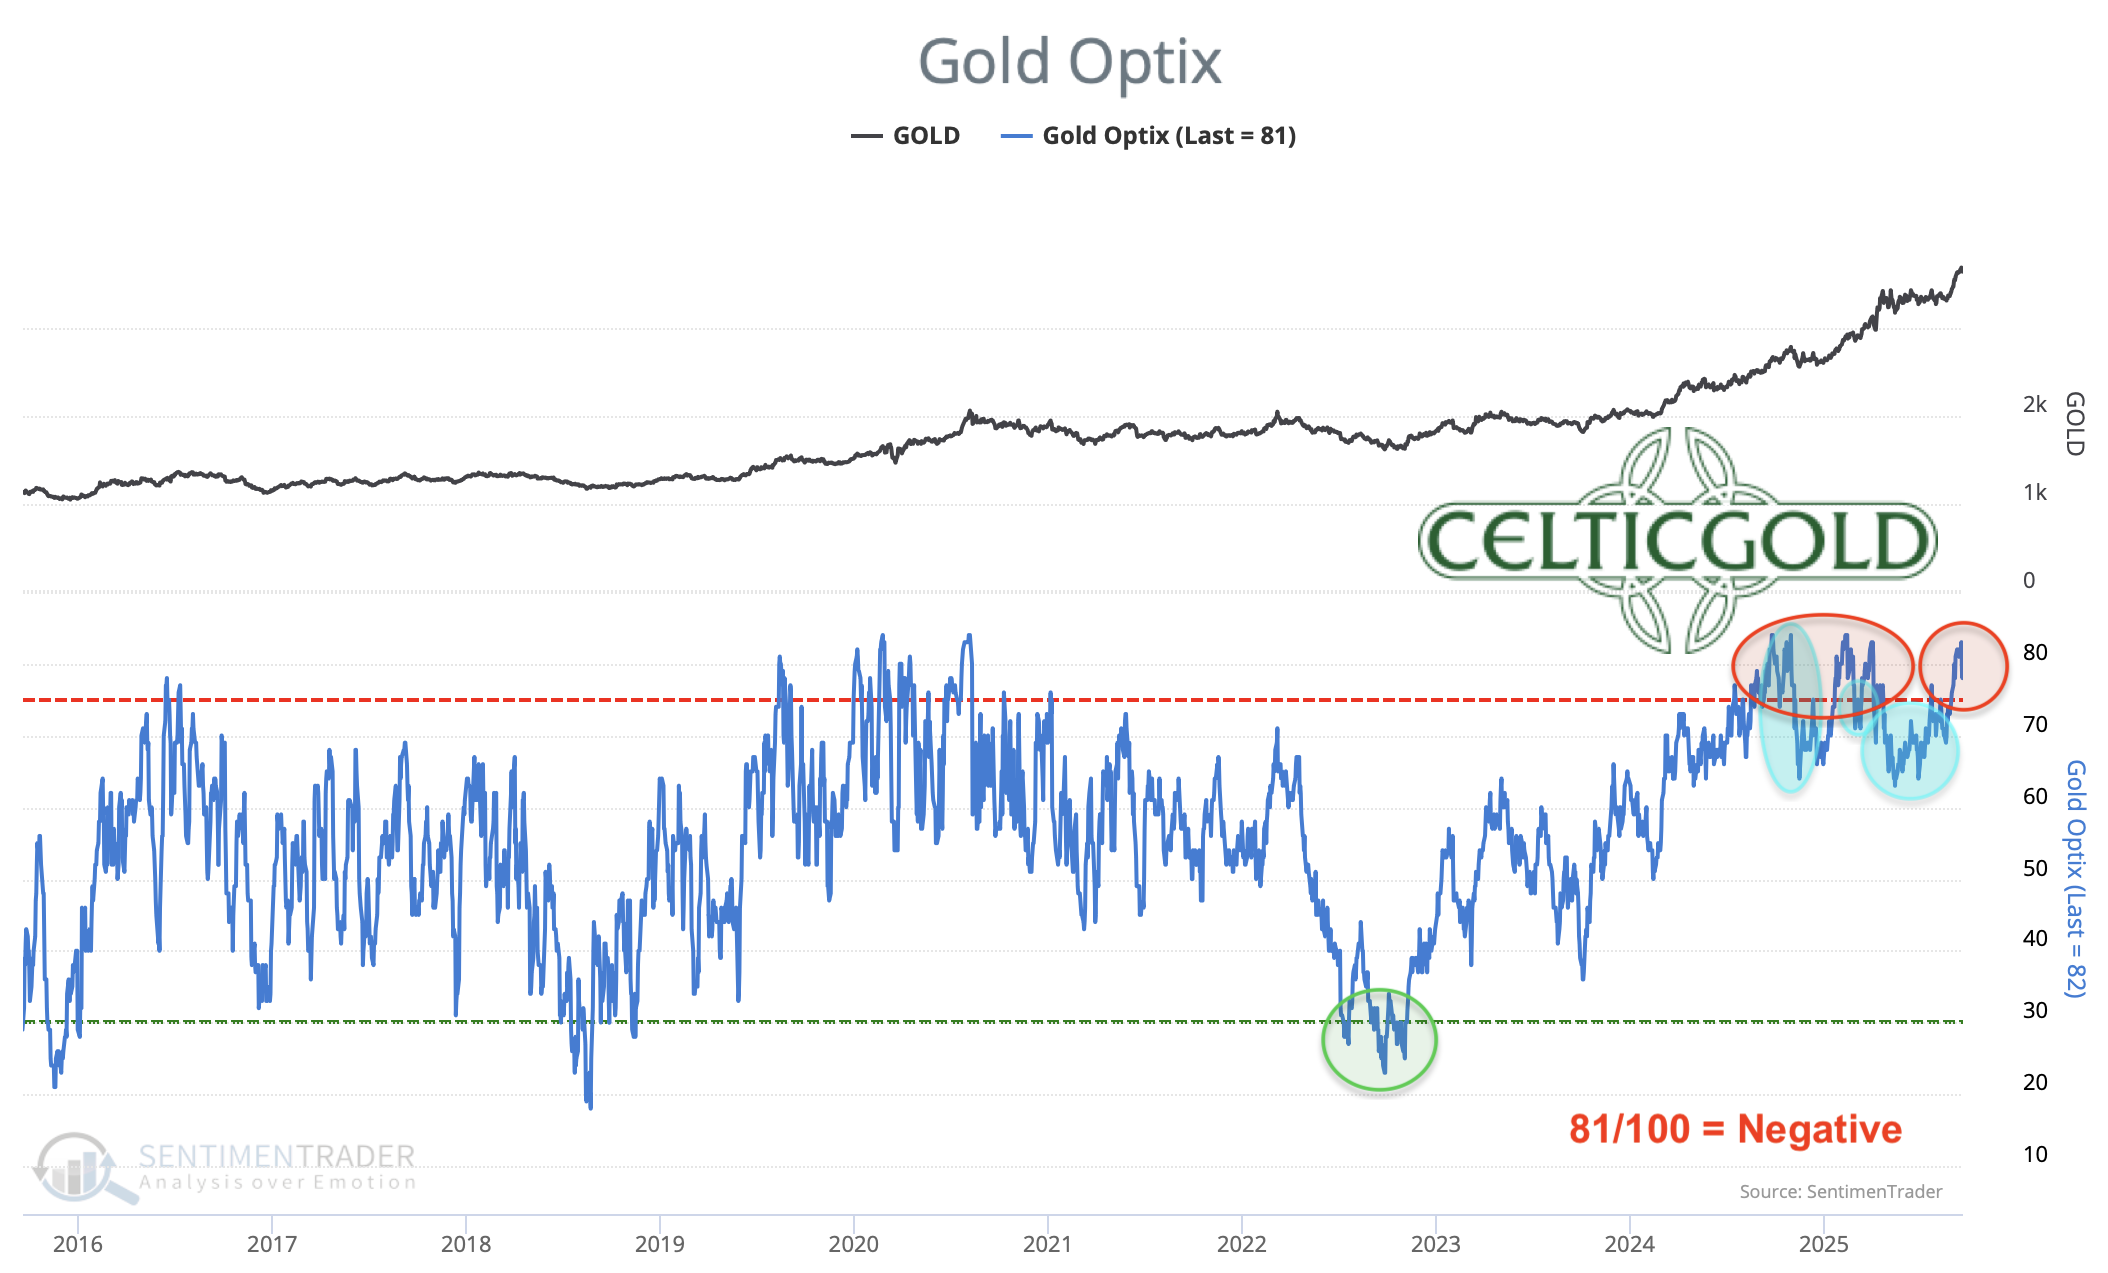
Sentiment Optix for gold as of September 26th, 2025. Source: Sentimentrader
The Sentiment Optix indicator is showing elevated optimism levels, bordering on euphoria. This suggests no contrarian entry opportunities. Instead, rapidly rising prices are attracting inexperienced traders eager to jump on board. Historically, such conditions lead to at least a weeks-long correction or a sharp, sudden pullback.
Current sentiment is in dangerously euphoric territory and should be treated as a serious warning sign.
5. Seasonality for Gold – Cycle has already shifted to dark orange
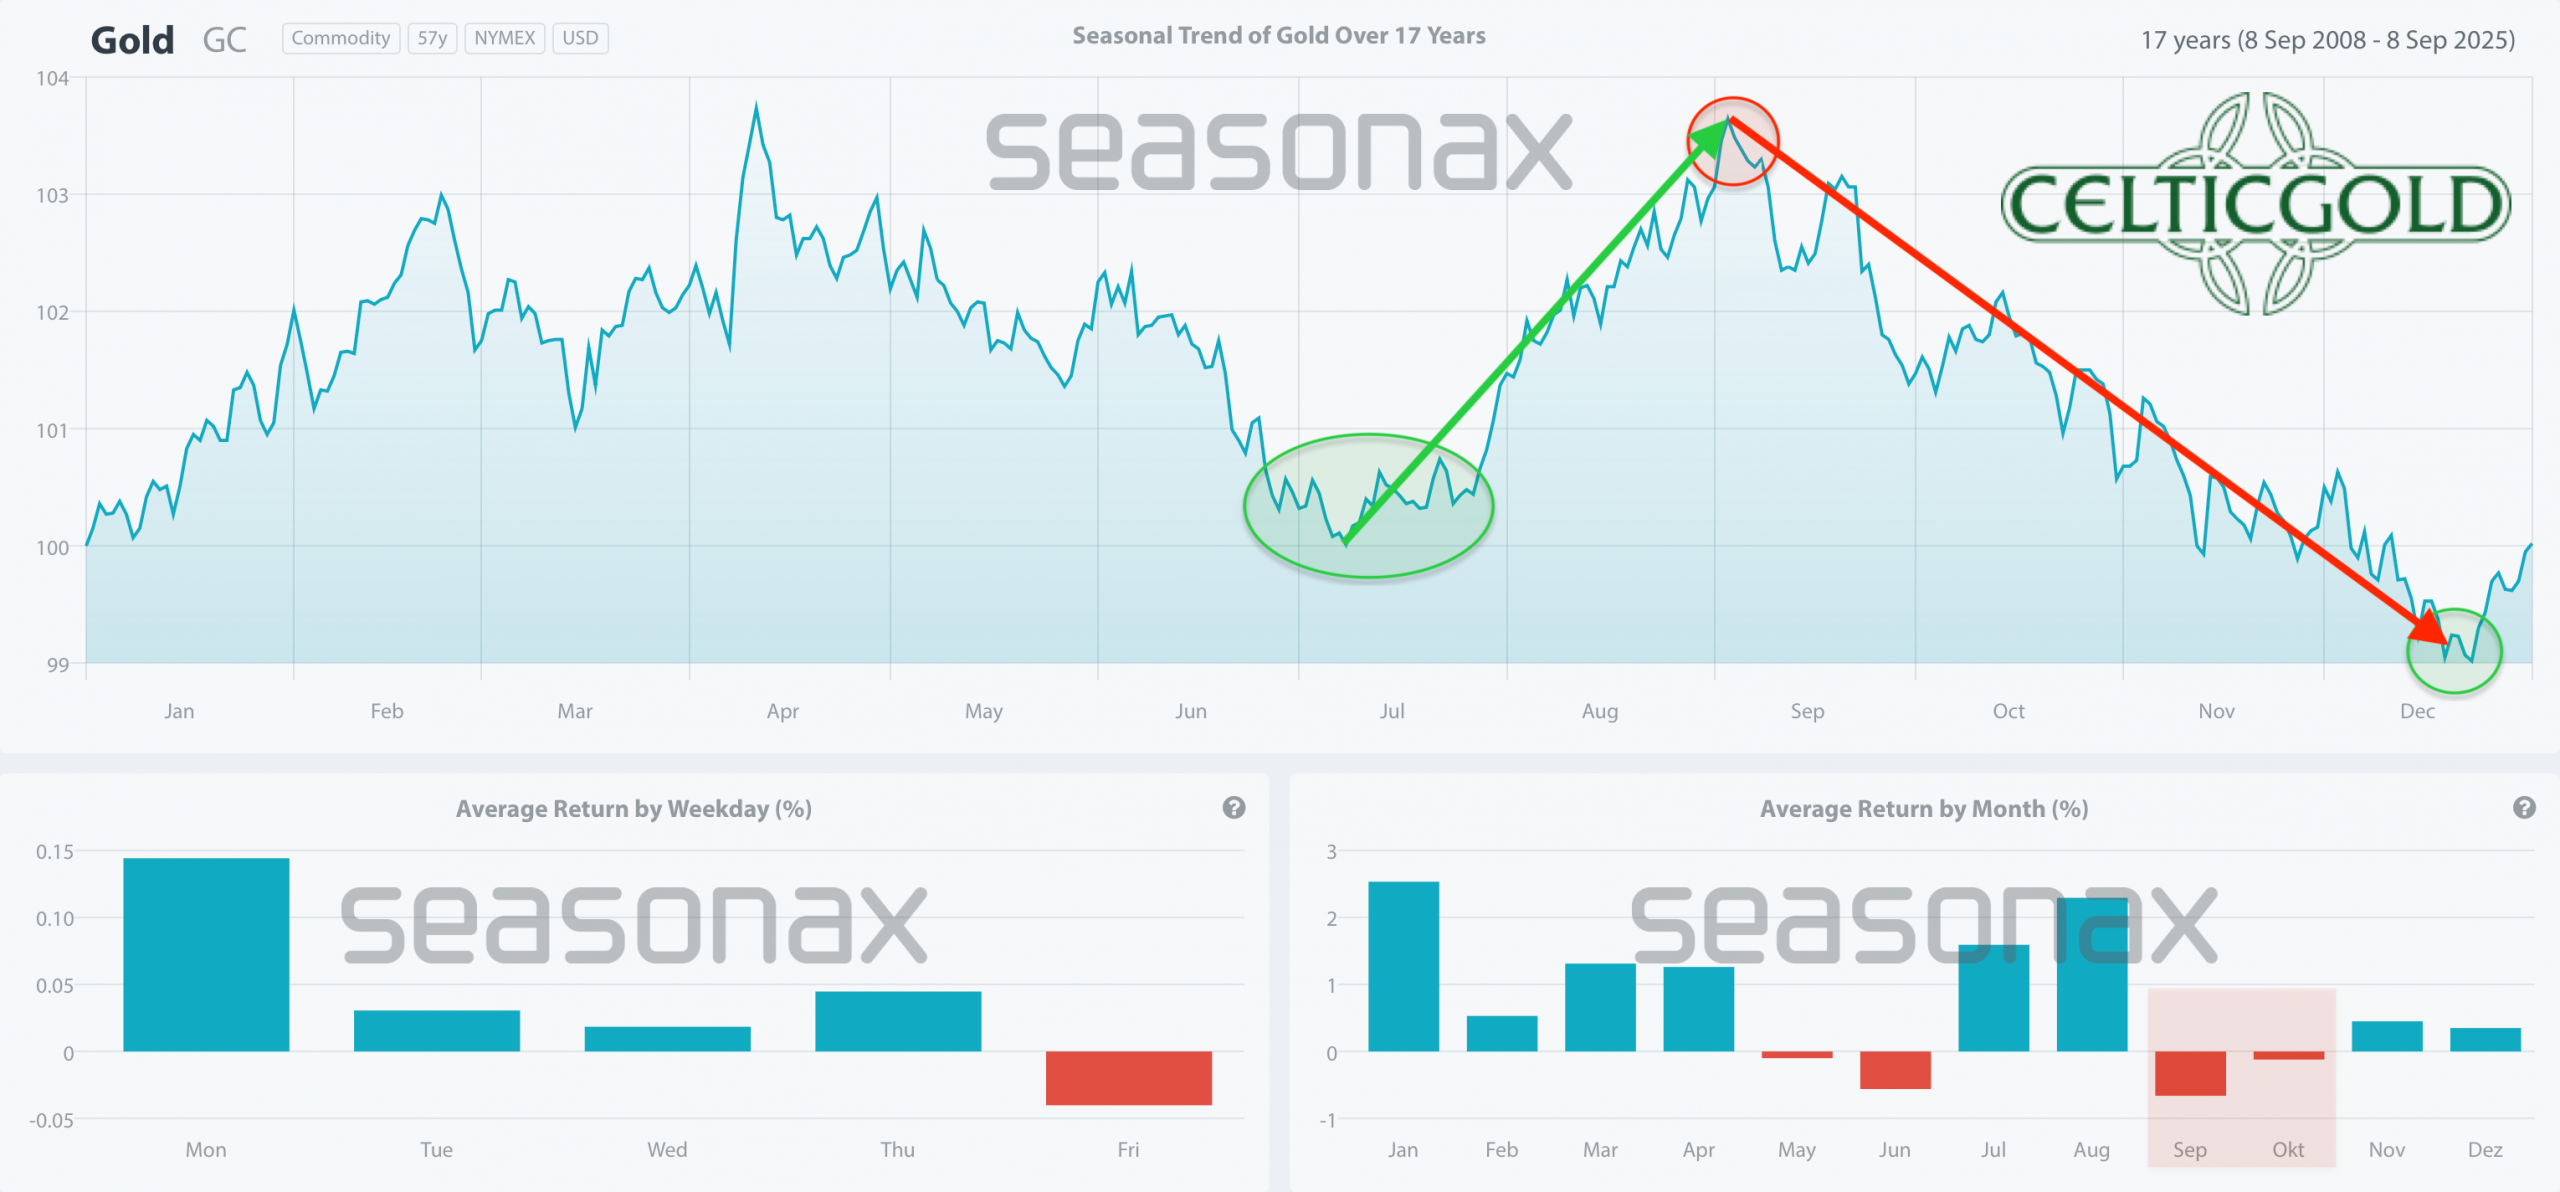
Seasonally, gold tends to find cyclical summer lows by late July to mid-August, followed by a period of strength into September. This year, the timing shifted slightly due to the April peak at USD 3,500. Against this backdrop, a significant interim high should be expected no later than late October.
The seasonal backdrop suggests only limited further upside in coming weeks before a corrective phase lasting into mid-December. Seasonality is flashing a strong caution signal.
6. Macro Update – Four longterm fundamental drivers for Gold

The steep price increases in the precious metals sector vividly demonstrate that the gold price is far more than just a technical chart phenomenon. Behind the rally lie strong and deeper macroeconomic forces that provide lasting momentum to the market. While inflation expectations, interest rate policies, global geopolitical uncertainties, and capital and currency market developments appear as central pillars at first glance, those who want to understand the gold market and assess its long-term dynamics must focus on the true fundamental drivers.
1. Liquidity – Explosive global money supply growth erodes purchasing power and boosts demand for gold as a store of value.
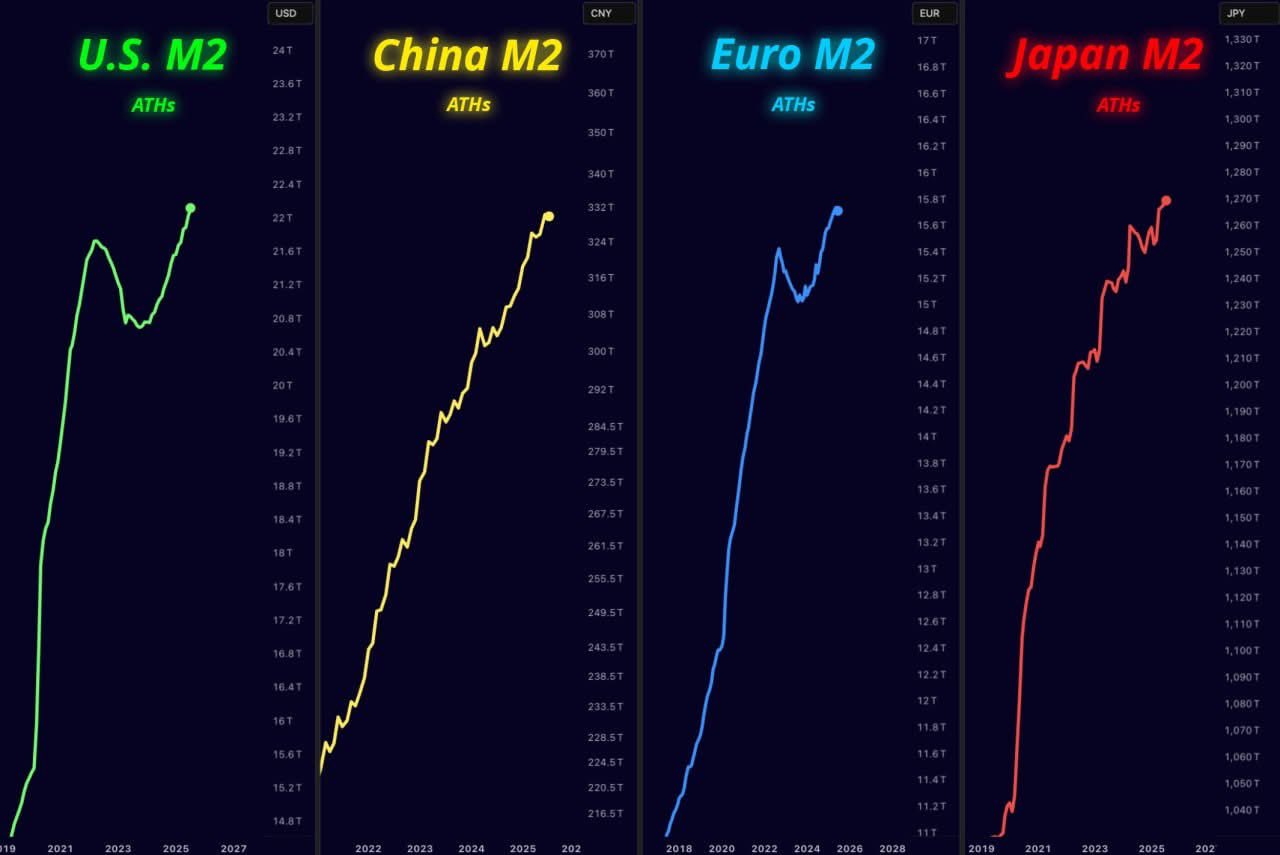
Money supply growth in the USA, China, Eurozone, and Japan, as of September 5th, 2025. Source: Unknown
Money supply growth in the USA, China, Eurozone, and Japan, as of September 5th, 2025. Source: Unknown
One of the most important prerequisites for functioning markets and especially for rising prices is global liquidity. Easing monetary policies, expansive fiscal programs, and strong credit impulses create excess capital searching for investments. Over the past 25 years, the extreme expansion of the money supply has been a key driver for gold prices. For instance, U.S. M2 money supply reached a new record high of USD 21.9 trillion in May 2025, growing by USD 1.36 trillion since the end of 2023 – a remarkable increase in a short period.
Globally, money supply has grown by nearly USD 73.74 trillion (almost 200%) since 2007, significantly eroding the U.S. dollar’s value, which has lost more than half its purchasing power in the past 12 years. This gradual loss of purchasing power makes gold an increasingly attractive, reliable store of value worldwide. Gold benefits doubly in such phases – as opportunity costs fall relative to interest-bearing assets and demand for real assets rises. However, this unchecked growth in global money supply also pushes up stock indices, real estate, cryptocurrencies, other tangible assets, and living costs.
2. Bond Bear Market: With global debt at historic highs and bond markets weakening, gold has strengthened as an alternative investment.
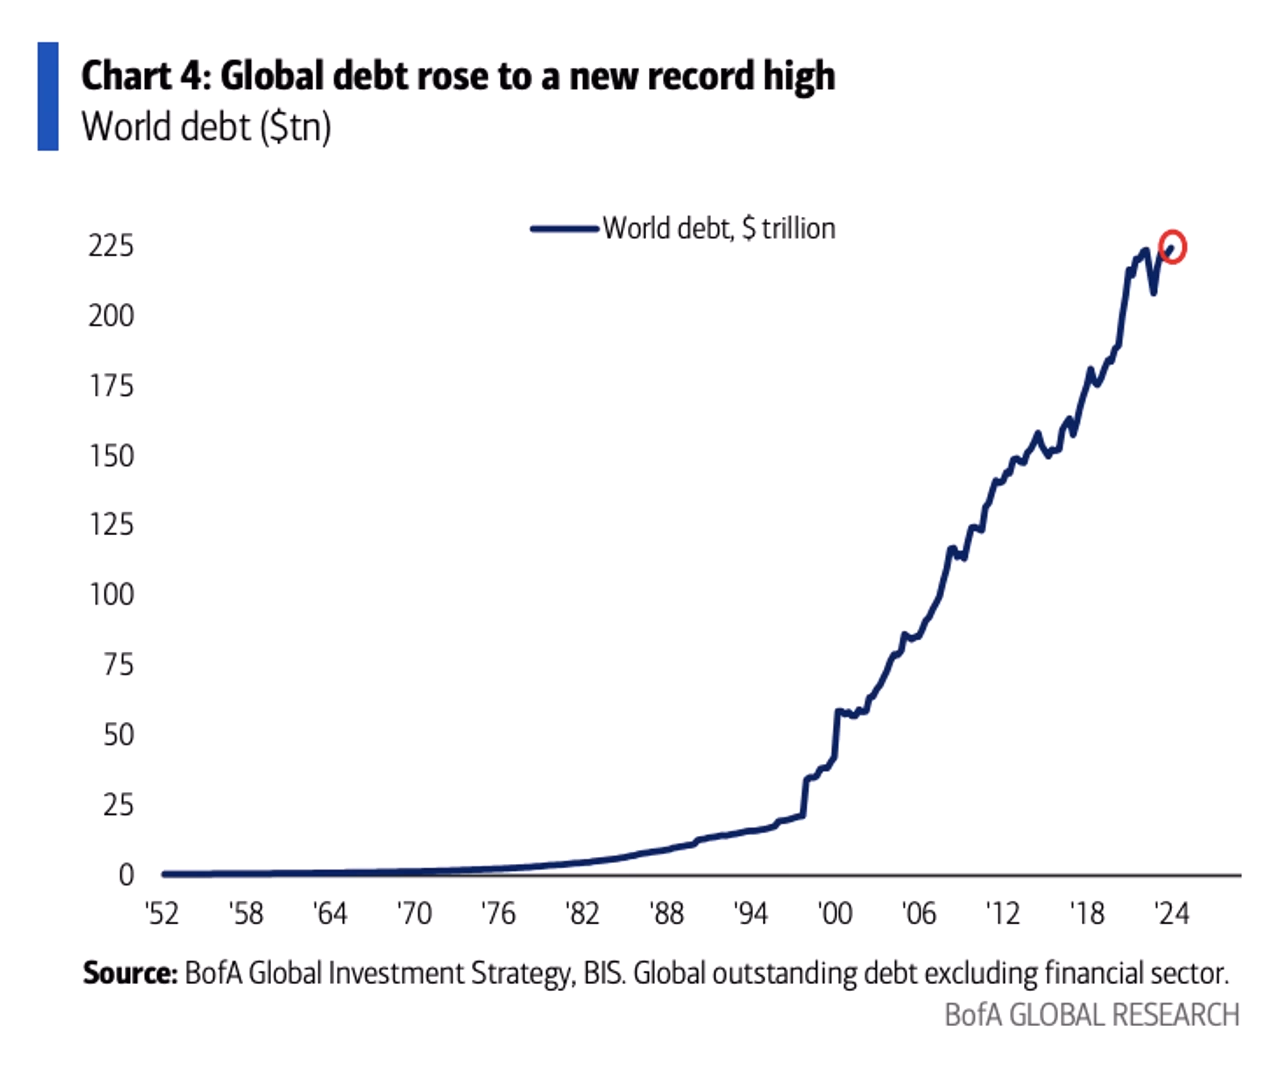
Global debt, in trillions of USD, as of September 4th, 2025. Source: Bank of America, Bank for International Settlements (BIS)
Global debt has reached historic levels, forming a crucial foundation for rising gold prices. U.S. national debt has more than sextupled since 2000, climbing from USD 5.77 trillion to USD 37.32 trillion. Worldwide debt has surged to a record above USD 230 trillion and has been rising rapidly since 1997. The 40-year bond bull market ended in 2022, aggravating the situation as rising interest rates strain debt sustainability. Investors now demand higher yields to finance longer-term debt amid high inflation. Increasingly, governments will be forced to buy back their own bonds.
This bond market reversal has given gold a new role as an alternative investment vehicle. Rising rates and falling bond prices negatively impact investors traditionally favoring fixed income, making precious metals more attractive for hedging and diversification. A weak bond market thus provides structural support for gold, leaving institutional investors seeking conservative yet value-retentive alternatives with few options besides gold.
3. Central Bank Purchases: Major net buying, led by China but also Poland, India, and others, provides steady support
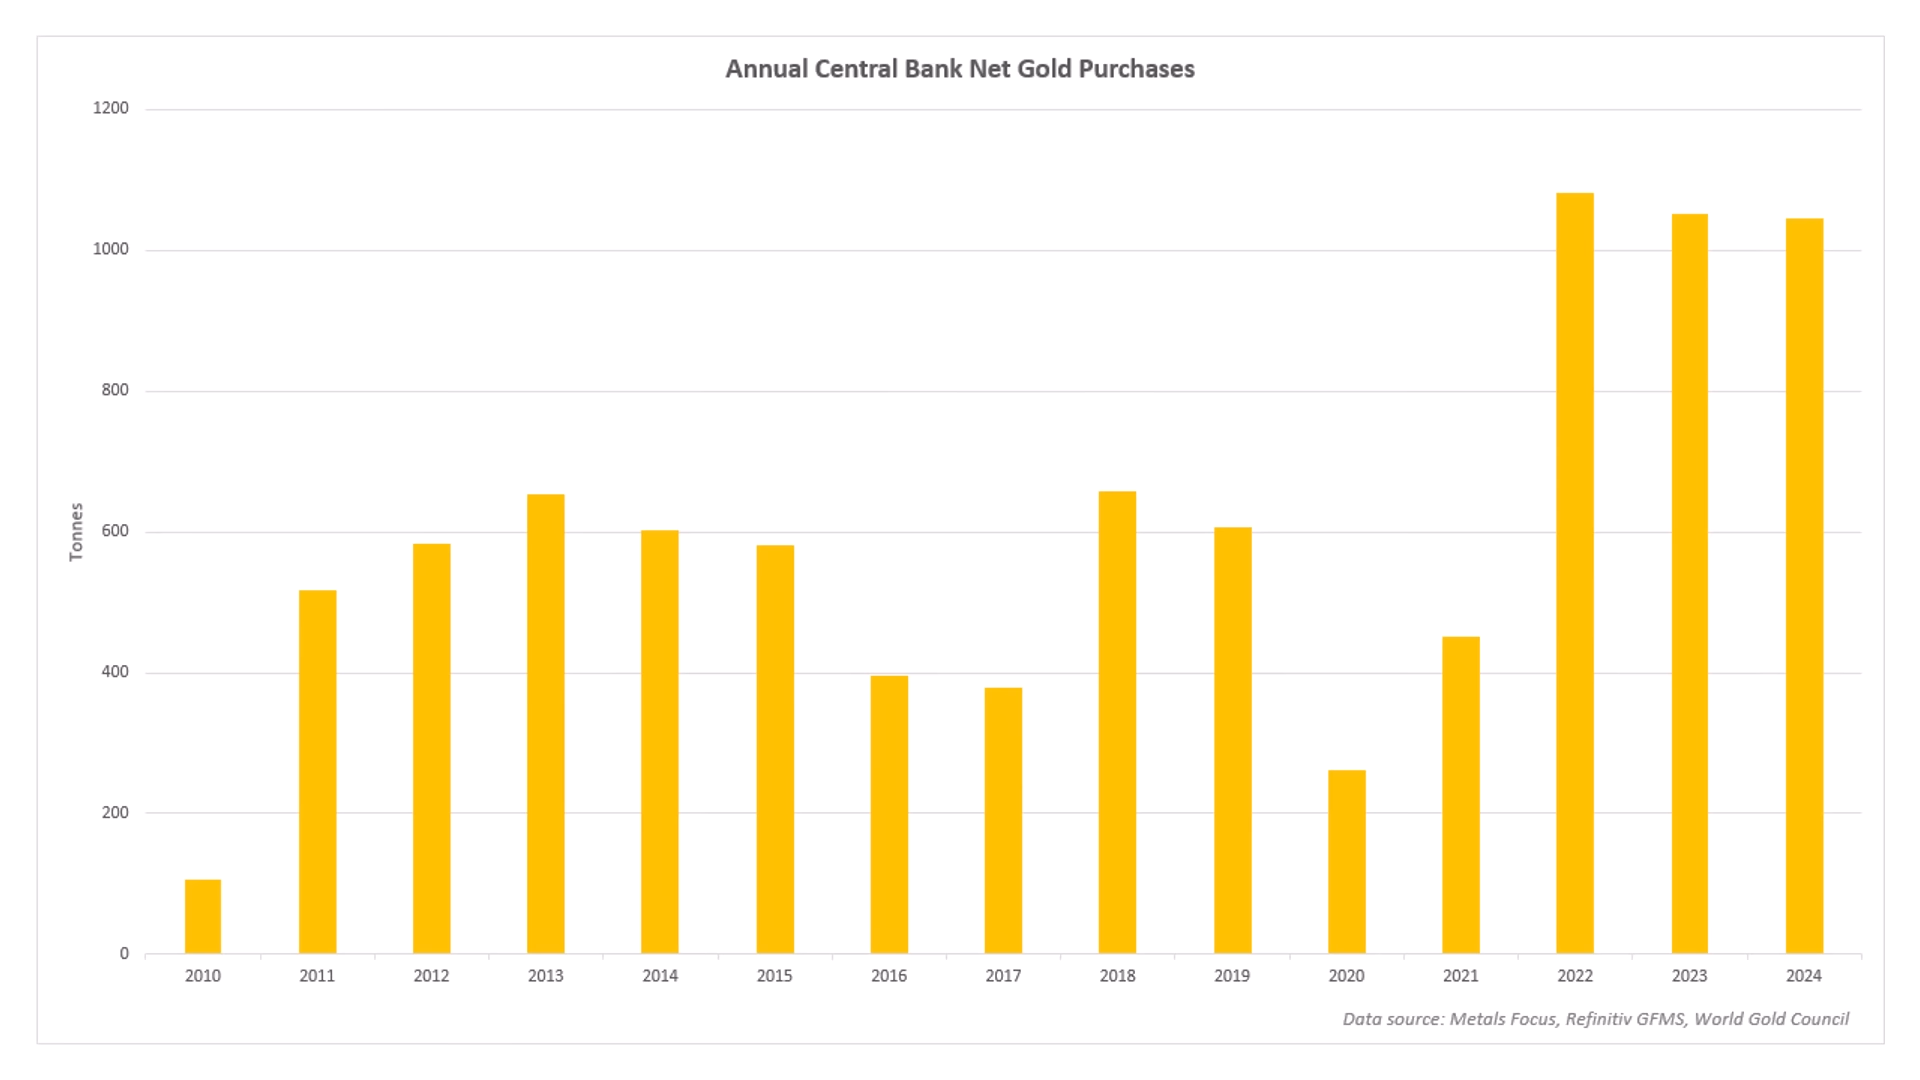
Annual net gold purchases by central banks, as of September 4, 2025. Source: Metals Focus, Refinitiv GFMS, World Gold Council
For several years, many central banks worldwide have become significant net buyers of gold. Their motives range from diversifying currency reserves and reducing U.S. dollar dependence to hedging against geopolitical and monetary risks. This steady institutional demand provides a solid foundation while simultaneously reducing available market supply—a distinctly bullish signal for gold prices. The People’s Bank of China (PBOC) in particular continues its massive gold purchase strategy unabated, steadily expanding reserves through the first eight months of 2025 to an official total of around 2,302 tonnes as of August. This includes nearly 5 tonnes added in February alone. China’s sustained buying forms part of a targeted diversification strategy to reduce U.S. dollar reliance and broaden currency reserves.
China’s Expanding Gold Reserves
The increasing gold reserves also serve as protection against economic uncertainties and geopolitical risks. Experts suspect China has accumulated much more gold through secondary market purchases than officially disclosed, implying even larger actual reserves. China’s central bank buying has significantly influenced the global gold market, pushing prices higher over the past three years.
Other central banks – including Poland, India, Kazakhstan, and the Czech Republic – also made substantial acquisitions early this year. Overall, net central bank purchases in the first quarter of 2025 totaled about 244 tonnes, 24% above the five-year average despite a slight decline from the previous quarter. These purchases highlight gold’s growing importance as a strategic reserve asset amid geopolitical tensions, inflation fears, and a widespread desire to reduce dependence on the U.S. dollar. According to the World Gold Council, 2024 marked the 15th consecutive year of global central bank reserve increases, with this trend expected to continue.
4. China & Shanghai Gold Exchange: China’s strategic push, both official and private, and the rise of the SGE have reduced the West’s dominance in gold trading and given China growing influence in global financial markets.
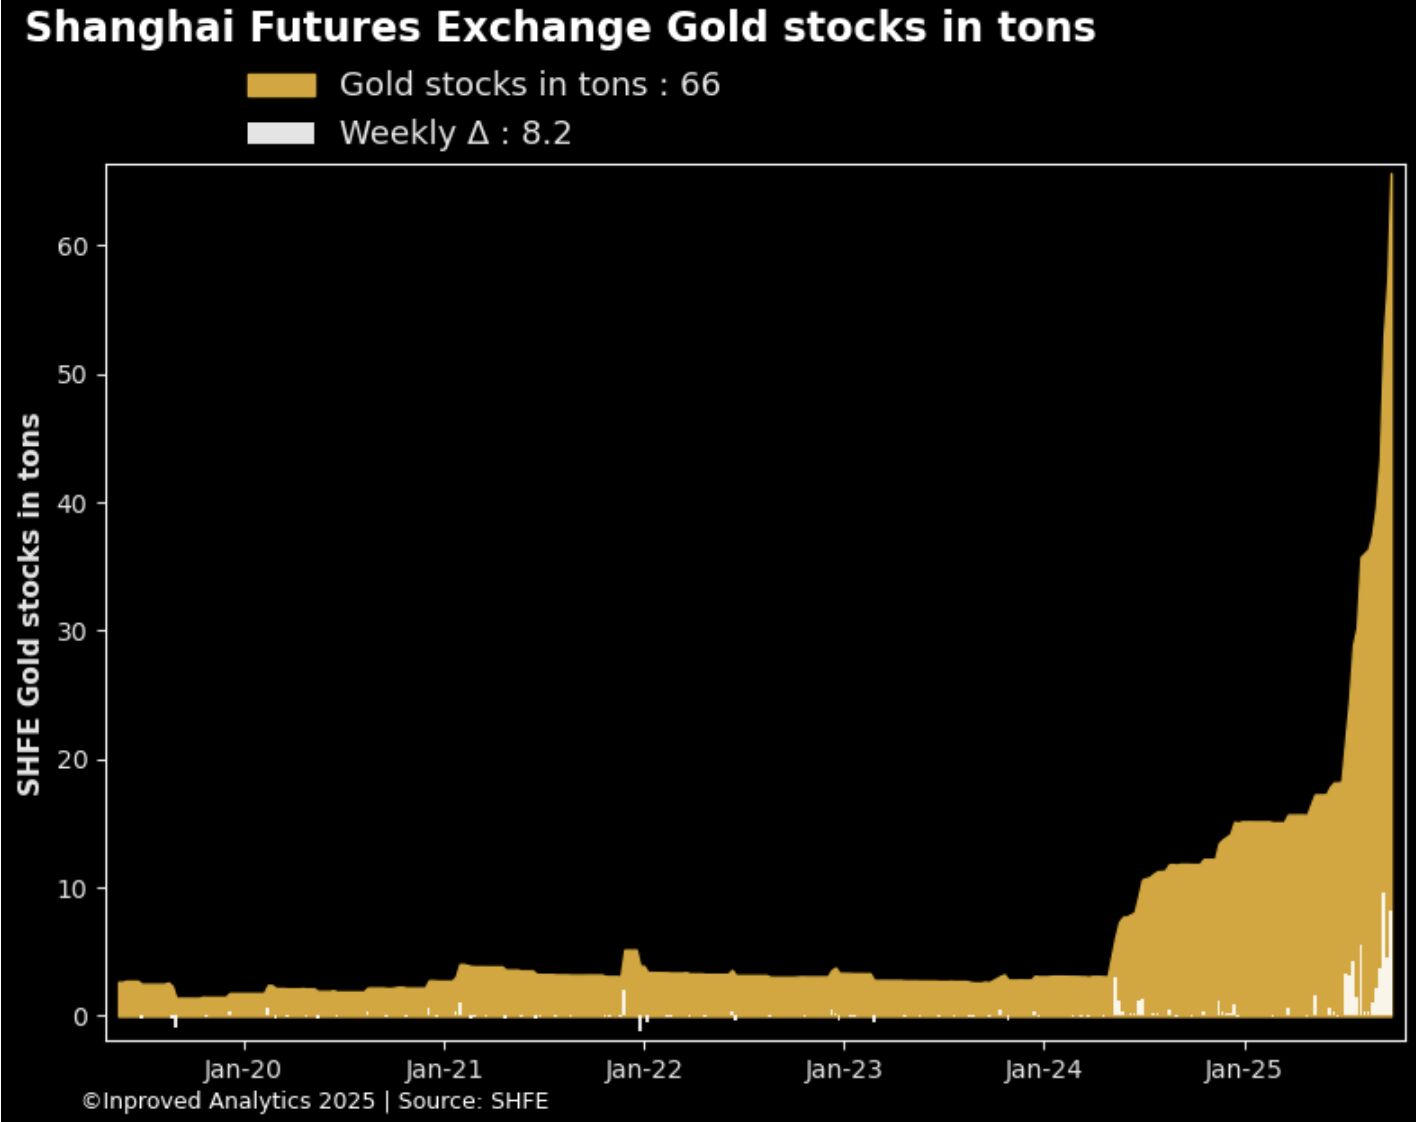
Shanghai Futures Exchange gold holdings in tonnes, as of September 26th, 2025. Source: InProved
China’s strong gold demand attracts special attention. Besides the central bank, private households continuously build their gold holdings, reflecting both a cultural tradition and a dual role of gold: as a strategic insurance against geopolitical tensions and as a favored form of private wealth protection under China’s strict capital controls.
The Shanghai Gold Exchange (SGE) has become pivotal in the global precious metals market, operating as Asia’s largest precious metals exchange and China’s official gateway for physical gold trading. Since its founding in 2002 and international opening in 2014, the SGE has grown into a crucial platform. Unlike Western markets dominated by paper gold or derivatives, physical gold is primarily traded at the SGE, giving it major significance for real demand.
China’s Strategic Move to Set Gold Prices, Challenge Western Dominance, and Expand Global Financial Influence
China also sets its own gold price through the SGE, often markedly above Western prices in London and New York, driven by strong domestic demand and export controls. The SGE is a strategic tool for the Chinese central bank, aiming to attract international central banks to store gold reserves in Chinese vaults via this exchange. Shanghai thus positions itself as a global hub competing with established Western gold markets, enhancing Beijing’s influence in precious metals and global finance. This development has shifted control of the gold market away from Western paper traders over recent years. China has taken a strategic power move, seeking to control foreign currency reserves, challenge U.S. dollar dominance, and eventually diminish it.
The PBOC actively encourages allied central banks to buy gold via the SGE and store it in China, strengthening Beijing’s role and shifting the global financial order in China’s favor. The SGE serves as the world’s largest physical precious metals exchange, managing over 12,000 tonnes of gold and providing an international platform for new gold purchases and storage. By establishing a ‘treasurer’ status for foreign reserves, China intends to reshape the financial system and reduce reliance on the dollar-based order. This initiative comes amid heightened geopolitical tensions and worldwide monetary policy shifts.
Gold Price Rally: Liquidity, Central Banks, and China’s Influence
In summary, the four fundamental drivers – massive global liquidity growth, the bond bear market, ongoing central bank gold purchases, and China’s unique role and the Shanghai Gold Exchange – form a very powerful foundation for the current gold price rally. The relentless erosion of U.S. dollar purchasing power due to unprecedented money supply expansion, combined with the debt crisis and volatility in traditional assets, makes gold an indispensable safe haven for investors.
Even participants from other market sectors respond—for example, Tether Holding’s weekly purchases of at least one tonne of physical gold to secure their huge interest gains from their stablecoins in tangible assets, further supporting demand and tightening market supply. Among central banks, China’s aggressive buying strategy alongside nations like Poland, India, and Kazakhstan stands out as a key influence on the gold market. The Shanghai Gold Exchange acts as a significant global hub for physical trade, boosting China’s influence and altering market dynamics to favor greater physical demand. This combination of macroeconomic conditions and institutional demand pressure creates a very robust foundation poised to push gold prices much higher in the medium and long term.
7. Conclusion: Gold – Euphoria with Warning Signs
After months of sideways trading, gold regained strong upward momentum in late summer, reaching a fresh record high at USD 3,791. With gains of nearly 45% in dollars this year, the metal is firmly in bull territory. Silver has recently shown even greater relative strength, pushing towards its historical high near USD 50.
Charts show gold is overbought, momentum is slowing, and sentiment is euphoric – all flashing caution ahead. Silver may still provide some short-term fuel, potentially lifting gold towards USD 4,000 this autumn. But a sharp correction is highly likely to follow, shaking out new weak hands before the next leg up resumes.
By mid-December, gold is expected to stabilize and resume its long-term uptrend, setting the stage for new highs above USD 4,000 – 4,300 in spring 2026.
“September 28th, 2025, Gold – Euphoria with Warning Signs on the Horizon” – analysis was initially published on September 27th, 2025, by www.celticgold.de and translated into English on September 28th, 2025.
Feel free to join us in our free Telegram channel for daily real time data and a great community. If you like to get regular updates on our gold model, precious metals and cryptocurrencies you can subscribe to our free newsletter.
Disclosure:
This article and the content are for informational purposes only and do not contain investment advice or recommendations. Every investment and trading move involves risk, and readers should conduct their own research when making a decision. The views, thoughts and opinions expressed here are the author’s alone. They do not necessarily reflect or represent the views and opinions of Midas Touch Consulting.

