


Bitcoin – Triangle within triangle
There is a variety of possibilities of drawing chart formations. Trading is an art form not a science. Beauty is in the eye of the beholder. In our previous chart book we were suspecting, now that all professionals are participating in the crypto space, there to be some dramatic spike out price action to be happening. And so it did. Shaking out weak hands. We posted various reload entries for our larger time frame positions, live in our Telegram channel. Previous weeks gave away strength from price action demonstrating the control of the bulls. The last week wasn’t any different, even though we had steady declining prices. Bitcoin – Triangle within triangle.
The battle isn’t necessarily over, but trading price behavior tips its hand
September 19th 2019, BTC/USDT, daily chart, bitcoin-triangle within triangle:
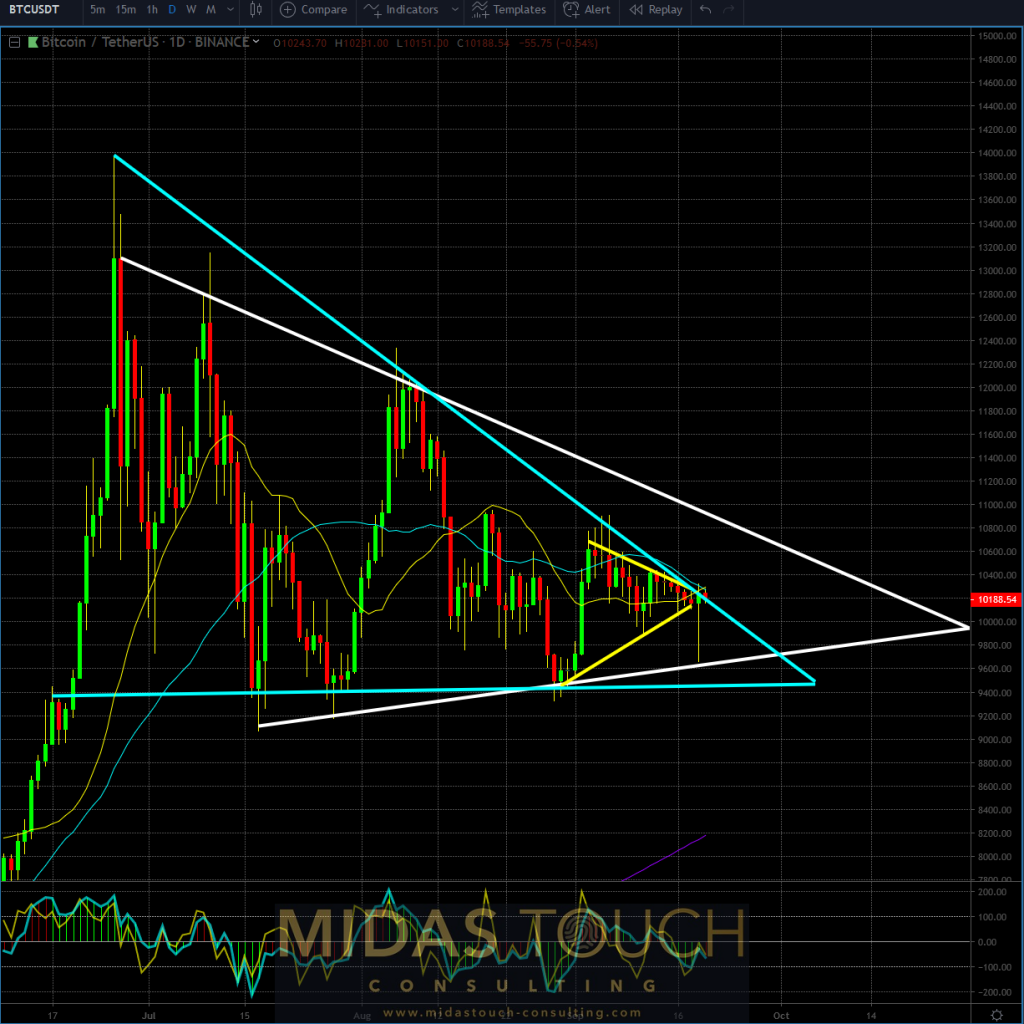
Bitcoin in TetherUS, daily chart as of September 19th 2019 a
Last weeks tightening range represented by the yellow triangle, finally gave way to lower prices as many predicted. We stayed aggressively long enduring larger than unusual stops on our reload positions since a lack of news did not support this bearish behavior. A typical ill-liquid time of day chosen by those driving prices lower and triggering stops was the final giveaway.
The support level of the white triangle allowed for more capital exposure for the astute market participant.
Where to look for the larger picture directional give away?
Bitcoin-triangle within triangle, BTC/USDT, daily chart September 19th 2019, “inverse head and shoulder formation”:
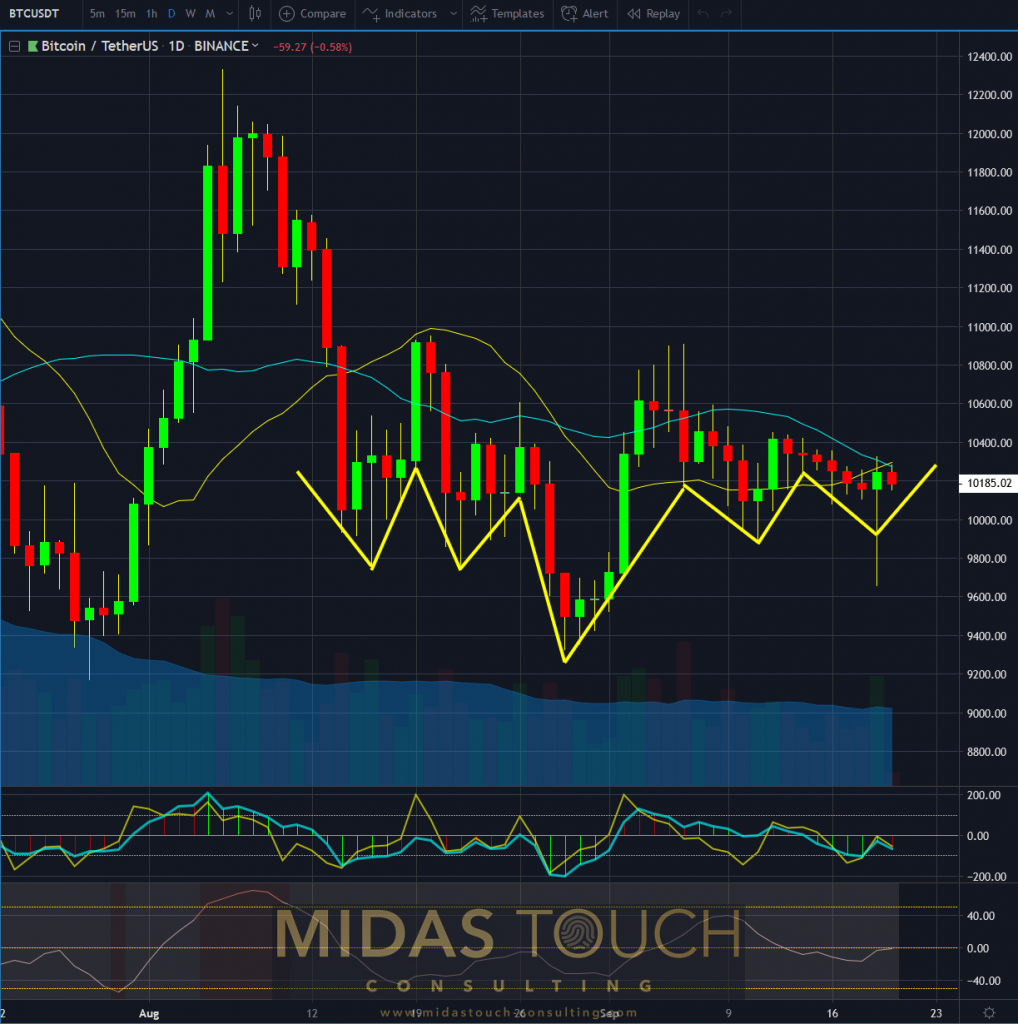
Bitcoin in TetherUS, daily chart as of September 19th 2019 b
The left shoulder in the daily chart above shows clearly, that in the past the price zone of US$9,800 to US$10,000, provided for similar volatility like this week’s Thursday washout. The dragonfly doji is a spot on sign for bullish consensus.
BTC/USDT, daily chart September 19th 2019, “down creep along the breakout zone”:
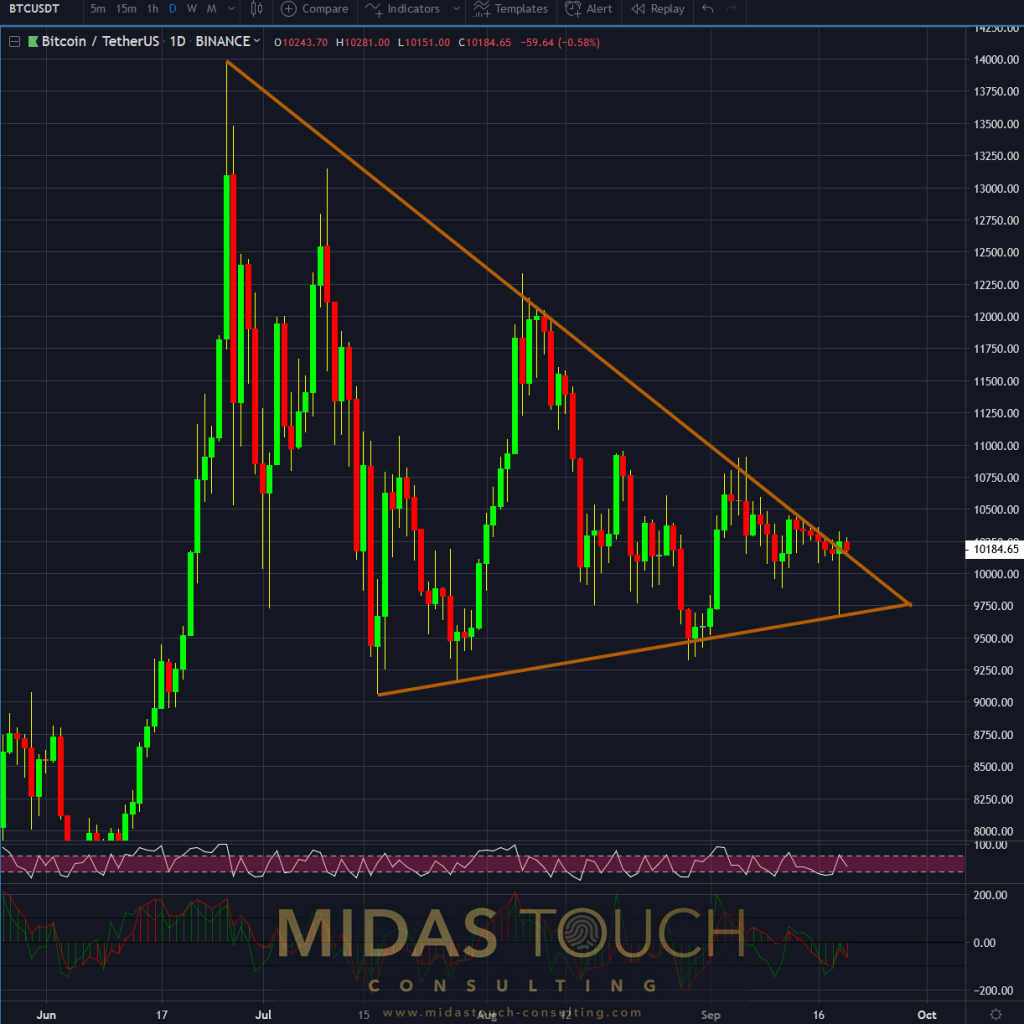
Bitcoin in TetherUS, daily chart as of September 19th 2019 c
Confidence of holding on to our long exposure the full way was based on this weeks trading behavior. Examining the daily chart above, one sees prices slowly creeping down along the upper support line. A helpful way to asses sentiment is simply imaging positions. First the long side than the short side:
- Longs were certainly exited at the beginning of the week with prices pressing against overhead resistance. A week of hope for prices breaking out to the long side, eroded on Thursday though.
- Imagining a short position, a week of declining prices makes one feel partially comfortable, but scratching along a possible breakout line is certainly stressful.
It is these emotional strains on both sides that professionals can build their plays around to take money out of weak hands.
The emotional significance of the US$10,000 level has proven this week one more time that bears struggle to successfully drive prices lower. This isn’t to say that they won’t win the battle eventually but investment risk is at this moment still by a few percentage points larger to the downside than the upside.
All charts timely posted in our telegram channel.
If you like to get regular updates on our gold model, precious metals and cryptocurrencies you can subscribe to our free newsletter.

