


Pat – Let the market decide
We are used to the paradigm of getting more rewards the harder we work. No such thing in trading. It is imperative to sit on ones hands most of the time. That is to say in the investment field money is made with patience not with exposing capital to the market at all times. Taming a proactive mindset like this can be quite difficult. A traders mindset needs to be developed and maintained and is vastly different in its guiding principles than regular life’s tasks. We will post reentries to the silver market live in our telegram channel, but for now the situation is a Pat – let the market decide.
Daily chart, silver/US Dollar 9/20/2019, “range top?” :
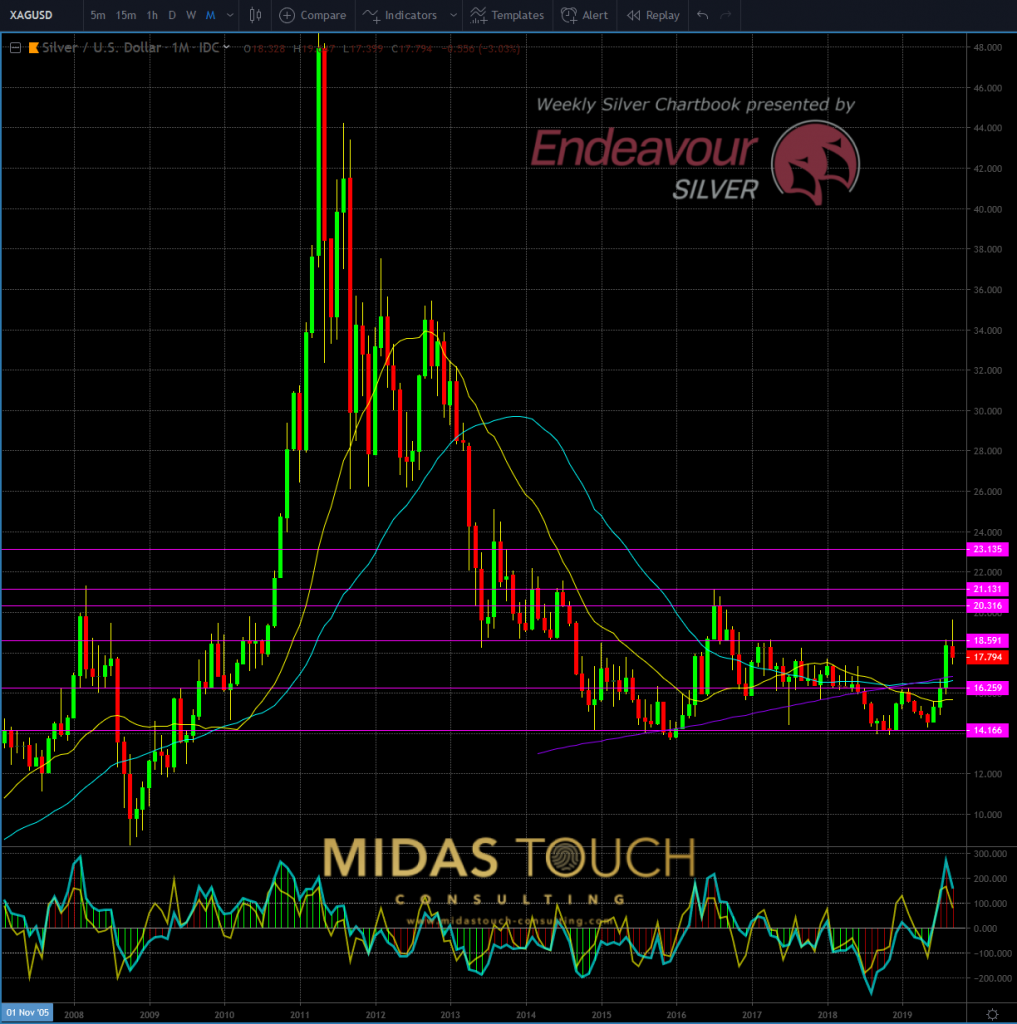
Silver in US-Dollar, monthly chart as of Sep 20th, 2019
Coulda, woulda, shoulda… it is but a guessing game here. We are looking at the monthly time frame chart above. Since it is only two thirds into the month we simply can only guess here. At the moment the last red candle indicates a possible reversal. This isn’t a closed candle just yet. Should price levels stay in close proximity we would have topped out here. Along the price range from the last three to five years. The highest likelihood probability, percentage wise.
Pat – Let the market decide, silver, daily chart, 9/20/2019, “be prepared”:
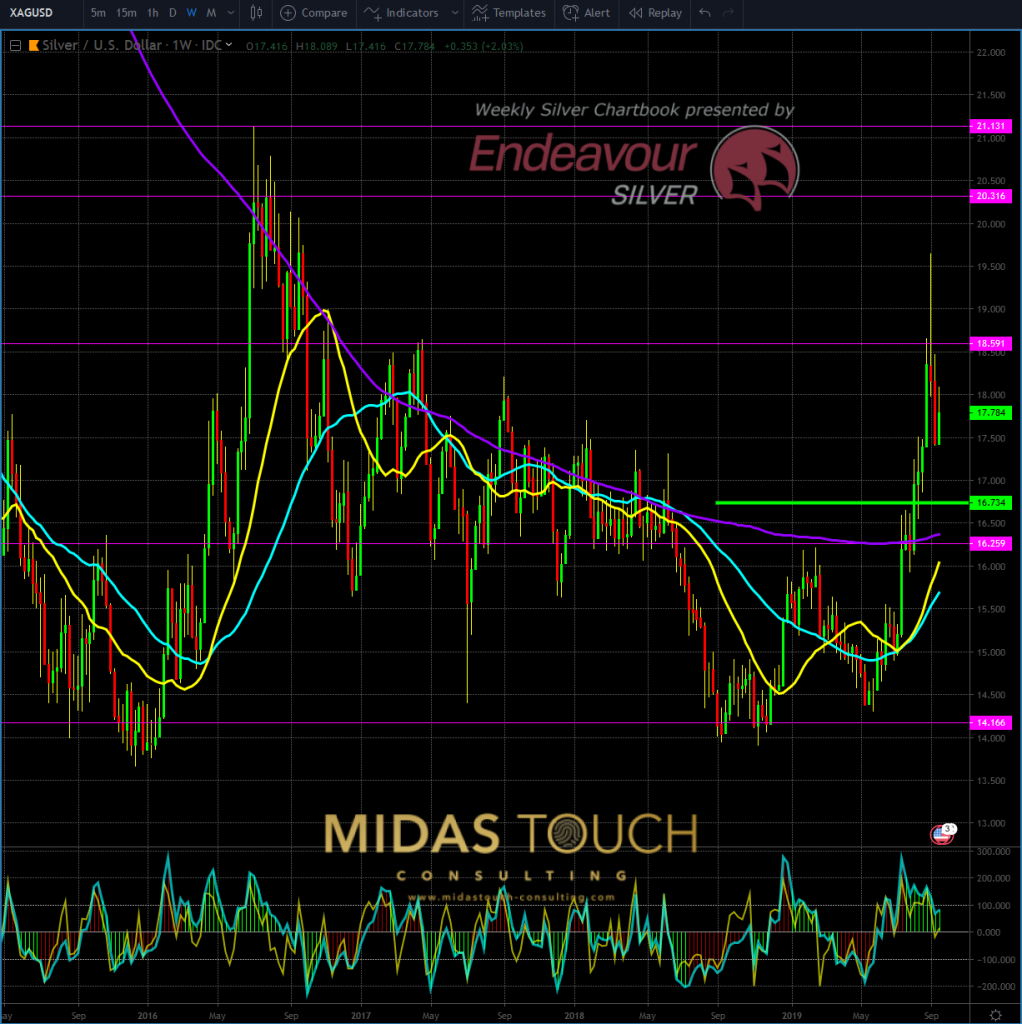
Silver in US-Dollar, weekly chart as of Sep 20th, 2019
That being said, as much as risk/reward doesn’t favor immediate long entries one always wants to be prepared. This especially in the precious metal sector where volatility can provide swift percentage moves in short periods of time. A look at a lower time frame, in this case the weekly chart (see above), points out a great opportunity. Only if prices decline that far that is. It is not that likely that prices should decline all the way to US$16.75. In the event of such an occurrence the combination of various factors deserves your attention. Among them a triple moving average support (the chart represents a simple moving average fan of settings 200, 40 and 20). Low risk conditions at that time would support aggressive market participation.
Daily chart, silver in US Dollar – September 20th 2019, “the majority of time prices move sideways”:
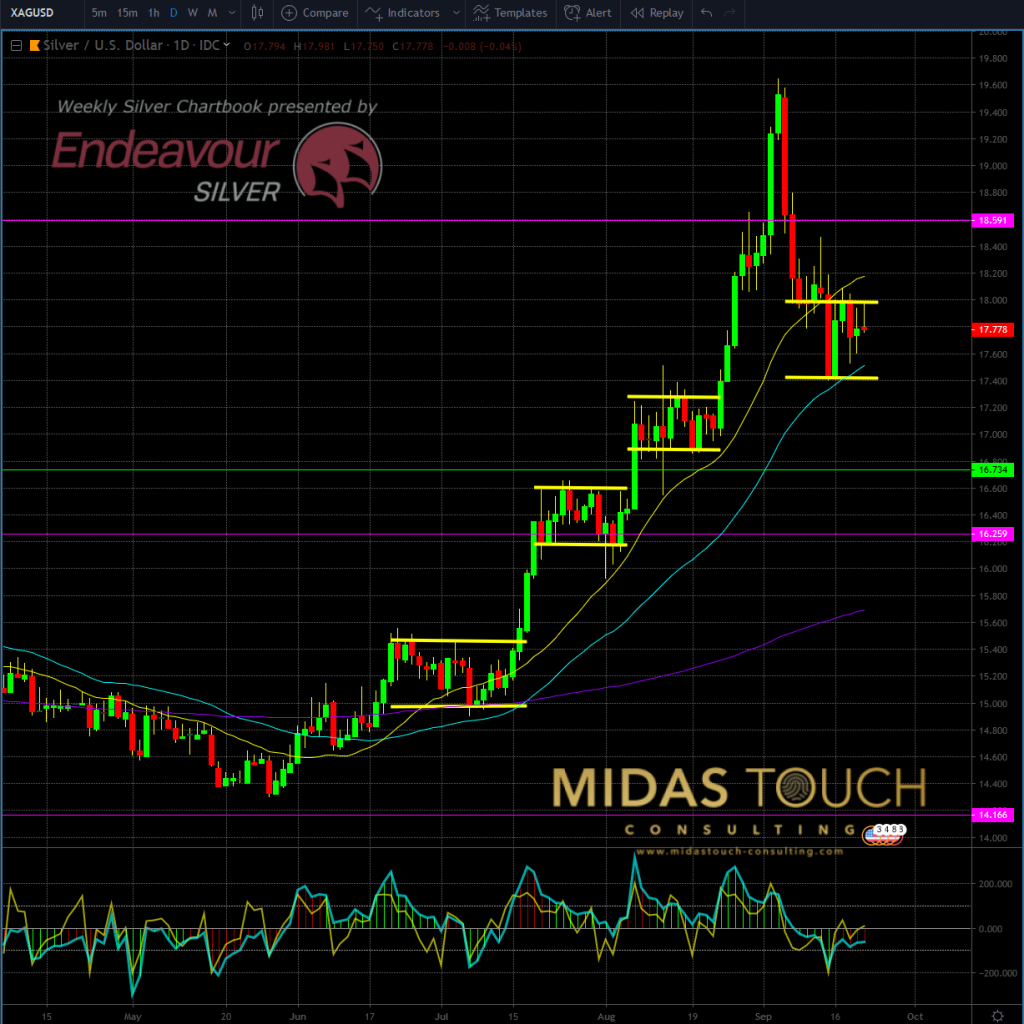
Silver in US-Dollar, daily chart as of Sep 20th, 2019
For the majority of time we as humans, expect for things to happen. And the recent past got these expectations met. That with quite a lengthy up move in the silver market. Let us not forget so that for the most part prices tend to trade sideways. Even in a volatile directional environment, that we have been exposed to – indicated in the yellow sideways ranges on the chart above.
Picking ones spots of entry wisely is crucial. Just because a trend is in place and identified correctly does not translate your market participation into winning trades. Many pieces of the puzzle need to be considered and fall into place for sensible capital exposure to create consistent results. One of these puzzle pieces is good timing, which translates into patience to refrain from capital exposure when the market is uncertain and hasn’t shown its hand just yet. In the momentary market environment that is much dominated by news, keeping on ones toes is key. Gold being this bullish and having different larger time frame conditions is to be carefully watched as well. From a daily chart perspective gold is ranging as well, but on a more bullish connotation. It will influence silver should it be breaking upwards.
Follow us in our telegram channel.
If you like to get regular updates on our gold model, precious metals and cryptocurrencies you can subscribe to our free newsletter.

