


Pre holiday opportunity timing
We pointed out risk, reward and psychological abnormalities of pre holiday trading in our previous chartbook. One always should reduce size for this sort of trading. Taking part if opportunity presents itself in pre holiday trading can be very rewarding. Weekly charts show low risk and in favor to take a position. This chartbook will guide on the various timing possibilities on how to enter into this holiday setup: pre holiday opportunity timing.
Weekly chart, BTC/USDT, December 19th 2019, “good risk reward ratios”:
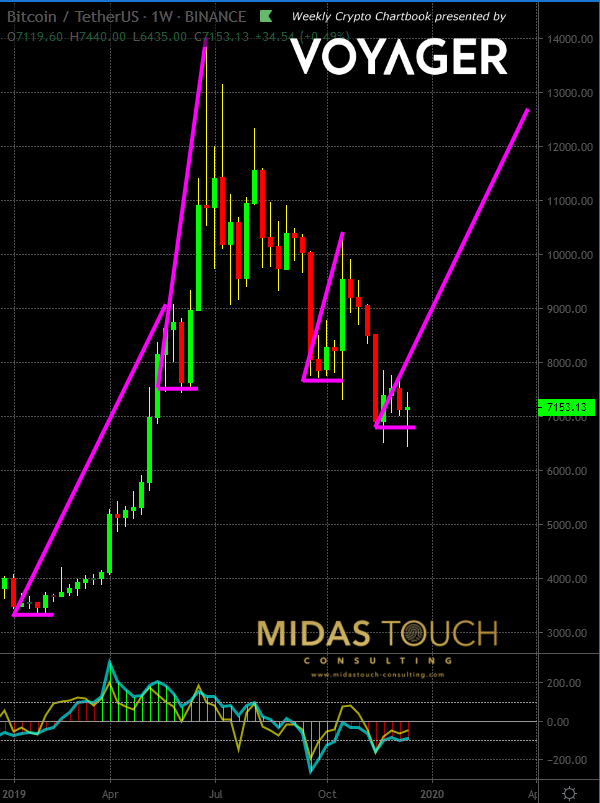
Bitcoin in TetherUS, weekly chart as of December 19th 2019 a
This weekly historical chart illustrates opportunity. Always after brief four to five weekly double bottoms bitcoin has seen positive advancements in price. For this reason we already posted an aggressive weekly time frame long entry live in our telegram channel. You’re not too late if you missed that entry.
Pre holiday opportunity timing, BTC/USDT, weekly chart, December 19th 2019, “good support”:
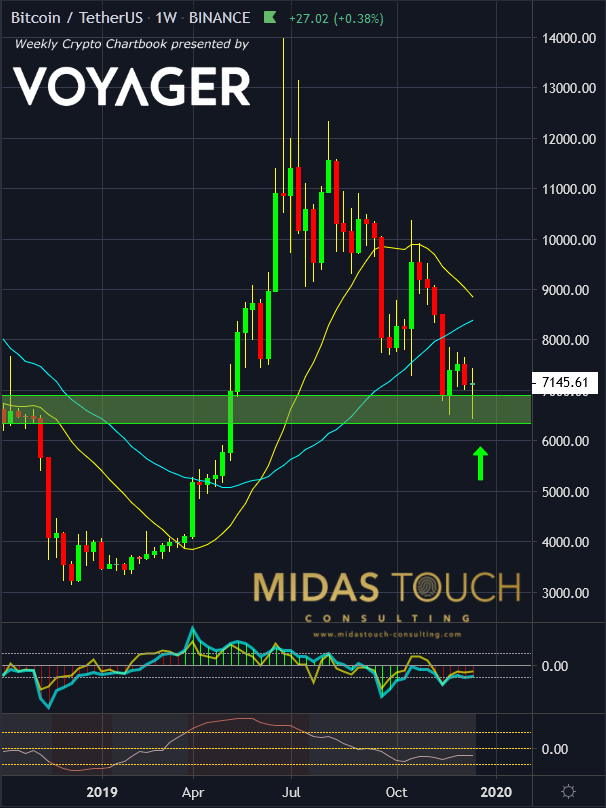
Bitcoin in TetherUS, weekly chart as of December 19th 2019 b
One chance to be on board is waiting for this week to close as a green candle. If we should be that lucky an entry at the open of the next weekly candle would be suitable for a longer term holding.
Prices having rejected the green band of a supply demand zone strongly and point towards a reversal.

BTC/USDT, weekly chart, 12/19/2019, “the weekend play”:
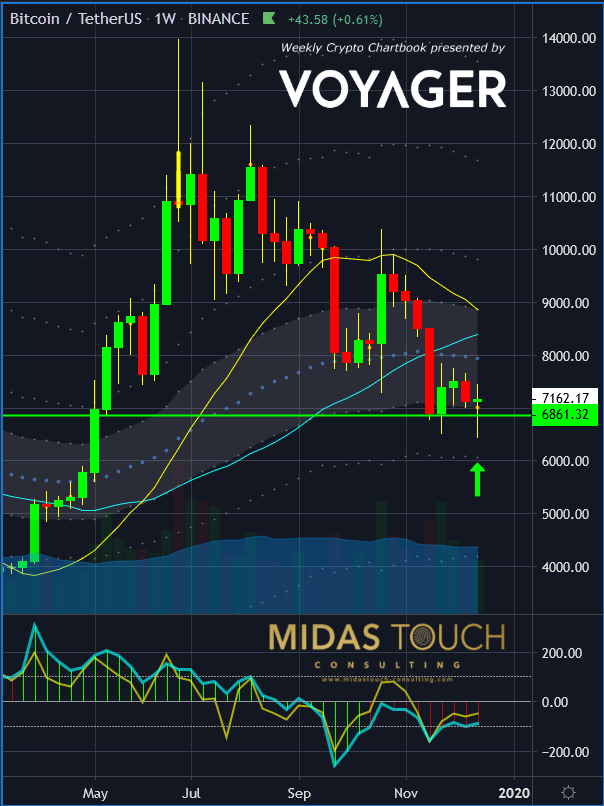
Bitcoin in TetherUS, weekly chart as of December 19th 2019 c
For those readers who trade anticipated versus confirmed, there is also a more immediate play. With prices trading in the upper range of the last weekly bar one can risk an immediate entry into the unfinished bar as well. For this we need to stack odds on lower time frames:
12/19/2019, BTC/USDT, daily chart, “entry fine tuning”:
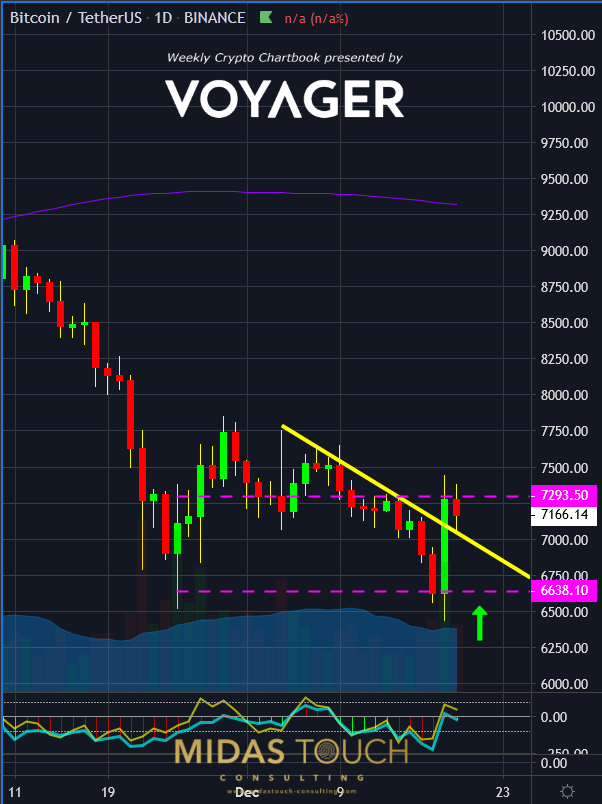
Bitcoin in TetherUS, daily chart as of December 19th 2019
Prices shooting through the entire range (dotted horizontal purple lines) on the 18th of this month promise strength. The 19th being a natural pause day after this action points towards Friday the 20th (and following) days to be prosper entry days at the open of the new bars.
Pre holiday opportunity timing:
Never force a trade. Never take a trade one does not feel comfortable with. In case recent chart books and their pointed out stacked odds of mid to end December trading resonates with your own approach, then the above entries might be of interest for your confirmations. Always trade half size or less on trading abnormalities like these.
All charts timely posted in our telegram channel.
If you like to get regular updates on our gold model, precious metals and cryptocurrencies you can subscribe to our free newsletter.

