


60 minute chart, silver/US Dollar 12/06/2019, “fading a range break”:
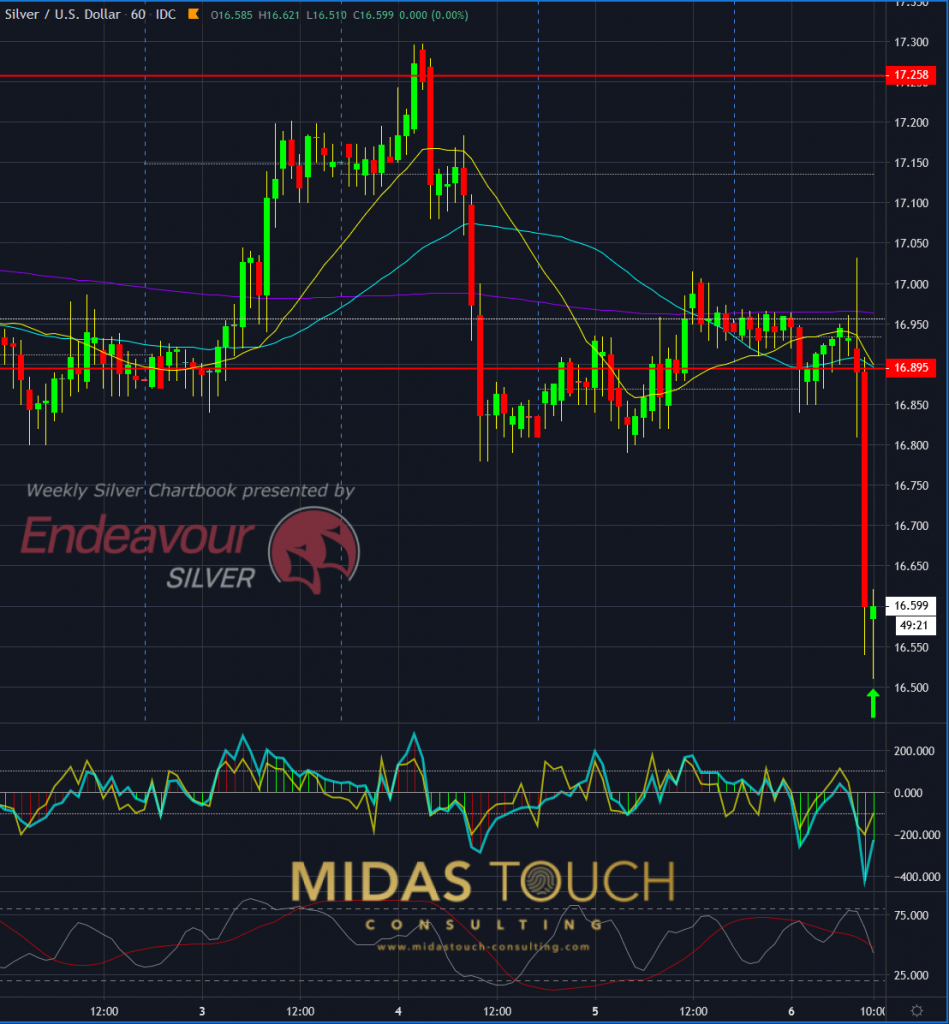
Silver in US Dollar, 60 minute chart as of December 6th 2019
The chart above shows our aggressive silver entry based on the action/reaction principle.
Time exits: exposure is risk, 60 minute chart, silver/US Dollar 12/07/2019, “absence of a bounce”:
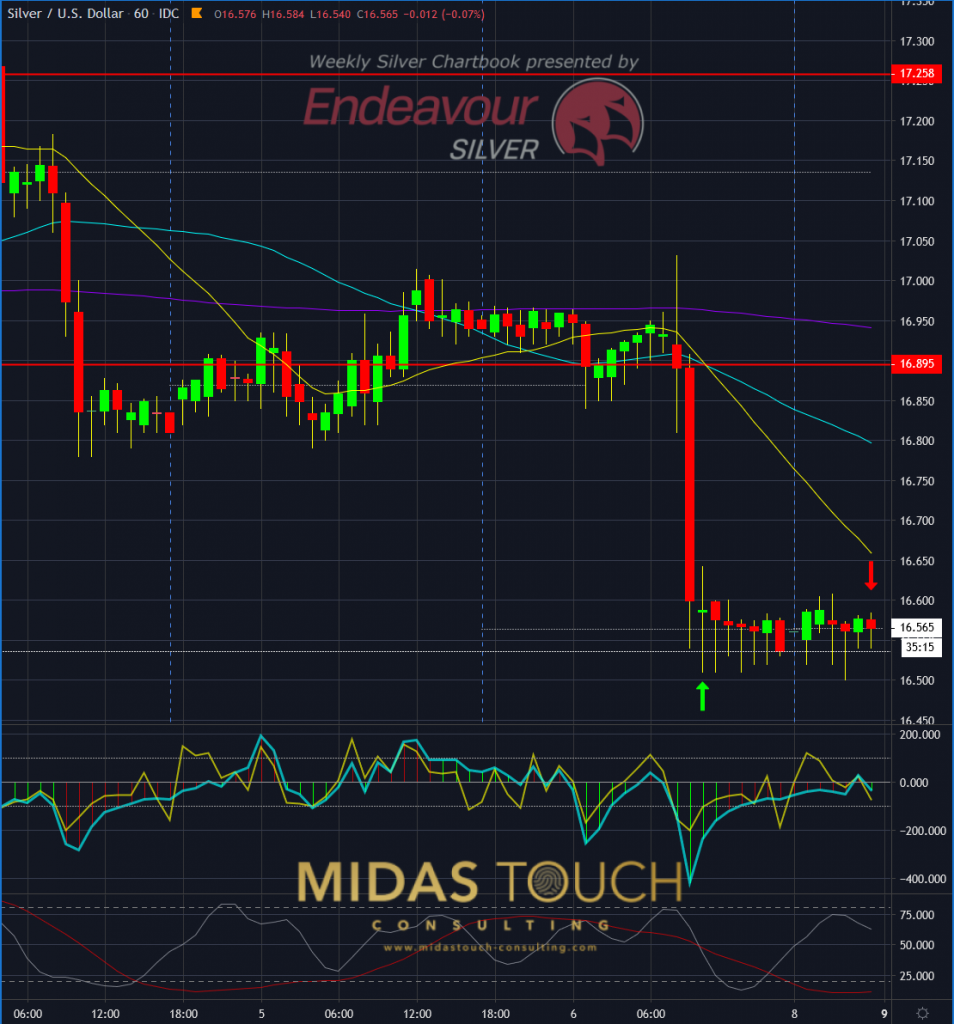
Silver in US Dollar, 60 minute chart as of December 7th 2019
With prices sitting dormant for 14 hours in a tight sideways range, absent of the anticipated bounce, time exit rules came into play. We tightened the stop and lowered the first financing target. A countdown had started.
All our trade adjustments were posted in real time in our telegram channel.

Silver/US Dollar 12/07/2019, 60 minute chart, “close observation of price behavior near range borders”:
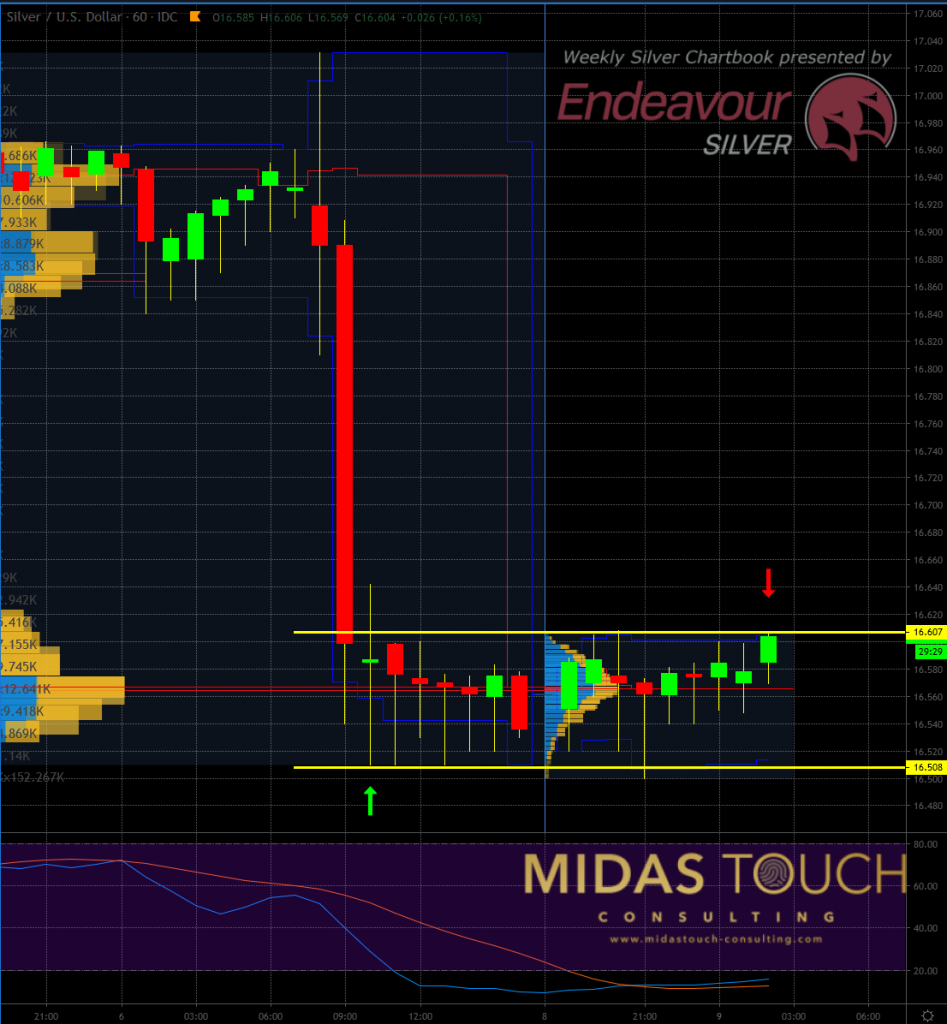
Silver in US Dollar, 60 minute chart as of December 7th 2019 b
With the help of a volume based market profile we planed to quickly take profits on the first attempt of prices to break out of the trading range. We assumed a reverse to the mean and wanted to conservatively reduce risk.
Silver/US Dollar 12/07/2019, 60 minute chart, “quick action”:

Silver in US Dollar, 60 minute chart as of December 7th 2019 c
The market acted as expected with a faded breakout. Consequently, we took profits (+0.55%). The remainder position was stopped out shortly after at break even entry prices.
Time exits: exposure is risk
We illustrated the time risk on a very small time frame here, but it is applicable to all time frames. It needs to be be used uniformly and especially on the higher time frames. Reducing overall exposure size is one more tool to avoid unwanted surprises.
Follow us in our telegram channel.
If you like to get regular updates on our gold model, precious metals and cryptocurrencies you can subscribe to our free newsletter.

