Silver shining in 2020, monthly chart, silver/US Dollar 01/06/2020, “great risk reward ratio”:

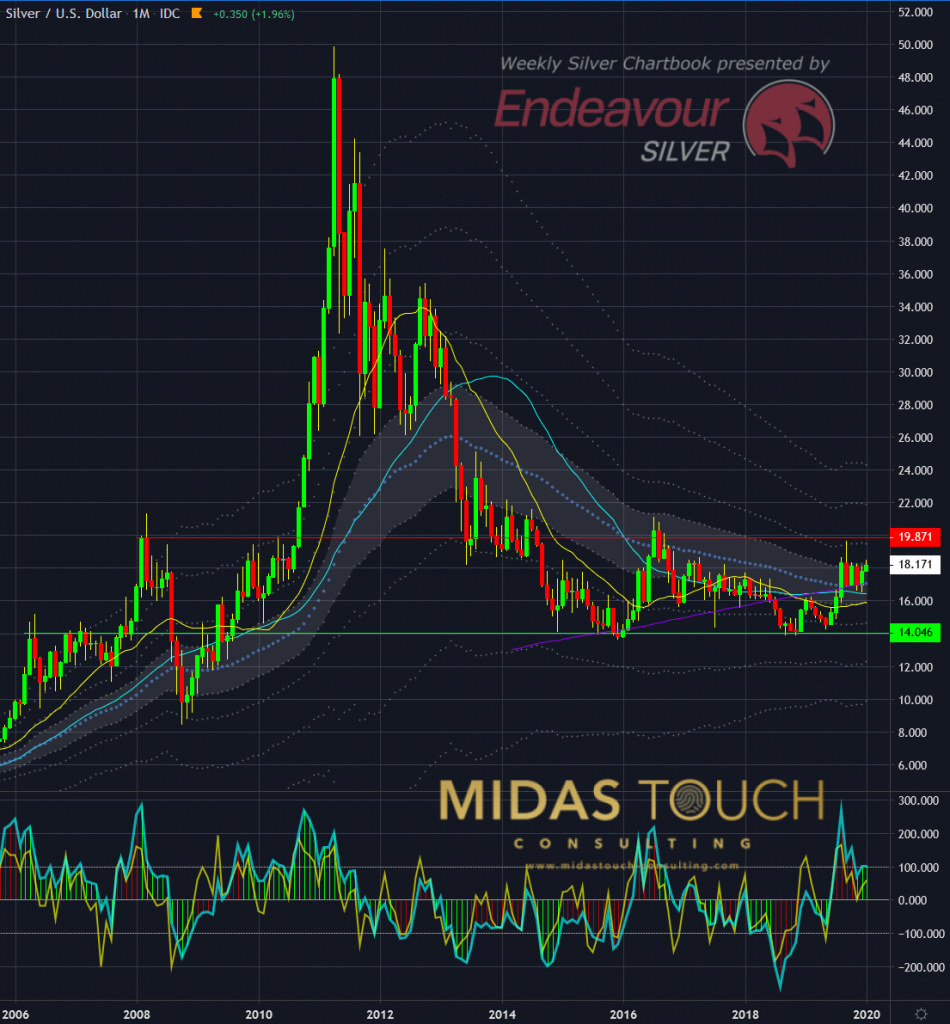
Silver in US Dollar, monthly chart as of January 6th 2020
The monthly chart above shows silver prices trading near the mean. This allows for expansion. Triple moving average support (Simple moving averages settings of 20, 40 and 200) can be interpreted as a good timing starting point for a price move. A break through the $20 overhead resistance would allow for a swift move to $26, $27. Besides a good support established now at $16, we find just below at $14 a solid supply and demand zone for silver prices. All in all an opportune large time frame view with a great risk reward ratio. As such we have been trading silver actively and post all our trades in real time in our telegram channel.
Silver/US Dollar 01/06/2020, weekly chart, “confirmed breakout”:

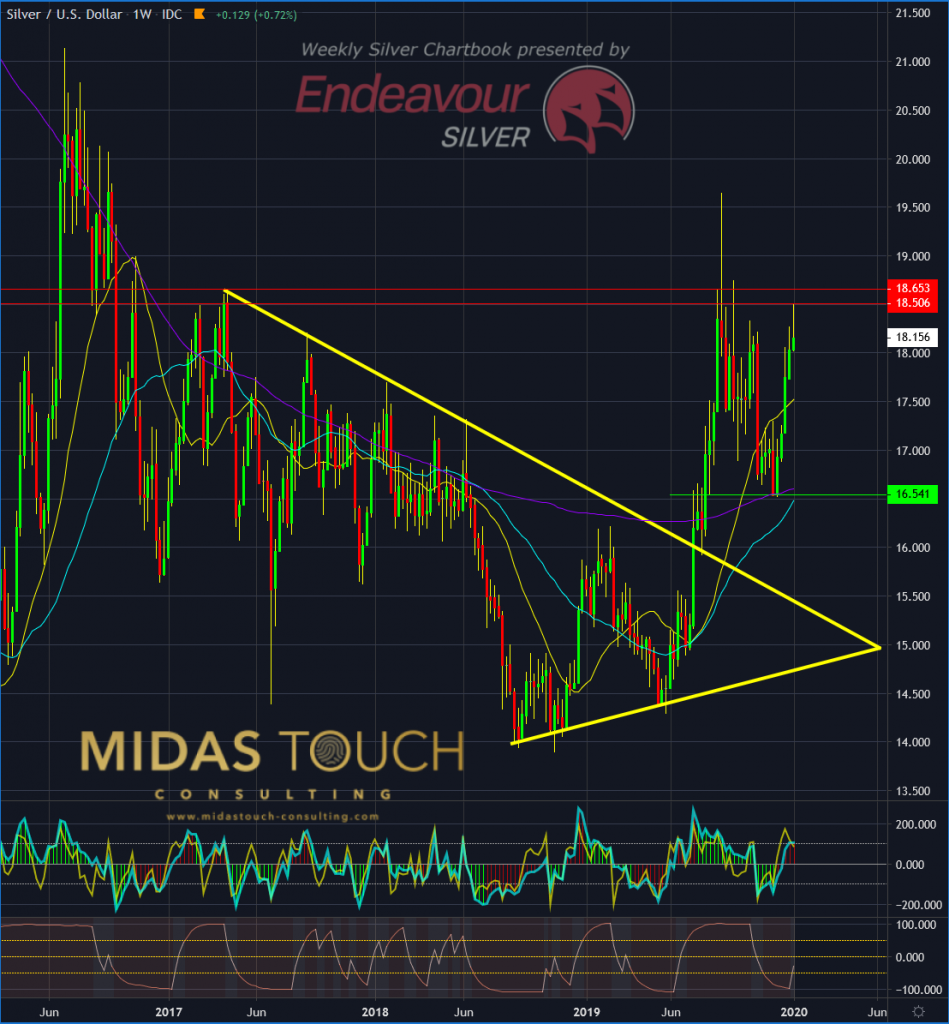
Silver in US Dollar, weekly chart as of January 6th 2020
Taking a look at the weekly chart shows confirmation. Prices have been breaking out from mid of last year of a consolidation period (yellow triangle). Prices advanced swiftly from a $14.50 to $19.50 for a substantial $5 gain. Since than a second leg up has been forming over the last ten weeks to support the direction of price. the weekly chart mutually provides for a promising chart into 2020 as of now.
Silver shining in 2020
In short, market manipulation ensures that prices, for now, are kept low while the real-world supply is dwindling due to an increased industrial demand coupled with an aggressive buying policy by central banks. The greater the instability in the world and in financial markets, the more people buy gold and silver and silver prices therefore rise along with gold prices.
Follow us in our telegram channel.
If you like to get regular updates on our gold model, precious metals and cryptocurrencies you can subscribe to our free newsletter.


