Bitcoin bounce buying opportunity
The bitcoin market at this point is offering a low risk entry point within the next 48 hours, so we felt compelled sharing our findings with our readers. A recent strong decline towards a supply and demand zone on the daily time frame allows for market participation. We see our job not in predicting the future but in participating in low risk opportunities that might evolve into true turning points. The mark we are speaking of right here does not necessarily warrant for great follow through. Hence the choice of our headline “Bitcoin bounce buying opportunity“. The crypto market being especially volatile and unpredictable, allows for buying possible bounces like these, since they can turn into true turning points.
With our quad exit strategy it is possible to create very low risk exposure. This allows for the market to decide if it is just a temporary bounce or a true change in direction. No need to risk the farm.
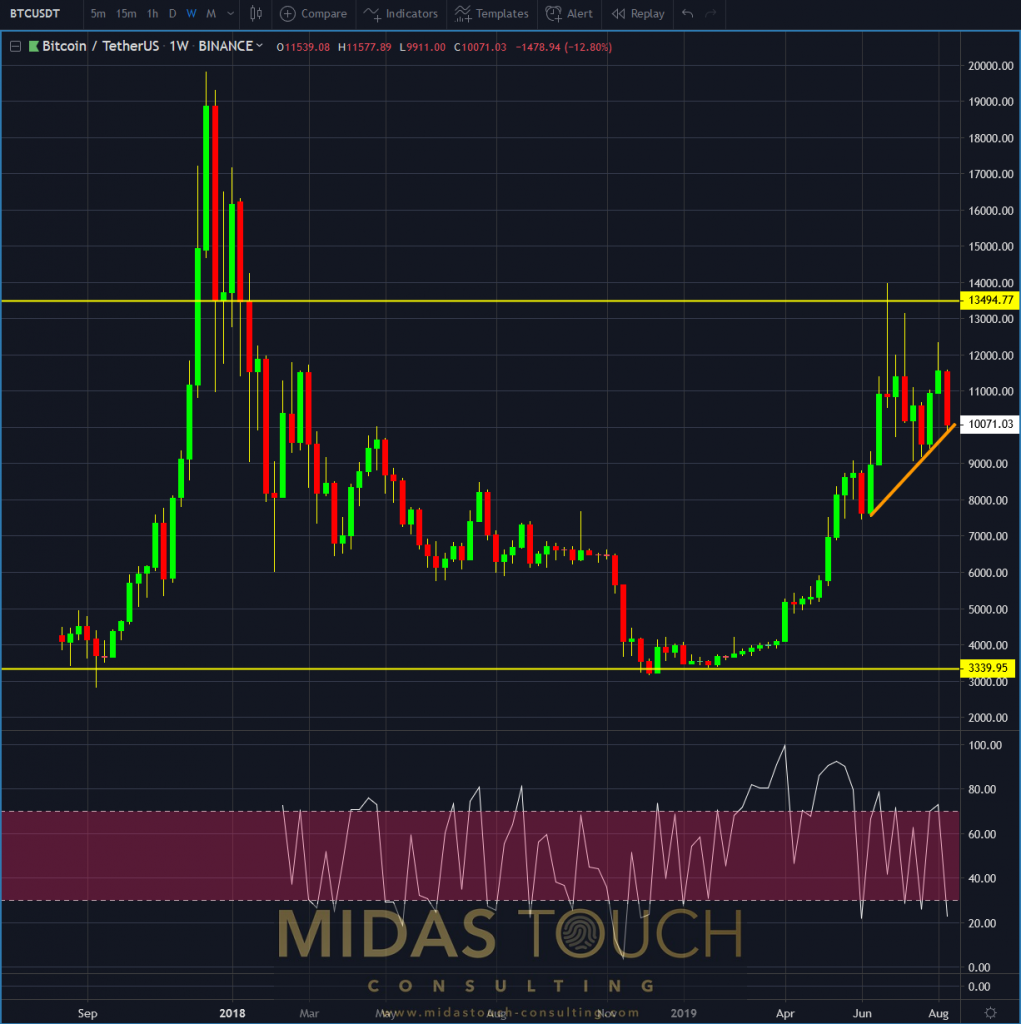
Monthly chart of BTC/USDT, 15th of August 2019, a bearish picture with the monthly close still uncertain but support reached:

Bitcoin in TetherUS, monthly chart as of August 15th 2019
The monthly chart above is not a bullish picture per se. It needs to be considered so that the very right candle still has two more weeks until completion. Keeping an open mind and being aware that the crypto market showed strong bounces and even resulting rallies right after is key. The atypical behavior of this asset class allows, even with this higher time frame supporting rather a bearish view, to engage in the markets at this particular spot.
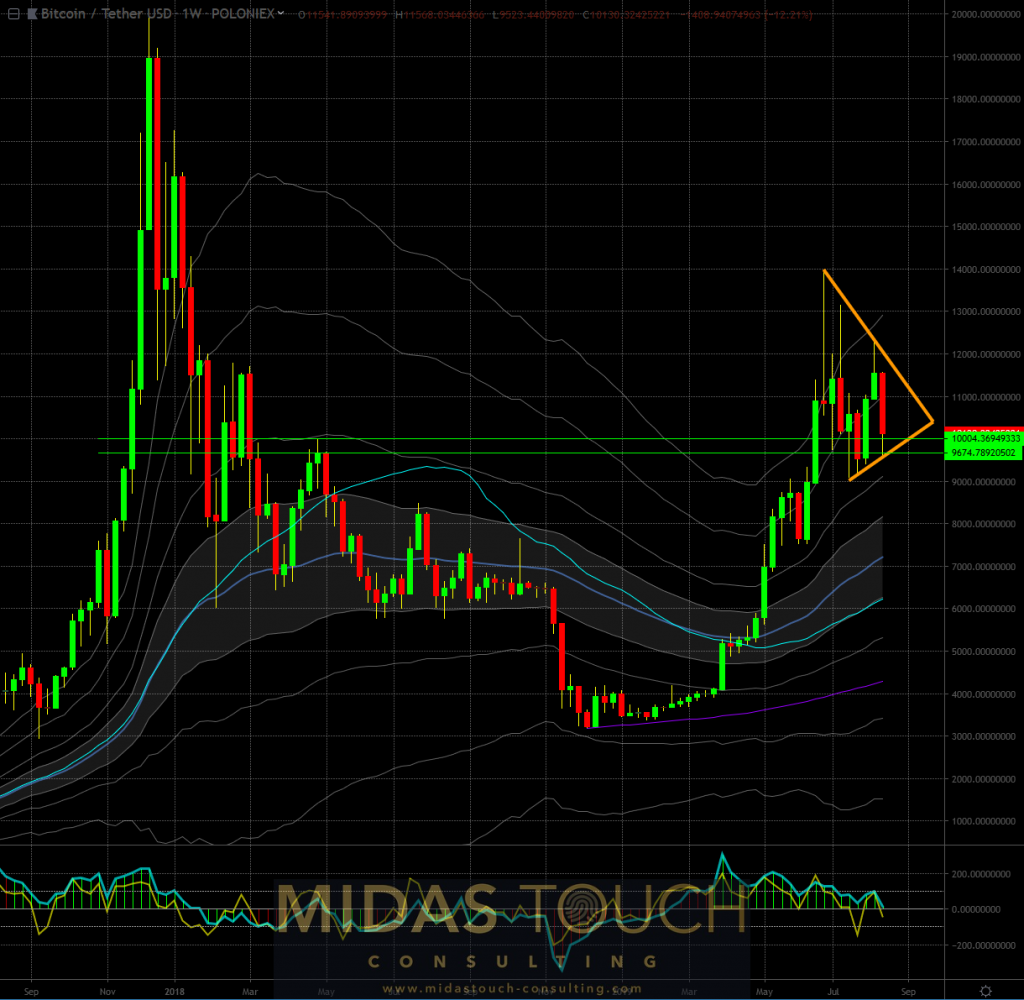
BTC/USDT, weekly chart August 15th 2019, bitcoin at support within a triangle formation:

Bitcoin in TetherUS, weekly chart as of August 15th 2019
The weekly chart points more clearly towards the opportunity. A support zone is evident and prices were bouncing strongly the last time trading at these levels. History might just repeat itself. Most traders buy breakouts from triangles as it provides the desired confirmation of a turning point with a possible follow through. This is an approach with larger stops and greater risk. We prefer to buy within a possible triangle forming at support. There is less clarity of market direction but risk is truly low.
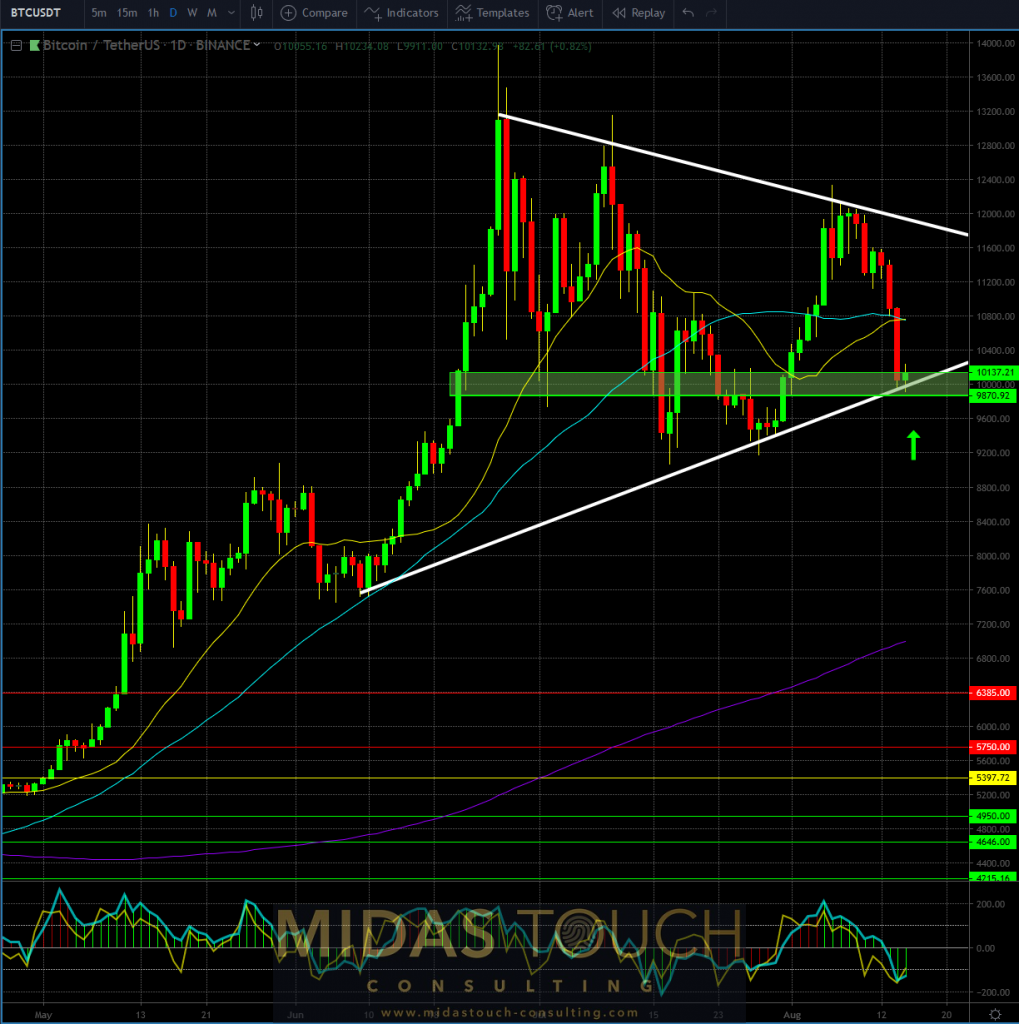
August 15th 2019, BTC/USDT, daily chart: bitcoin bounce buying opportunity:

Bitcoin in TetherUS, daily chart as of August 15th 2019
The daily time frame is clearly showing the opportunity with another layer of support. The green band represents this supply and demand zone. The true attraction in market participation is the tight stop placement that this entry provides with a quite attractive risk/reward ratio.
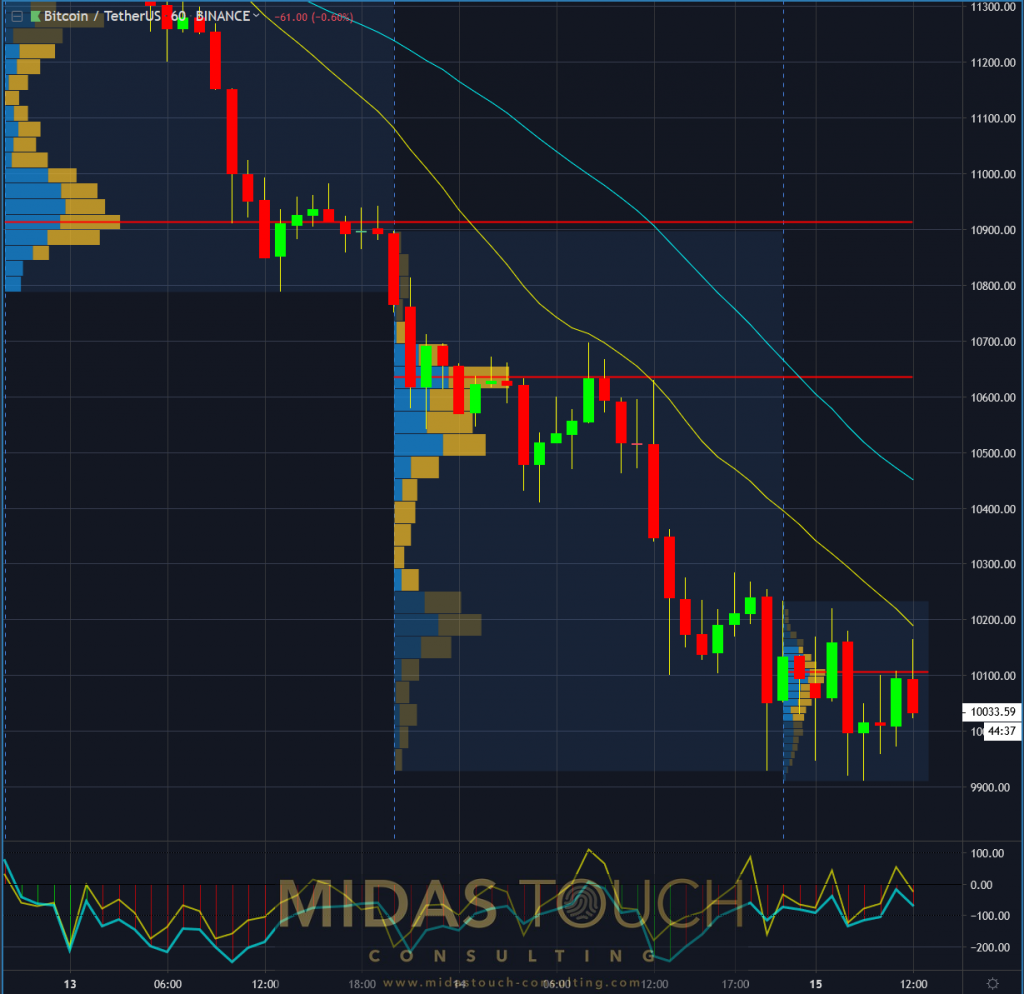
Bitcoin bounce buying opportunity, 60 minute chart of BTC/USDT, 15th of August 2019, watching closely:

Bitcoin in TetherUS, 60 minute chart as of August 15th 2019
One of the entry determining factors are a close observation of the trading behavior within the next few hours. An ideal scenario would provide a daily close near the US$10,100 mark. A relatively small retracement below these levels upon the opening of the Friday session would be expected and aggressive entries near the lows of the Friday lows keep risk at bay.
Should the momentary chart picture drastically change before the closing hour , all bets are off. This being a bounce play, capital exposure from a money management perspective, should be very conservative.
All charts timely posted in our telegram channel.
If you like to get regular updates on our gold model, precious metals and cryptocurrencies you can subscribe to our free newsletter.


