


Trending versus ranging
While the silver market currently trades within a being a price zone where rather exits than entries will be approached, we considered to look through a different lens in our weekly chart book this time. Since markets can change quickly please stay tuned to our telegram channel where we post in real time entries and exits for various markets. Trending versus ranging is a huge topic in market analysis. Especially technicians struggle with the identification of the two vastly different scenarios since their tools of indicators and oscillators are only applicable in either one of the environments but not both.
The biggest and most commonly mistake investors fall prey to, is a time frame relativity error. This error can be based on two misconceptions. One of them being that one shouldn’t trade isolated from other time frames. As well you should only trade within your setup time frame. The other mistake is to ignore the fact that what is a range in one time frame is always also a trend in another time frame. Let us illustrate this on the silver market.
Monthly chart Silver/US Dollar 8/13/2019, sideways channel:
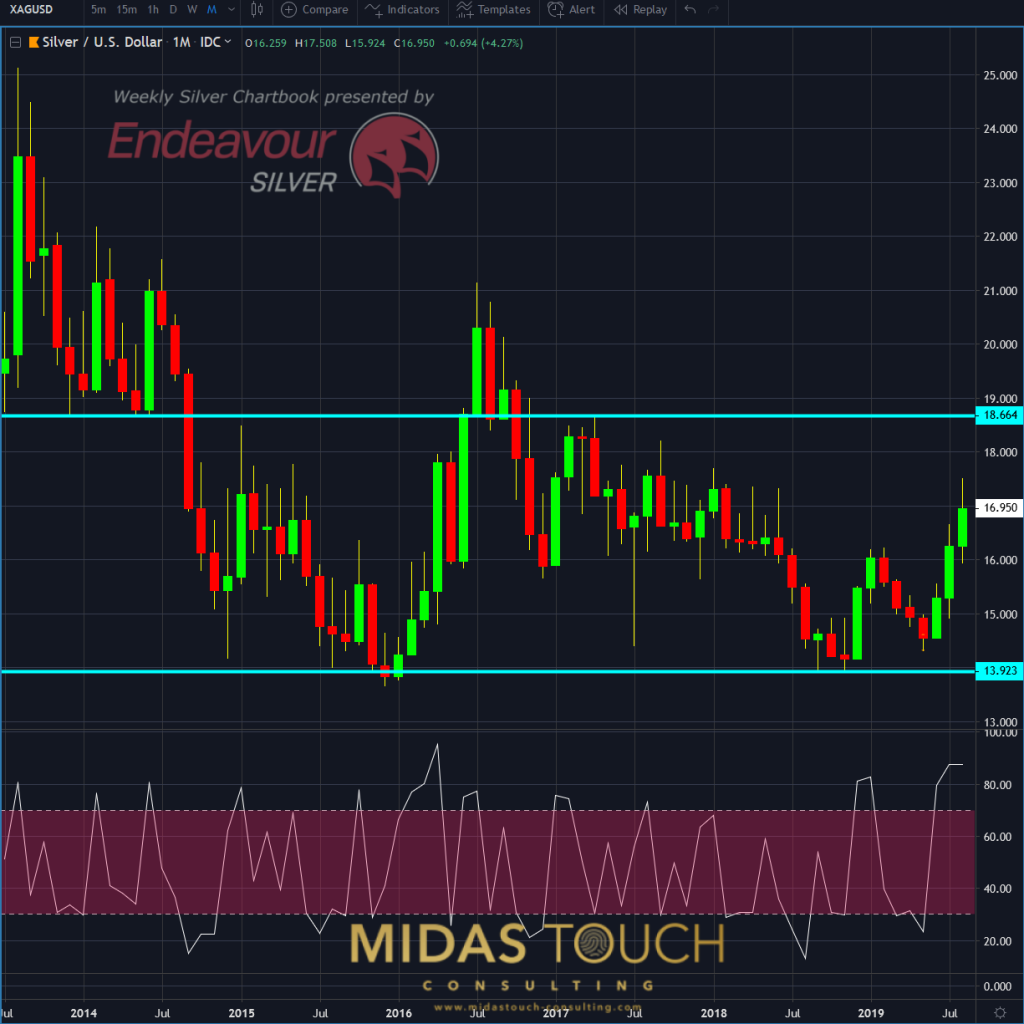
Silver in US-Dollar, monthly chart as of August 13th, 2019
The monthly chart above shows a ranging silver market over the last 5 years. The idea is to buy the lower band prices and sell at the upper band prices and vice versa. Selling the tops short.
We opened a position on 5/15/2019 near the lower band at US$14.77. We are aiming to have exits near the upper band of the range. With our quad exit strategy we are equipped with a tool that allows for early risk mitigation. In addition we have the choice at the upper band to either exit the entire position or leave a small portion open for a possible range breakout.
Trending versus ranging, weekly chart, silver in US Dollar – August 13th 2019, ranges and trends:
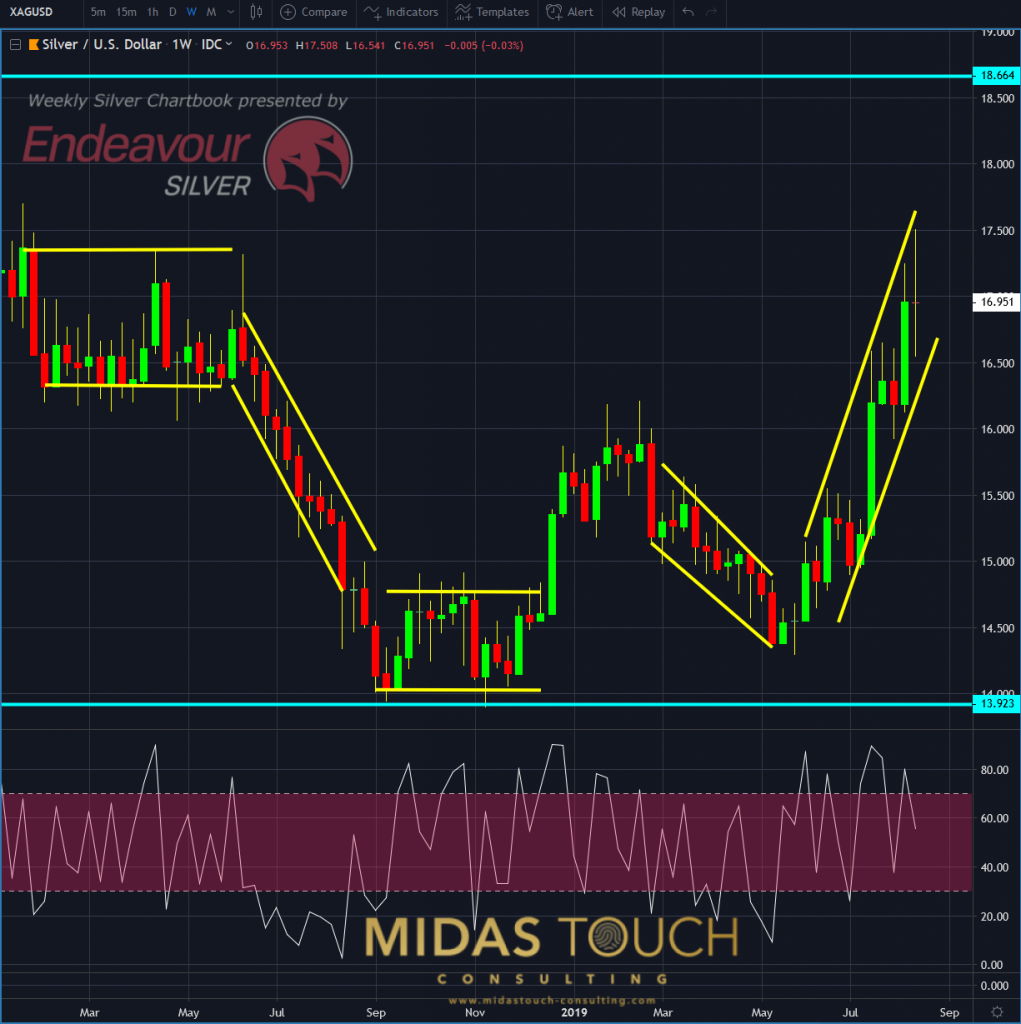
Silver in US-Dollar, weekly chart as of August 13th, 2019
In this weekly chart above it becomes evident that within the monthly sideways range we have phases of down and up trends. These are interrupted by sideways ranges. The astute trader aims to look for confluence points of various time frames. This allow for maximizing his or her edge in capital exposure to the market.
While one aims to scalp a range from both sides, the aim in a directional leg is to not counter directional attempt entries. One also should attempt to hold on with ones last part of a position as long as the channel is intact.
Silver in US Dollar – August 13th 2019, daily chart, trending versus ranging, ranges within trends:
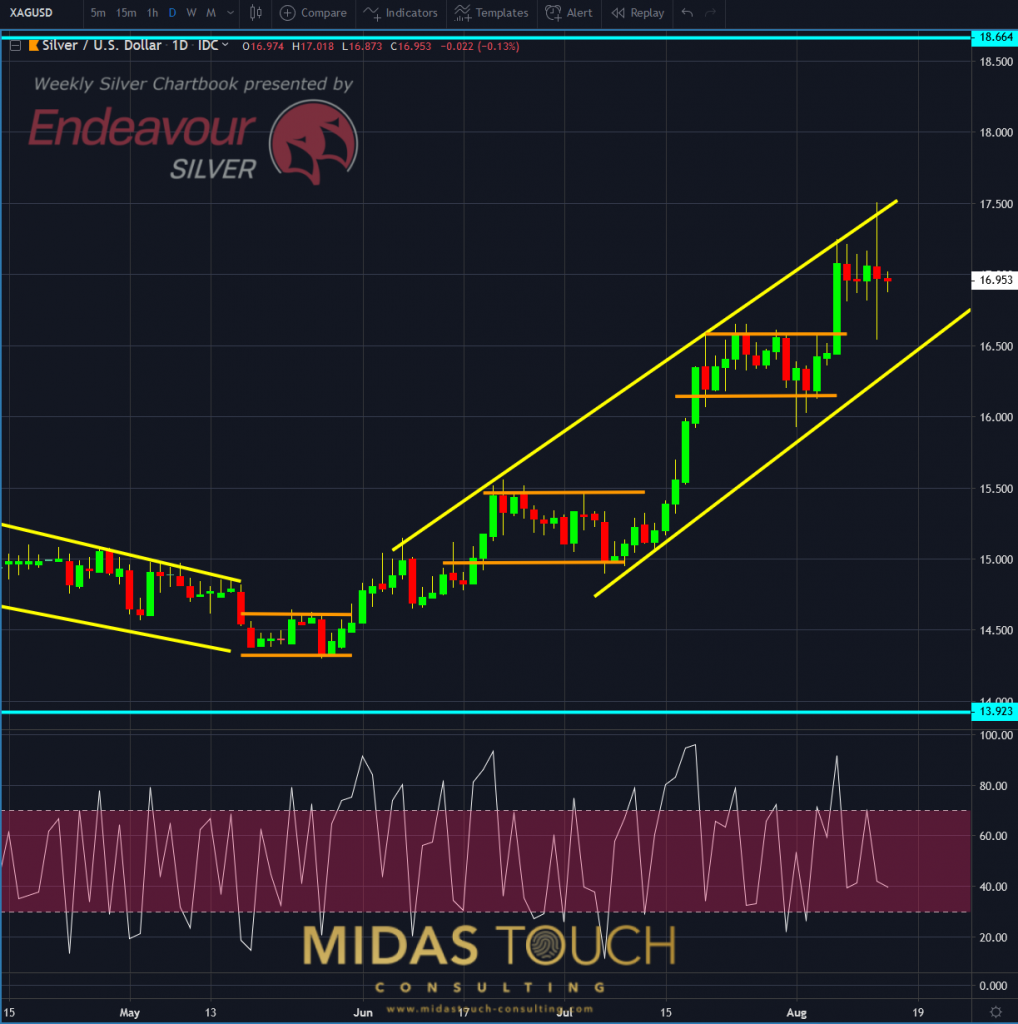
Silver in US-Dollar, daily chart as of August 13th, 2019
Dropping down another time frame to the daily chart presents ranges within trends. We would like to point out that especially slow up or down creeping directional channels tempt the investor to trade counter directional. In this specific environment observing price behavior in real time literally feels like as if a turning point is near. As with so many aspects in trading this is counter intuitive in nature. Instead, a clear set of rules is required. Rules that support one to hold on to positions in the direction of the trend versus aiming to trade counter directional.
To some readers these time frame relations are known and we still want to point out their importance for avoiding time relativity errors. Repetition is the mother of skills. Nevertheless for the advanced traders/investors we would like to add a little bonus and inspire the creativity in creating new edges.
August 12th 2019, daily chart, silver in US Dollar, within the matrix:
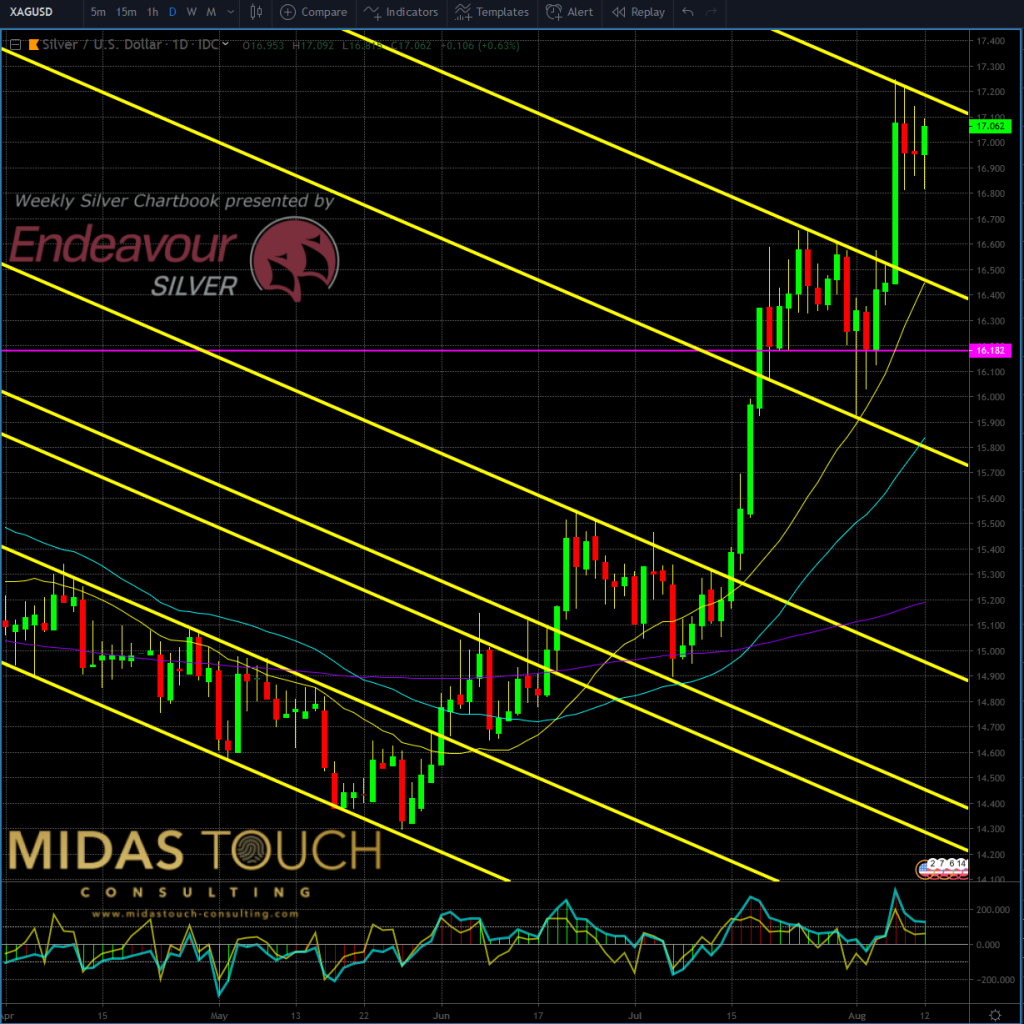
Silver in US-Dollar, daily chart as of August 12th, 2019
Optical illusion might play a trick on your eyes, but rest assured all yellow lines in the daily chart above are parallel. You achieve such drawing precision with many charting software vendors offering a function called “clone”. We encourage you to clone trend lines you have already drawn and place those strategically near newly forming directional support and resistance zones. You will find with uncanny accuracy after a while of practice a way of identifying anticipatory versus reactionary entry and exit points.
While the crowd is still trying to make sense of things you already have a “heads up”. Back and forward testing such edges will leave you with astounding probabilities that will verify this to be a worthy market tool.
Follow us in our telegram channel.
If you like to get regular updates on our gold model, precious metals and cryptocurrencies you can subscribe to our free newsletter.

