


Time frame diversification
Ever been in the situation of missing out on a move. Or worse, having forecast the markets direction perfectly and still not having managed to extract money. Well you are not alone. Many stare upon their computer screens and can´t quite figure out a way to join a directional move. And similarly, short the top and buy the bottom of a sideways range. Now there might be many reasons of why results are poor even so you predicted the direction of the market right. If one only has a well developed directional market strategy, one obviously struggles with sideways ranges (which is what markets do the majority of time). And of course vise versa. The honest truth so is that the best in their field might find themselves “tricked” by the market, to have missed a move and are disciplined enough not to chase a trade. It is common to not be able to catch a perceived leg of the market. There is one remedy so: Time frame diversification.
What is a directional trade in one time frame, might still be a range trade in another time frame.
To solve the first mentioned dilemma. Even if you might not have caught the big time frame low entry point you can still take many directional legs in smaller time frames. Or even if ya get spiked out in an choppy environment many times in a larger time frame you might still be able to take out the larger junks of a move.
So in short the idea here is to have various trades in various time frames. In addition this provides for an edge in seeing more clearly which time frame participants are on what side of the market. Consequently this prismatic view allows for staying out of the market when larger players are at a point entering the market against the direction of your trade. Moreover this in general is also a good approach for good exit timing. Recent events of our own trading make for a good example of what we try to illustrate:
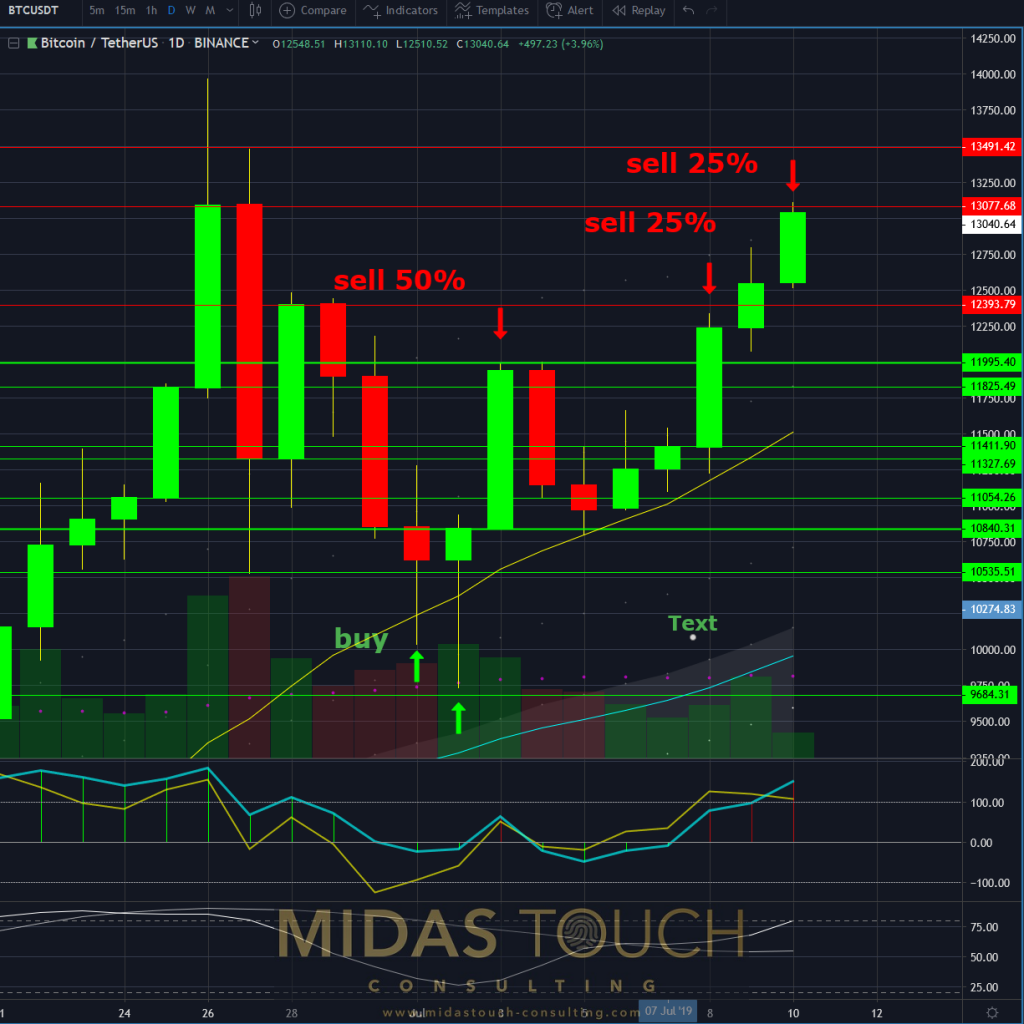
Daily chart of BTC/USDT, 3rd of July 2019, larger time frame entry:
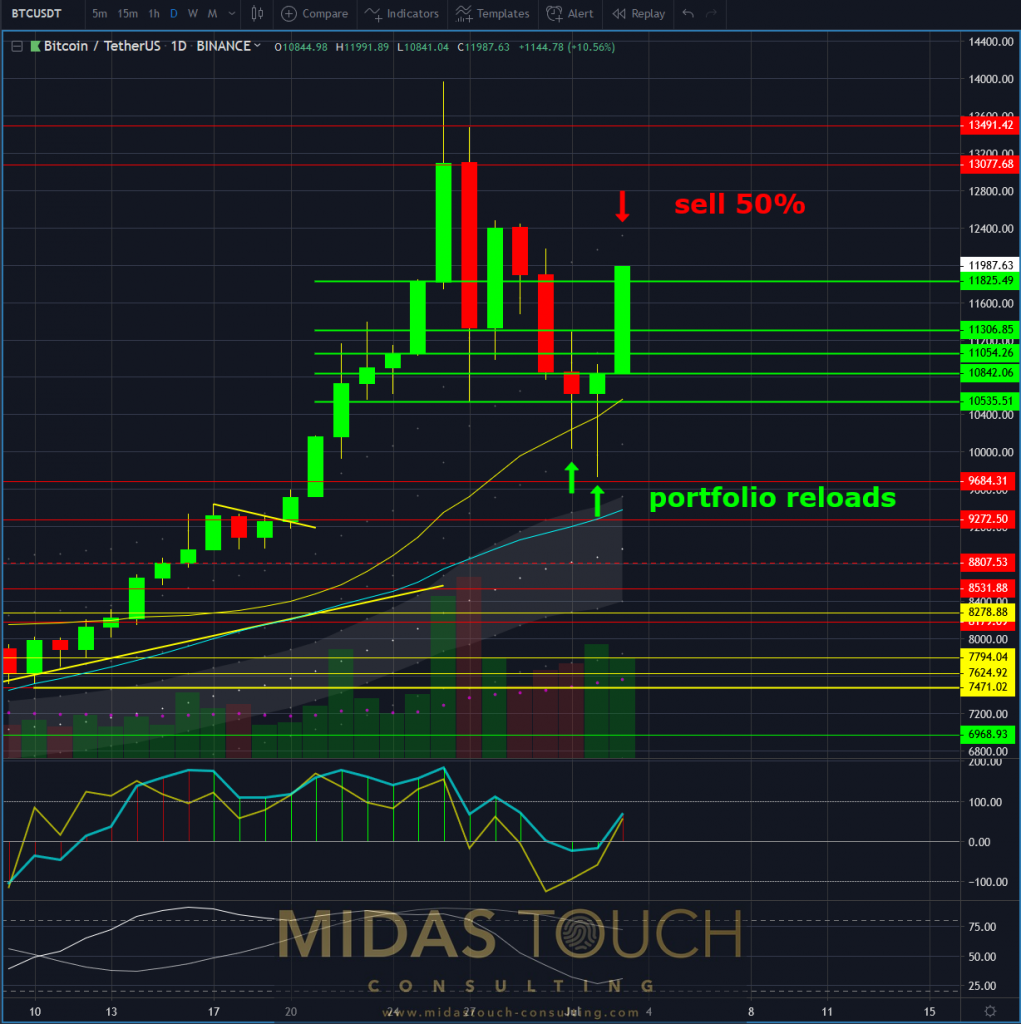
Bitcoin in Tether US, daily chart as of July 3rd 2019
We went aggressively long after a strong retracement starting near the 10k level. Positioned well for a long term hold we took as usual quick profits to reduce risk.
BTC/USDT, daily chart July 8th 2019, “fearless”:
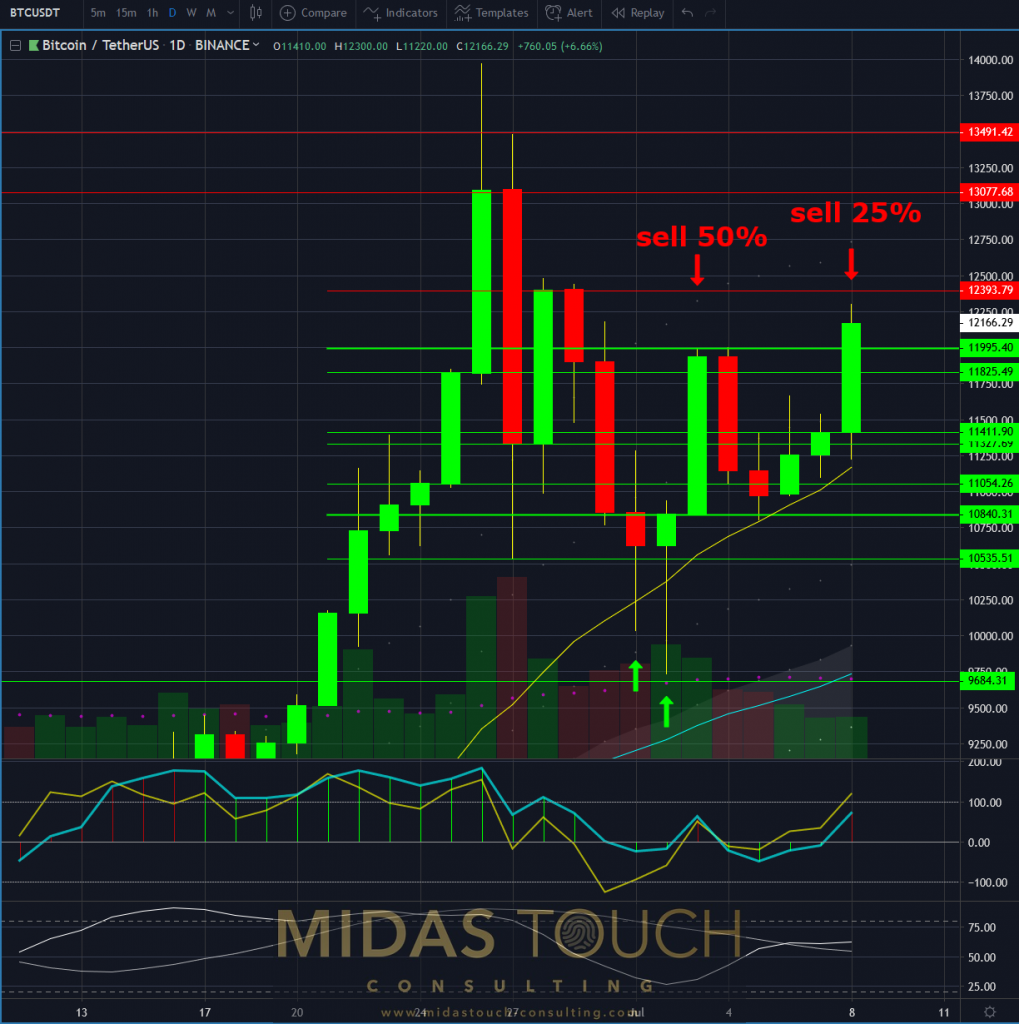
Bitcoin in Tether US, daily chart as of July 8th 2019
The next retracement was deep, but left us emotionally untouched. This mainly due to a breakeven stop and early profit taking, which has us exposed to the market with the markets winnings only. A great way to continue following the upthrust that followed.
No need for greed so we took conservatively target profits again once we came close to the next resistance zone. Liquidation into a volume upthrust.
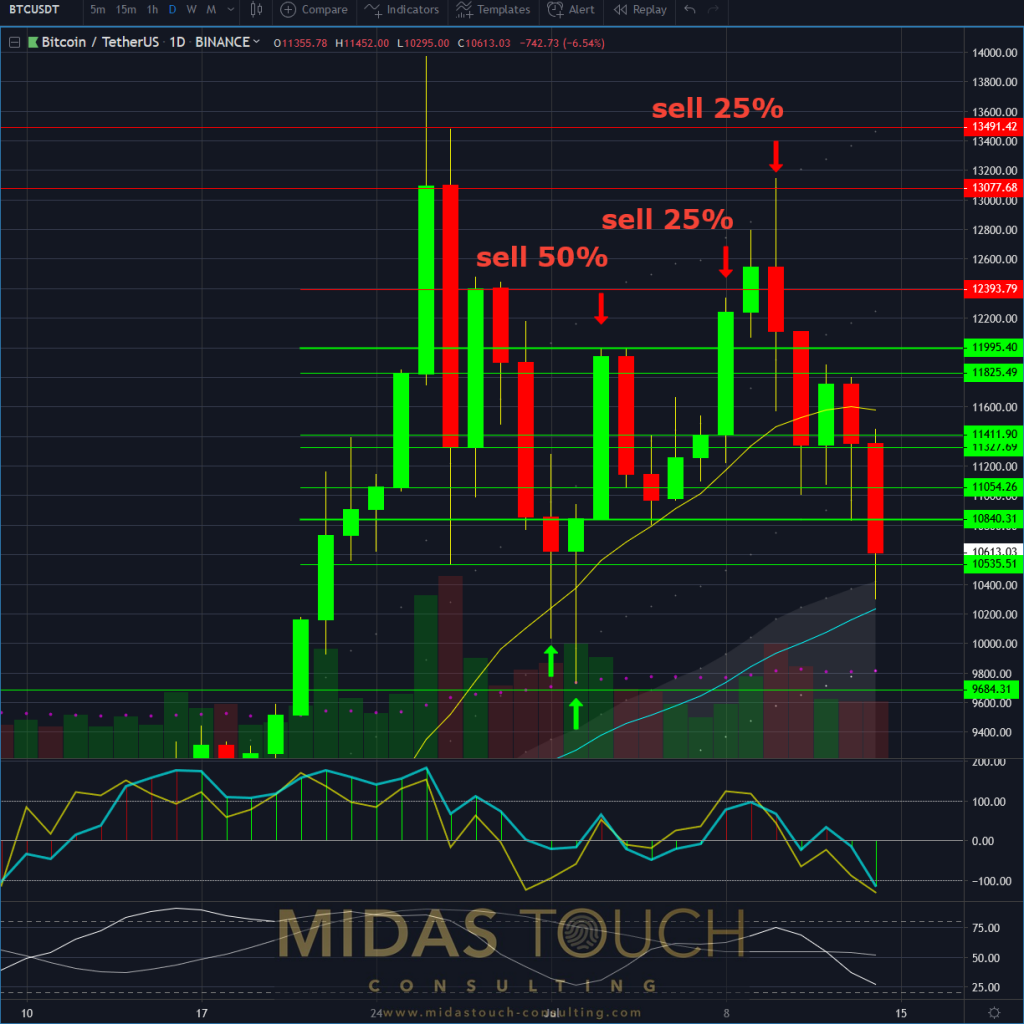
5 minute chart of BTC/USDT July 8th 2019, lower time frame reload efforts:
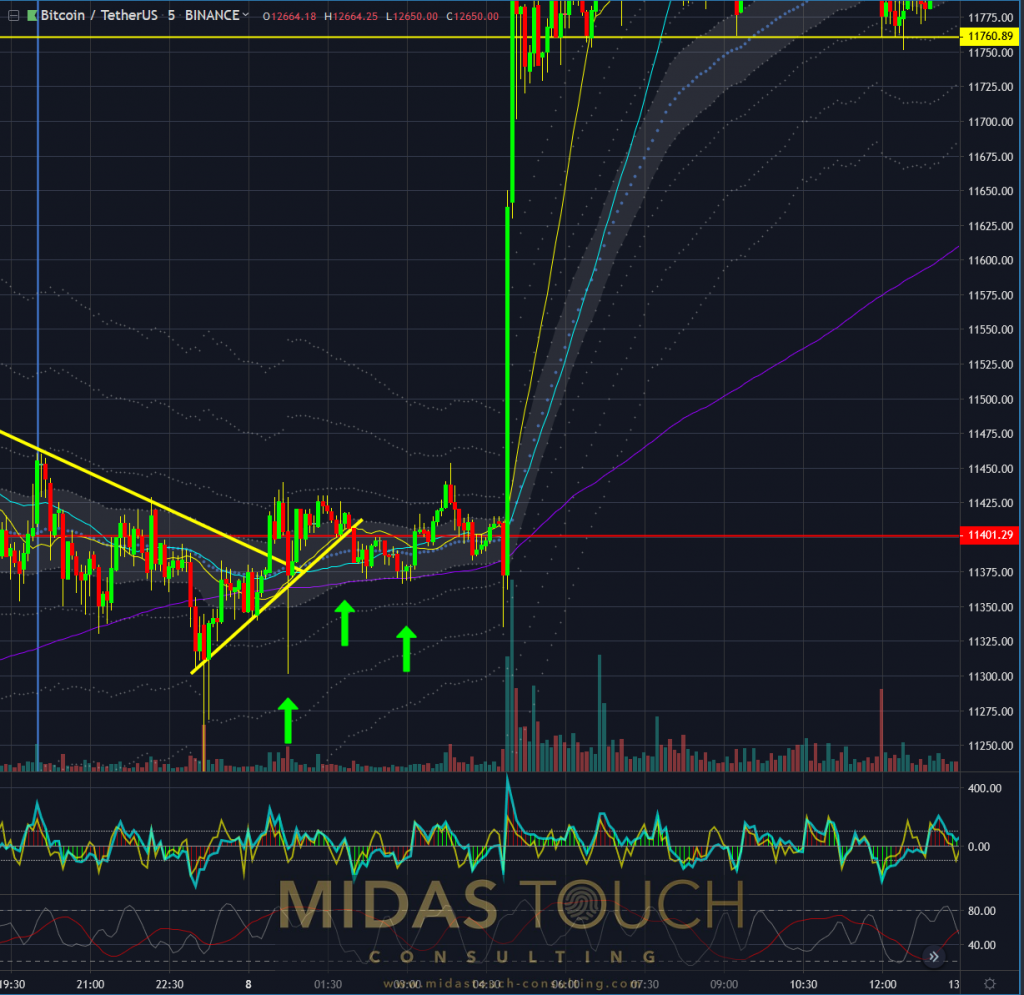
Bitcoin in Tether US, 5 minute chart as of July 8th 2019
No such luck so on our attempts to reload the position with multiple attempts on lower time frames. On our first try a nasty sell spike successfully took out our stop. Our next try was not ideally timed. Our stop got nicked literally on the low tick. You can find all these trades large time frame and short time frame, posted in real time on our telegram channel. And the final attempt missed its first financing target by 3 ticks and after that also got stopped out by choppy markets, right before a huge move up. Were there huge losses accumulated? No, but…
Chart of BTC/USDT – July 9th 2019, strong move up:
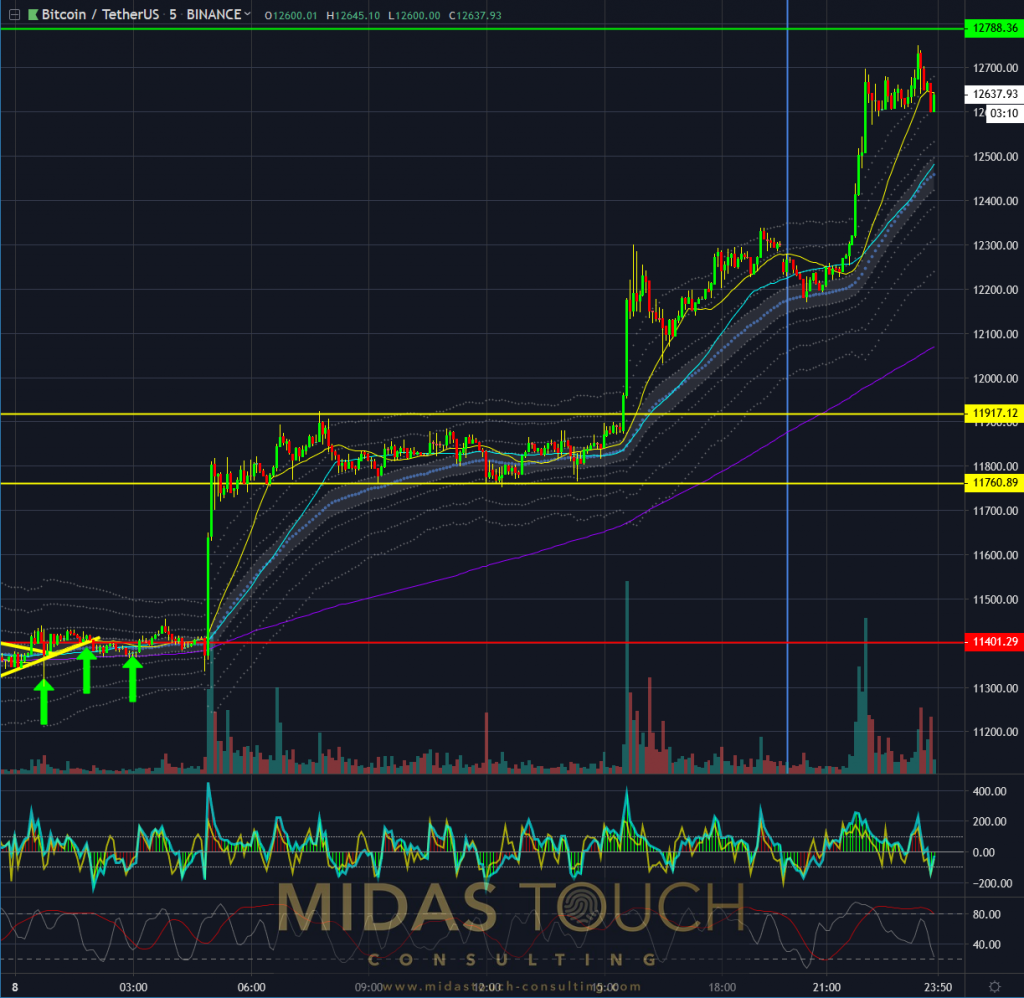
Bitcoin in Tether US, 5 minute chart as of July 9th 2019
…how would we have felt without knowing to be in this move on the larger time frame? Emotions would have flared up seeing such an advance of price. Especially having foreseen it and only due to some small mishaps, of typical execution problems, not being a part of this trade.
BTC/USDT, daily chart- July 10th 2019, “all out”:
Bitcoin in Tether US, daily chart as of July 10th 2019
On the larger time frame, eventually and without much greed but simply into the next resistance: all out.
Daily chart of BTC/USDT, 14th of July 2019, back to entry levels:
Bitcoin in Tether US, daily chart as of July 14th 2019
To catch a 3k point move like this, time frame diversification is an approach that reduces risk and allows for a higher chance to be part of such a nice price advance. One covers multiple spaces of risk if trading this way.
At these levels of the bitcoin market we see prices sitting at the bottom of a sideways range. Long entries, after a double bottom has formed on the daily chart, are another opportune scenario to try ones skills to be part of the winners circle.
All charts timely posted in our telegram channel.
If you like to get regular updates on our gold model, precious metals and cryptocurrencies you can subscribe to our free newsletter.

