


Silver – What to expect long term
Not all concepts in financial markets are complex. It is always the simple reduction of things, that are convincing. It requires expansion first to be able to reduce, but once in alignment less is more. Allow us in this week’s chartbook to expand on this notion and merely demonstrate why a long play in the silver market has a probable, favorable outcome. Silver – What to expect long term.
Monthly chart of silver 7/12/2019, sideways trading periods:
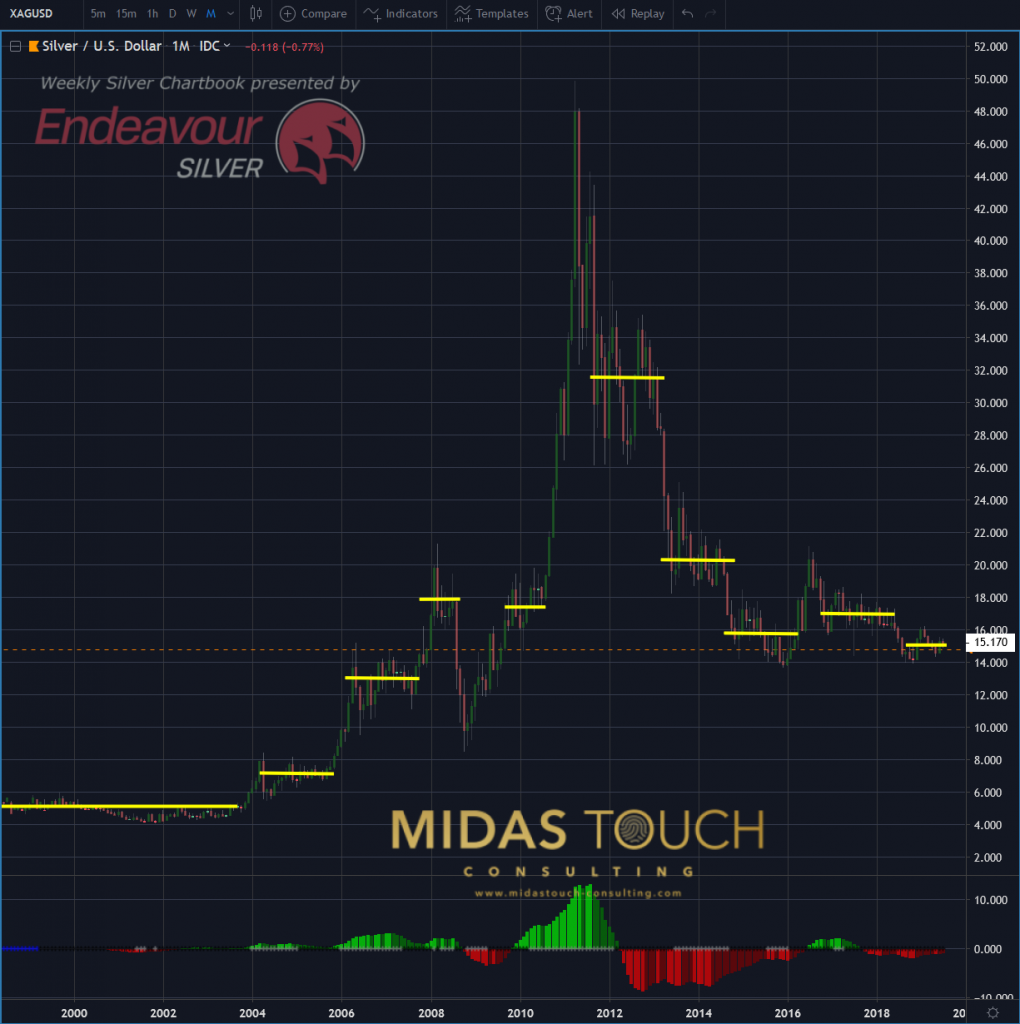
Silver in US-Dollar, monthly chart as of July 12th, 2019
The chart you are looking at above, presents the last twenty year of silver trading behavior. Each single candle stick counts for one months length of price fluctuation. Horizontal yellow lines mark sideways trading periods. We aim to illustrate that like in many other markets these times dominate in length market play.
Silver – What to expect long term: July 12th 2019, Silver, directional moves:
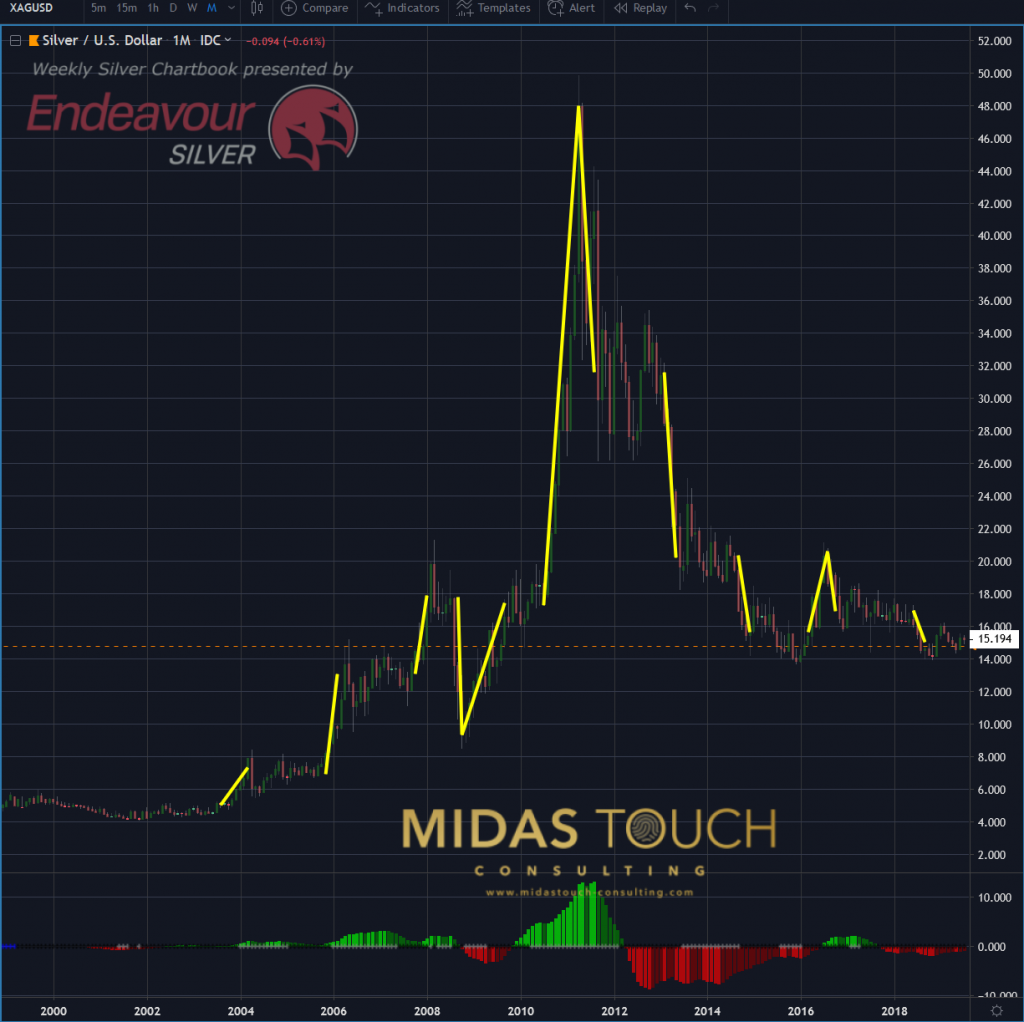
Silver in US-Dollar, monthly chart as of July 12th, 2019 b
In opposition to the first chart presented, this chart even so the same time frame, illustrates exactly the opposite. Vertical yellow lines show the time segments in which prices expanded or retracted, prices were trading directional in nature. We aim to show, that the mere time segments, where actual meaningful price change manifested, was in time duration a lot shorter in period than the sideways trading segments of the previous chart depicted.
Silver – monthly chart – 7/12/2019, where we at and what to expect:
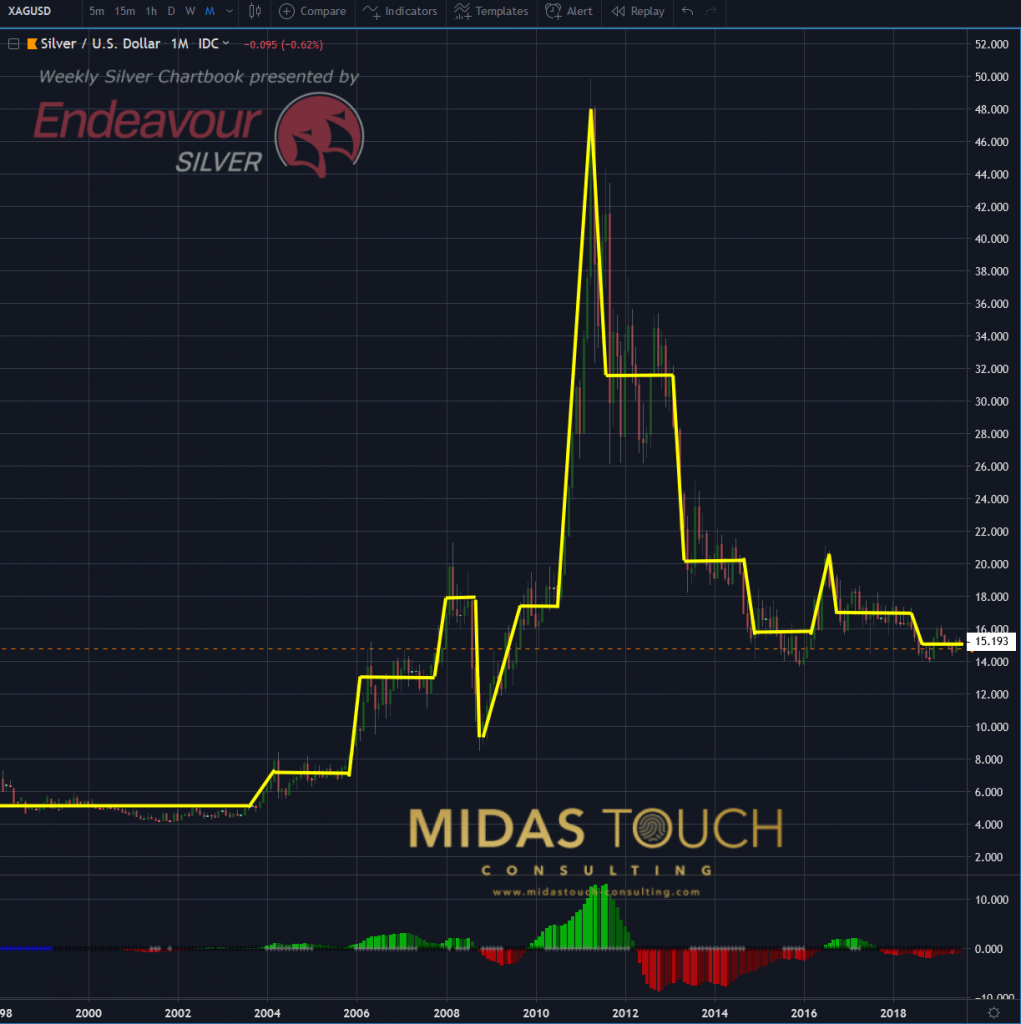
Silver in US-Dollar, monthly chart as of July 12th, 2019 c
Putting it all together one could say, that after a time of congested sideways movements, directional move becomes imminent. Where an edge can be extracted is, that silver has been just in such a congested phase for a while. But that is not all.
Silver – What to expect long term: The risk/reward edge – monthly chart of Silver July 12th 2019:
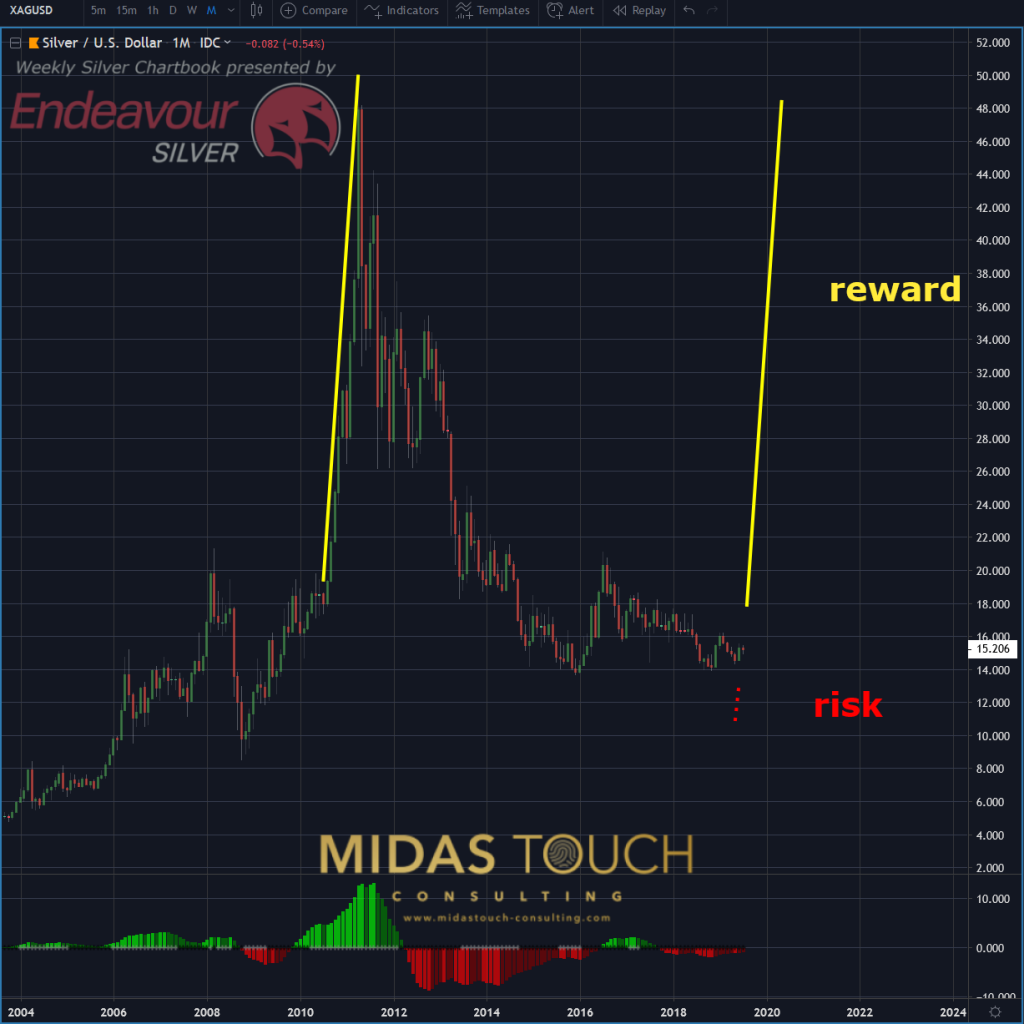
Silver in US-Dollar, monthly chart as of July 12th, 2019 d
The last time, about ten years ago, silver was trading within these price ranges, a substantial move came as a result of prior congestion. Now we could go into lengthy discussions about technical reasons and fundamental reasons, and all sorts of stacked edges like the ones we discussed in prior chartbooks about silver of why we are bullish on silver. But we promised this time around not to make things complicated. If you think of it, we don’t need to.
Looking at the risk to reward probability, graphically depicted in the above chart, isn’t it fair to say that if only once in a while a play like this works out, it will take care of a few small loosing trades along the way.
And isn’t it fair to say that most likely there will be still a fair chunk of profits left, even if the number of times one would be wrong, would outweigh the hit rate of the winners. One could still come out ahead.
So why not try on a trade like this one.
Follow us in our telegram channel.
If you like to get regular updates on our gold model, precious metals and cryptocurrencies you can subscribe to our free newsletter.

