On the money
We all want to know what works. How can we extract consistently money out of the market? Looking for the holy grail is futile. There is no secret. No formula, no special indicator or indicator setting. There is so at times a thing or two that work for a period of time and it is the look out for such quirks that provide an edge. Stacking such edges upon each other, to create a higher probability, is a worthwhile goal. Let us see what edges can be found specifically in the Bitcoin market that could help to be on the money.
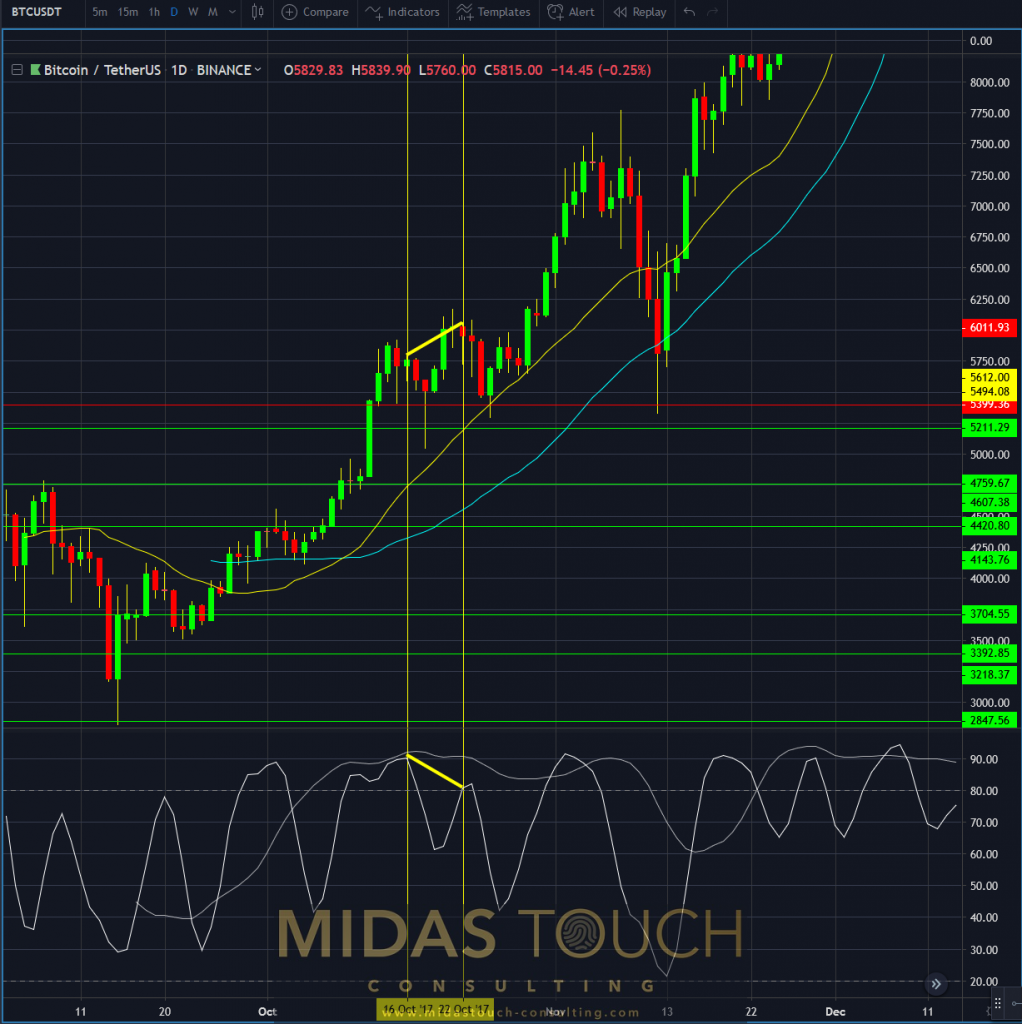
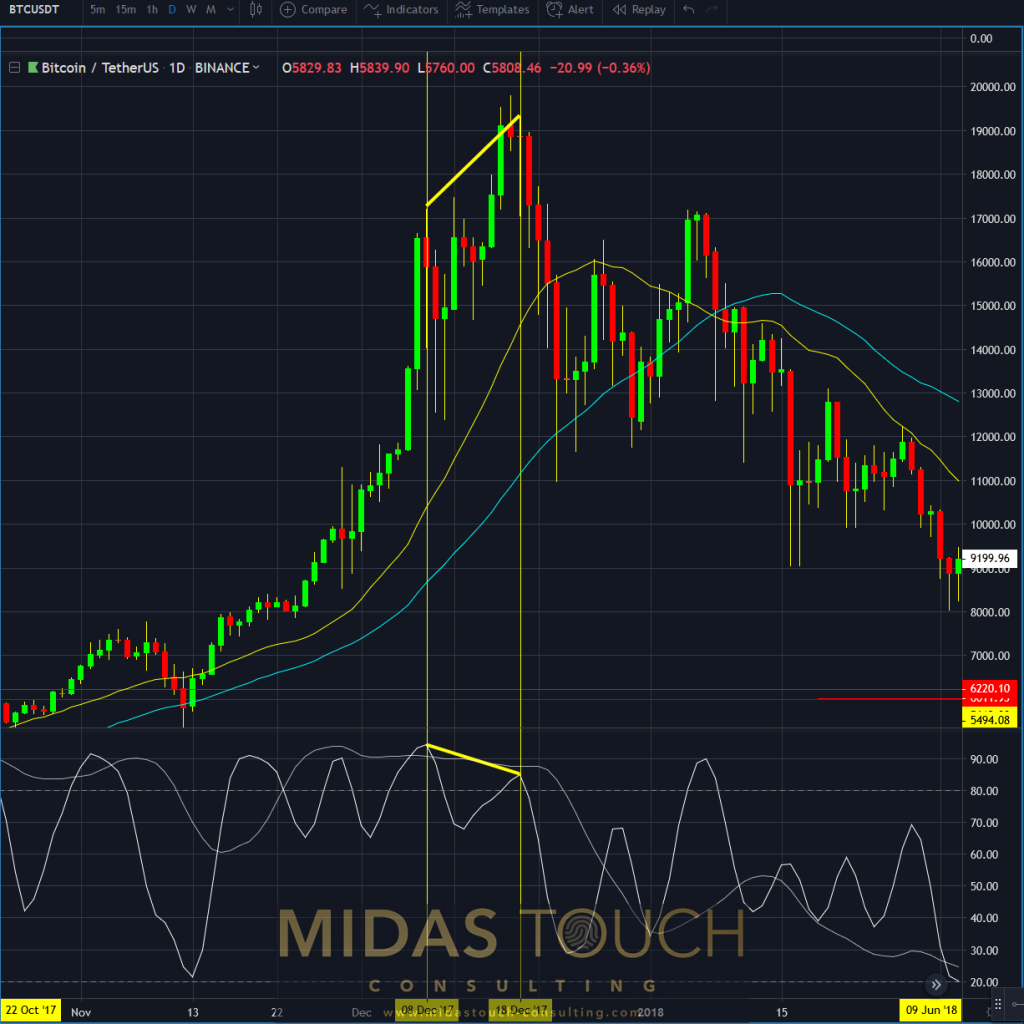
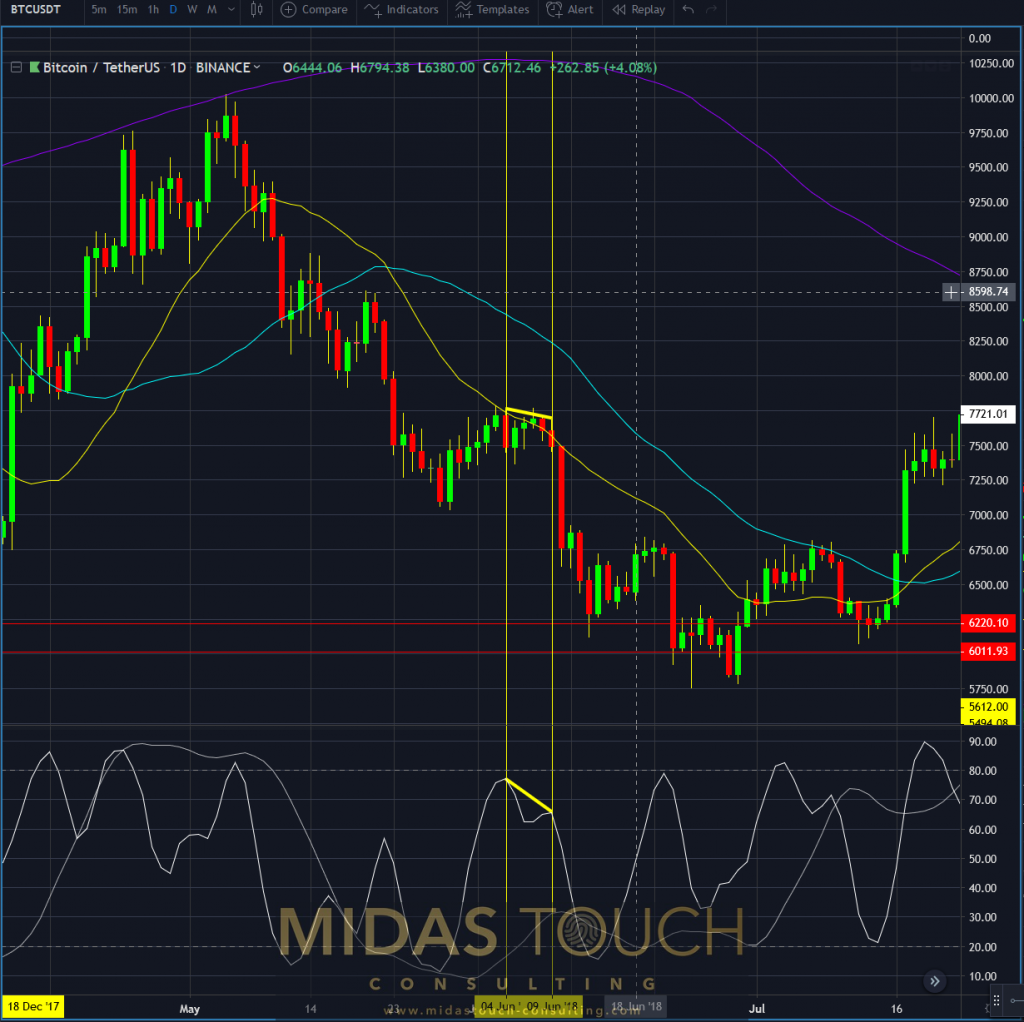
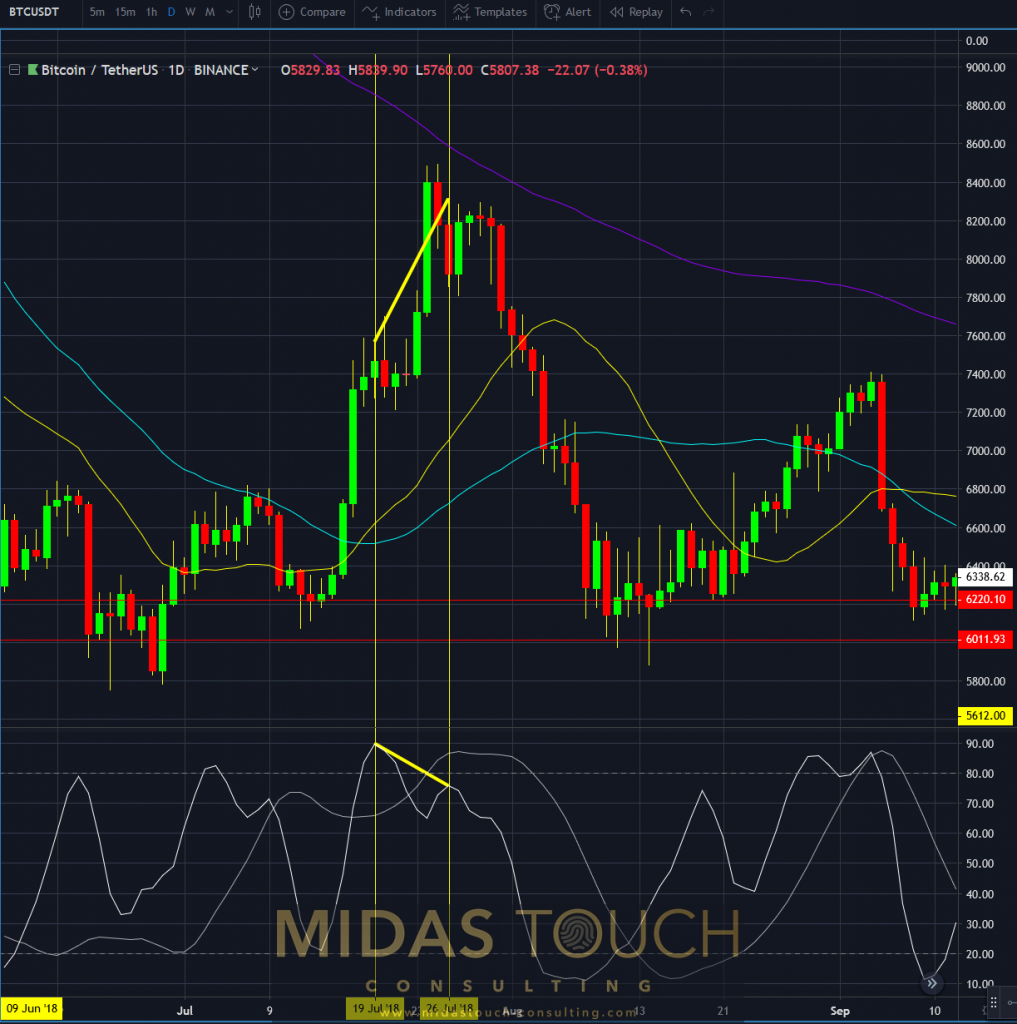
In the following charts you will see a Slow Stochastic with setting “SmoothK 5” and “SmoothD 3”. At closer look the divergences between price and Stochastic (yellow horizontal lines) are of true value.
Daily chart of BTC/USDT – Stochastic divergence as an edge to consider, Oct 22nd 2017:
Bitcoin in Tether US, daily chart, October 2017
On the money, BTC/USDT daily chart, December 18th 2017 – Divergence exit timing at bitcoin all time highs:
Bitcoin in Tether US, daily chart, December 2018
Daily chart from June 9th 2018 of BTC/USDT – Short reload entry timing support:
Bitcoin in Tether US, daily chart, June 2018
July 26th 2018, daily chart of BTC/USDT – Divergence help for turning point identification:
Bitcoin in Tether US, daily chart, July 2018
December 24th 2018, daily chart of BTC/USDT – Divergence Christmas gift:
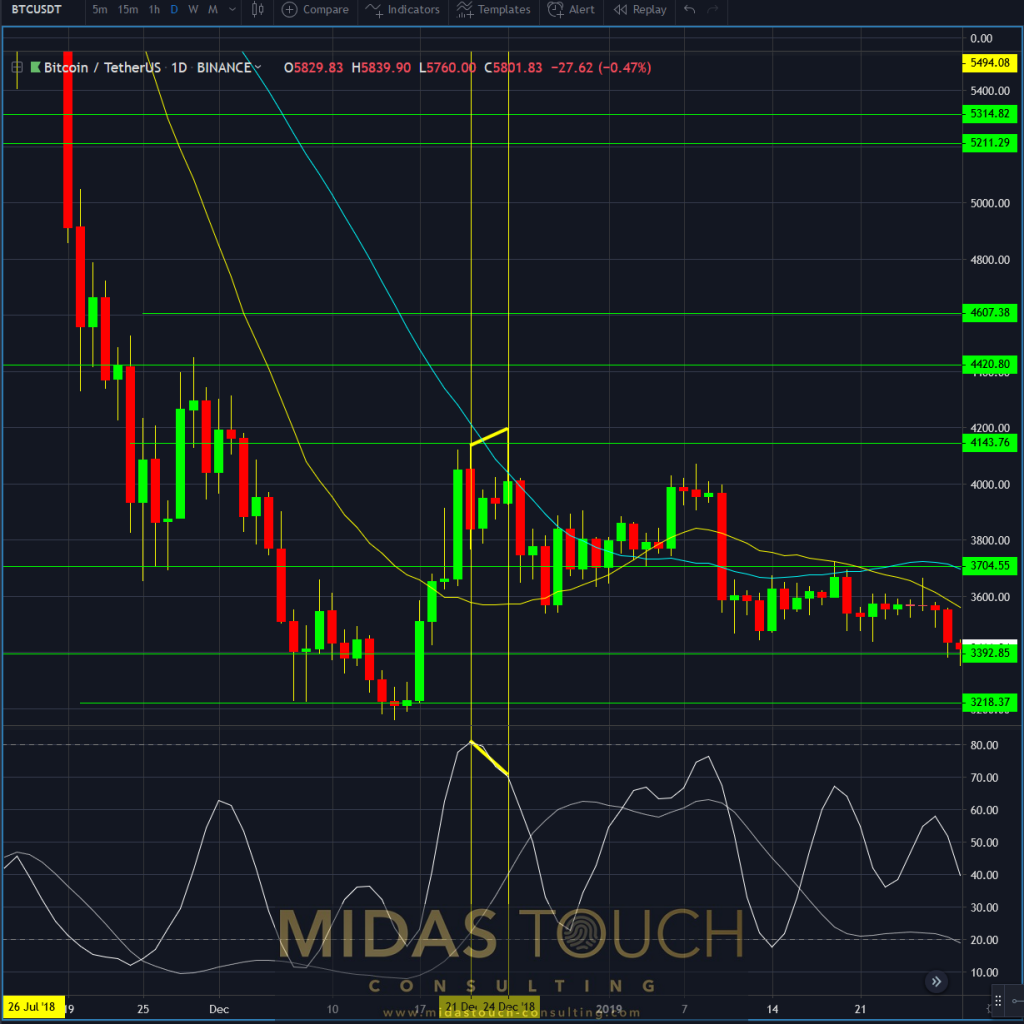
Bitcoin in Tether US, daily chart, December 2018
BTC/USDT daily chart, April 24th 2019 – Stochastic divergence to time profit taking:
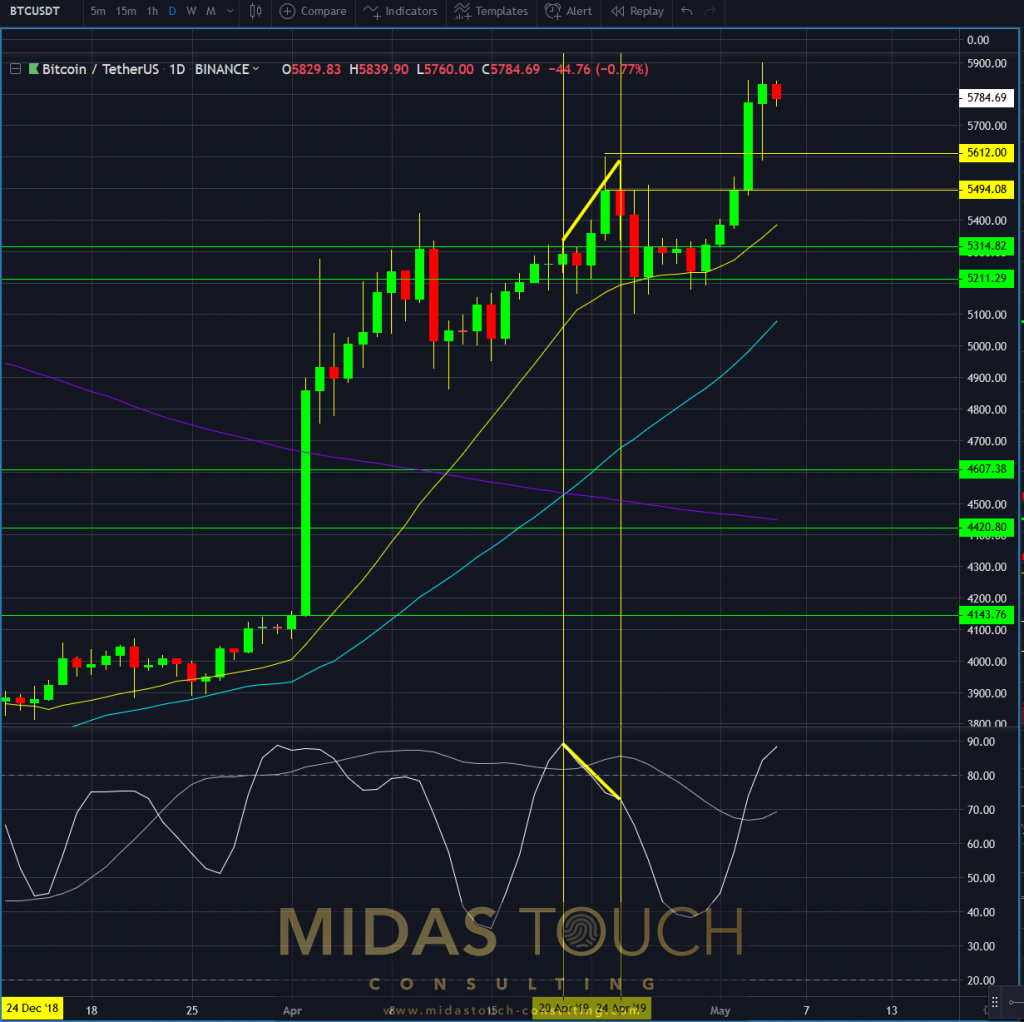
Bitcoin in Tether US, daily chart, April 2019
You may ask: “Why true value?”. Well, these divergences on a daily time frame did not generate much false signals at all. Also these divergences are to be found in an up-trending, in down-trending and in sideways markets. Yet they still are all valid. Many believe that a Stochastic indicator is only to be used in a directional market and that divergences appear too often and are therefore false as a result. In principle that is true, but it is also true, that if you find an edge in a specific market and if a specific time frame plus the data is overwhelming in your favor, you should take note of its.
In this case the edge can be used multi fold. For example we used this edge to time exits as described in our last chartbook…
We, in the past, pointed out our Quad Exit Strategy. This is our exit strategy tool, which helps to produce a supporting psychology and as well solid returns. In addition, the divergence edge is very helpful to time these exits. It is also an early warning signal that a retracement is coming soon. Therefore, if the market is directional up, it is time to prep long entries. In a sideways market this tool it is an entry signal in itself. In a down trending market it helps to time the reload of short entries.
In conclusion, no single edge is truly meaningful but stacking such edge findings can be very profitable indeed.
All charts timely posted in our telegram channel.
If you like to get regular updates on our gold model, precious metals and cryptocurrencies you can subscribe to our free newsletter.


