


How to catch a move
A profits review. Now that BTC/USDT has made a 77.44% price advance from its recent monthly lows of US$3,156 to US$5,600, it might be prudent to review of how we fared catching this leg up. Trading isn’t just projection of probability for low risk future events. It also requires constant review of performance and accuracy of how we participated in the market. It needs measuring how efficient ones participation truly was. Only through measuring one can find ways on how to improve. Without constant and never ending improvement one can not keep an edge in an ever expanding and changing environment. Let´s see on how to catch a move through our Quad Exit Strategy.
After all, the exits are making the money, much more than just a good low risk entry strategy. It might start out in a very small position of investment, speculative in nature like our very early core position. We don’t have to go that far back in time so. Let´s review our recent chartbook from December 2nd 2018, the anticipation of a possible bottom building in the Bitcoin market.
Daily chart of BTC/USDT – we strongly urged to participate:
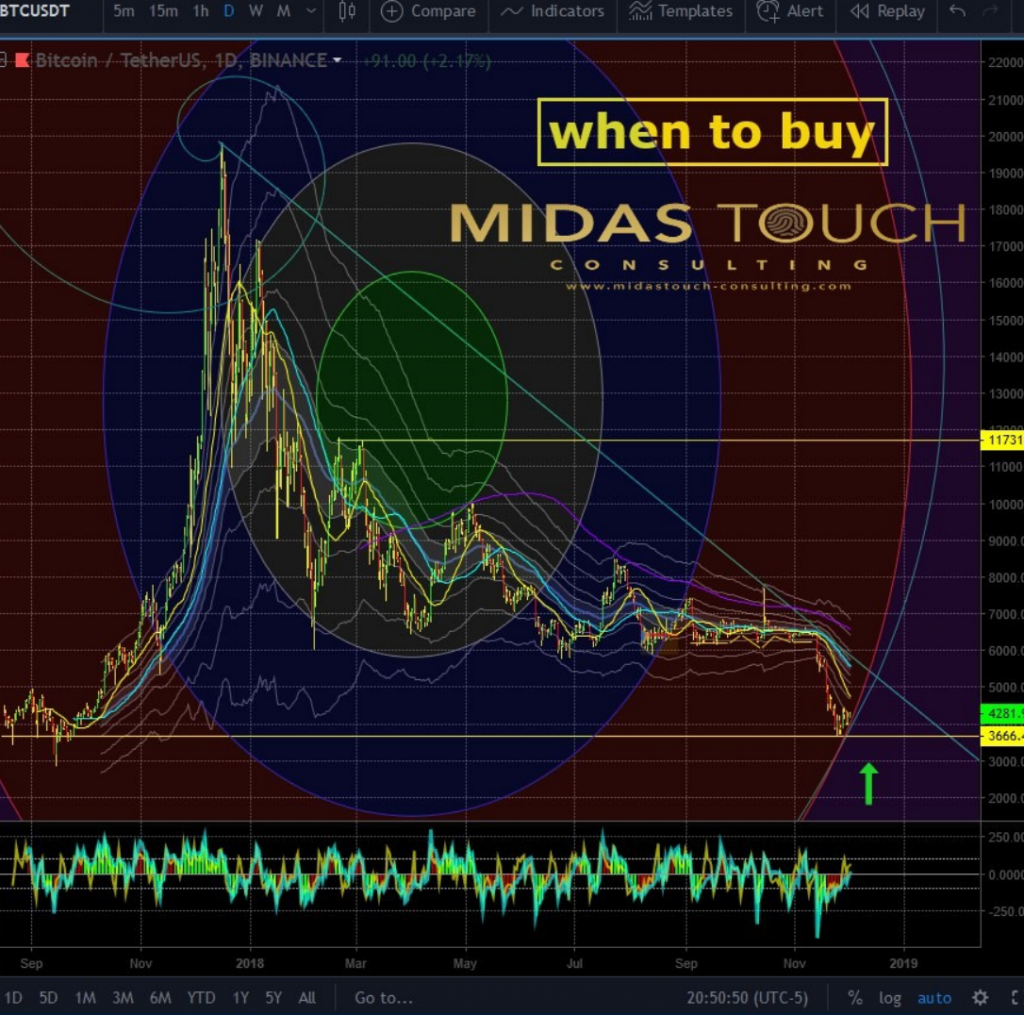
Bitcoin in Tether US, daily chart as of December 2nd 2018.
Less than two weeks later the lows were in:
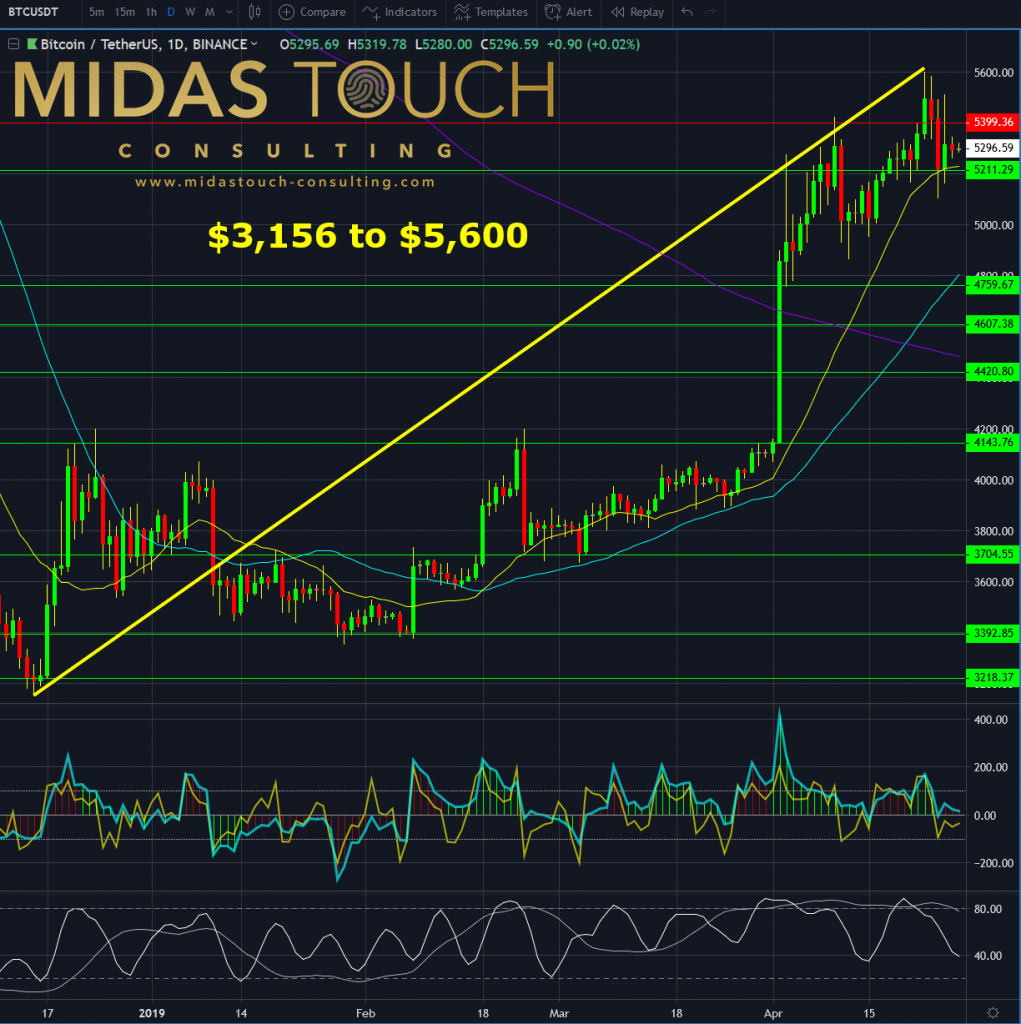
Bitcoin in Tether US, daily chart as of April 27th 2019.
As you can see, the call to take action was near perfect from a timing perspective. And of course, there is no such thing as perfect within the markets. Instead perfectionism is paralysis.
So how did we fare? The detailed statement of trades can be found on our performance page, but in short over those last 4.5 months we took 118 trades in BTC/USDT. With an 84% hit rate and losing trades to be extremely small in loss, we are left with the luxury to check if profits in regards to move were acceptable.
Let’s review the main entries and their exits on the daily charts:
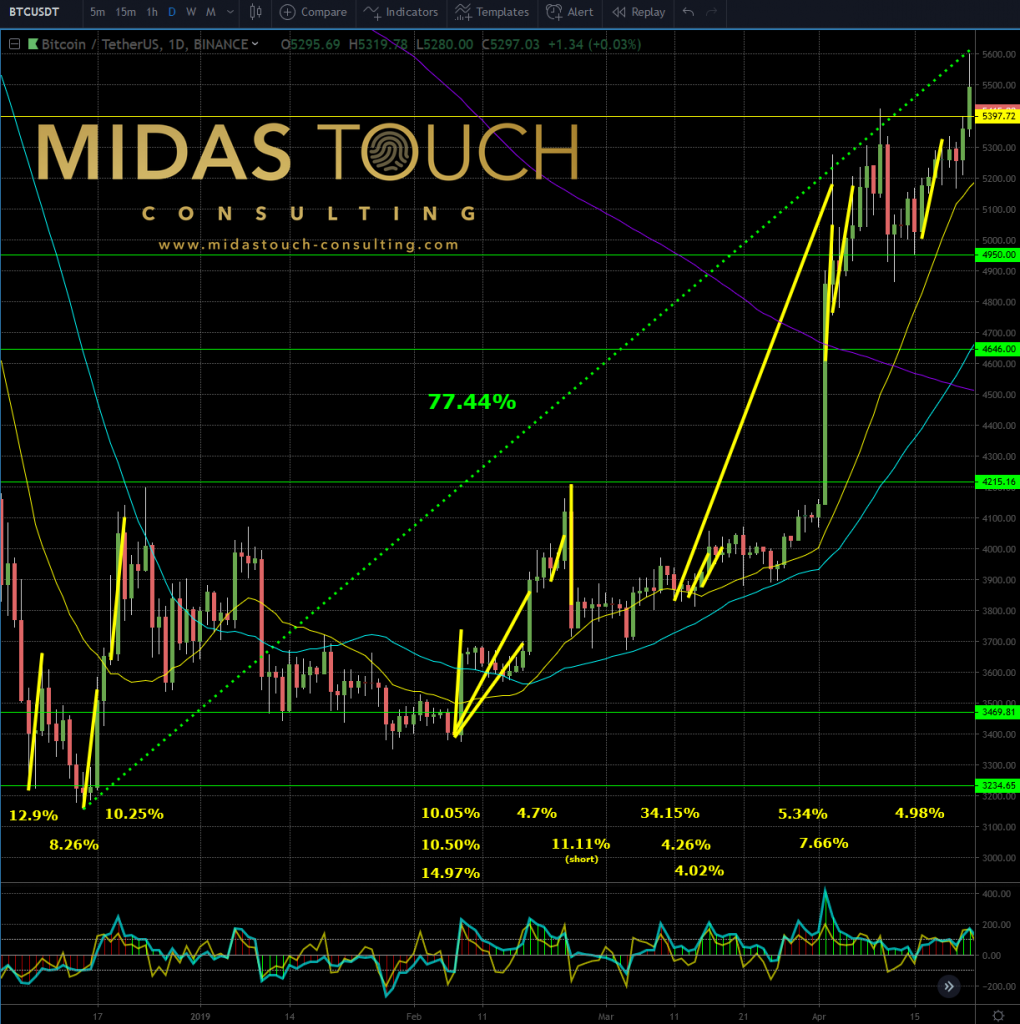
Bitcoin in Tether US, daily chart as of April 24th 2019.
Did we buy the low and got out at the top? No! We have not yet seen anyone who can do just that consistently. We did catch all the major moves, at least in part. If you add all these numbers together you end up with solid profits. And…watch the location of the entry points one more time and find: extreme low risk. All entry and exit points can be found in our Telegram channel , posted there in real time….
All charts timely posted in our telegram channel.
If you like to get regular updates on our gold model, precious metals and cryptocurrencies you can subscribe to our free newsletter.

