“The beginning of wisdom is the definition of terms.” – Socrates
“Feelings are invulnerable to rational thought.” – Stephen King
While gold has been showing some signs of life over the last few days, I want to give you a comprehensive update about the current status of our Midas Touch Gold Model™. A detailed description of the Midas Touch Gold Model™ and its philosophy can be found on our website. As a summary, its strengths lie in versatility and quantitative measurability as it is carefully examining as many perspectives on the gold market as possible.
Since the nasty sell-off in summer 2018, gold prices had recovered in a slow but therefore convincing fashion towards the well-known multi-year resistance zone around US$ 1,350 – 1,375. Yet since February 20th, at a peak of US$ 1,346, the gold market is in a clear correction again and the final low of this down-wave is not yet confirmed.
The Midas Touch Gold Model™ – in neutral mode!
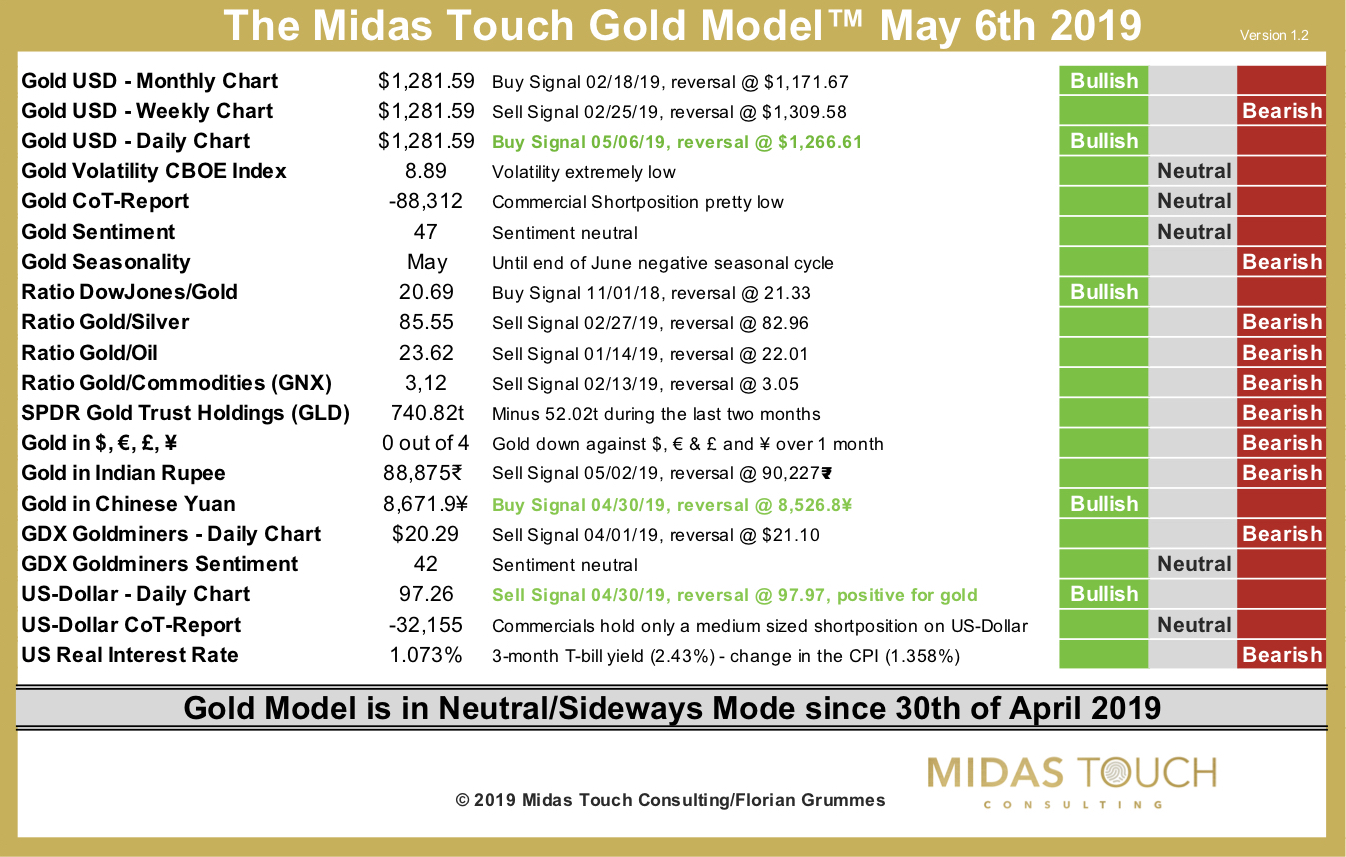
The Midas Touch Gold Model™ as of May 6th, 2019
At the same time, the Midas Touch Gold Model™ has just recently improved to a neutral stance after flashing a sell signal since end of February. And although its three technical timeframe components of gold in US-Dollar (monthly, weekly, daily) currently do not look that bad, it still takes a gold price above US$ 1,310 to turn around the weekly chart. We need to consider, that in such an extremely low volatile environment as gold finds itself right now, a fast US$ 30 plus move to the upside could already be the big game changer!
Commercial hedgers hold a rather small short position in gold futures
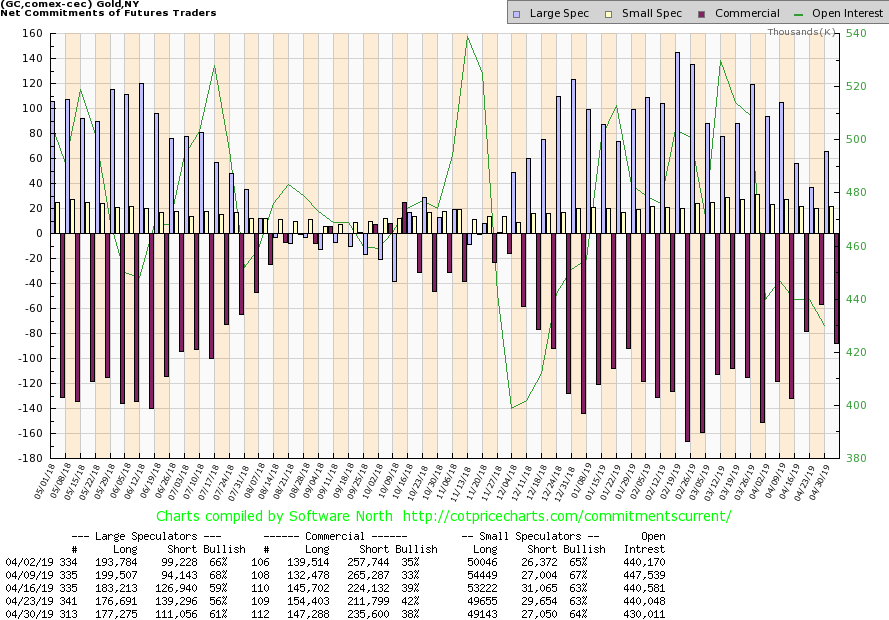
Gold CoT report as of April 30th 2019
Looking at the current Commitment of Trades report (CoT), the medium-term outlook for gold is rather encouraging. The smart money, which of course are the commercial hedgers, does not hold a huge short opposition on gold futures. It might be still large enough to trigger a final panic sell-off towards June or July, but certainly not a massive US$ 100 plus down-wave.
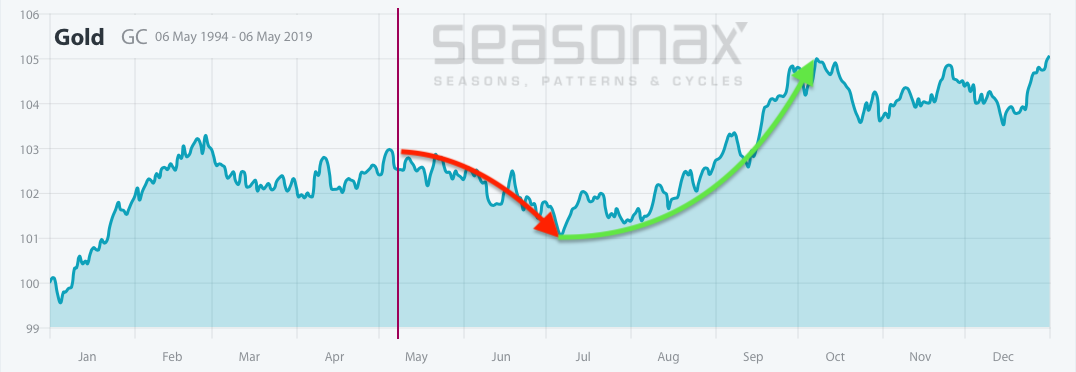
Seasonal cycle advises to be patient until end of June at least
Combining the CoT-Report with gold´s seasonality, the most likely scenario sees a continuation of the ongoing mild correction towards at least the 200- day moving average (US$1,253). Probably between June and mid of August, gold should therefore find a bottom between US$ 1,200 and US$ 1,250.
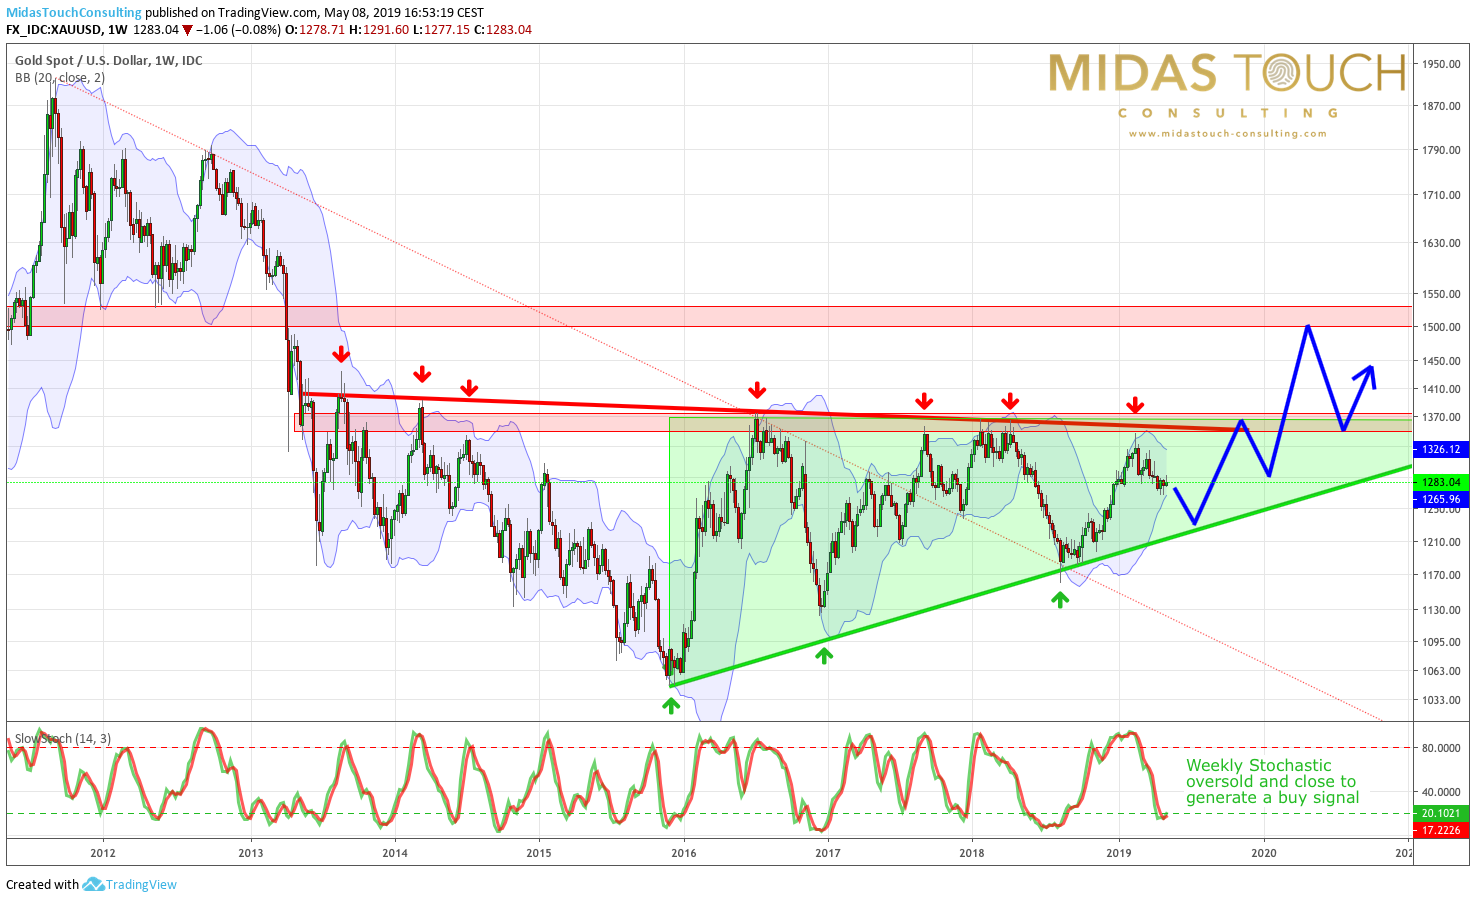
In the bigger picture gold is still moving within its ascending triangle
Gold weekly chart as of May 8th 2019
In the bigger picture this would not violate the series of higher lows, but strengthen the promising ascending bullish triangle formation which gold seems to tinker since its low at US$ 1,045.
If you consider the four ratio components of the Midas Touch Gold Model™, none of them is screamingly bullish at the moment. In fact, the Dow Jones/Gold-Ratio is rather close to lose its bullish signal! But should the “sell in May cycle” plus the US-China trade dispute force stock markets lower, this power ratio would remain in favor of gold. The other three ratios (Gold/Silver-Ratio, Gold/Oil-Ratio, Gold/Commodities-Ratio) will likely catch up once gold has seen its trend reversal in the next few months.
Gold ETFs will receive massive inflows once gold breaks above US$ 1,360
When goldmining managers have to justify the weak performance of their stocks, they often complain about ETFs as a passive investment competitor these days. Certainly, the current holdings of the GLD Gold ETF of 740 tones are rather shallow, but you can be sure that once gold can break above US$ 1,360, generalist investors will rush into these products again exactly as they did between 2004 to 2011. Back then, the gold ETFs were one of the main drivers behind gold´s bull market. But for the time being, the Midas Touch Gold Model considers GLD´s recent stock movements as bearish. And talking about the miners & ETFs, the GDX & GDXJ have a sell signal since April 1st, but it does not take much to flip this into a bullish reading which would at least signal a short-term bounce from oversold levels.
Finally, the US-Dollar might be the missing puzzle for gold´s return. So far, gold has held up surprisingly well as the US-Dollar has been strengthening over the last 14 months. Currently, the model detects a sell signal for the US-Dollar and therefore a bullish signal for gold. At the same time US real interest rates above 1% remain an argument against gold.
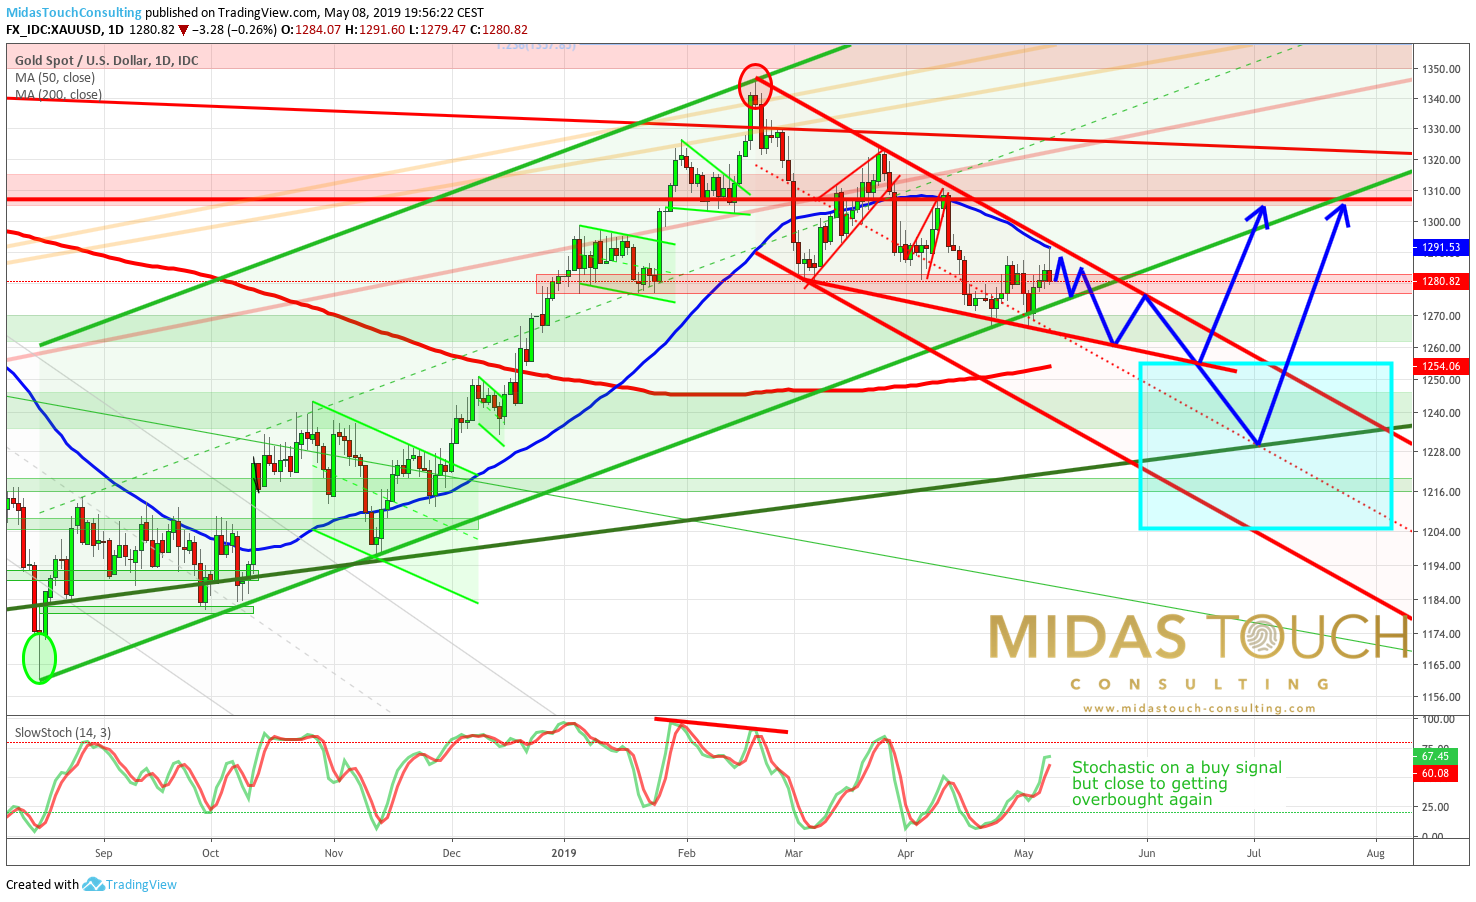
On its daily chart, gold might be running into a falling bullish wedge
Gold daily chart as of May 8th 2019
Overall, gold might be currently running into a falling bullish wedge. Our model is neutral and advises a neutral and patient stance until the typical summer low. Normally this low is to be found between end of June and mid of August. Should gold not dive too deep until these summer lows, the sleeping 5,000-year-old golden dinosaur might indeed have enough power to break through the resistance around US$ 1,360 later in autumn/winter. A breakout would certainly catapult gold towards US$ 1,500 by spring 2020!
Conclusion
I am convinced that investors and traders can benefit from the Midas Touch Gold Model™ and its rational approach. Although the model is not always right, it certainly saves a lot of time. It also provides the user with a professional overview of the situation in the gold market. The model is updated every week and can be followed on the website of Midas Touch Consulting.
Follow us in our telegram channel.
If you like to get regular updates on our gold model, precious metals and cryptocurrencies you can subscribe to our free newsletter.
Disclosure: I am long physical gold & silver. I wrote this article myself, and it expresses my own opinions.
Florian Grummes is an independent financial analyst, advisor, consultant, mentor, trader & investor as well as an international speaker with more than 30 years of experience in financial markets. Florian is the founder and managing director of his company Midas Touch Consulting, which is specialized in trading & investments as well as consulting, analysis & research with a focus on precious metals, commodities and digital assets. Via Midas Touch Consulting he is publishing daily and weekly gold, silver, bitcoin & cryptocurrency analysis for his numerous international readers. Florian is well known for combining technical, fundamental/macro and sentiment analysis into one often accurate conclusion about the markets. Besides all that, Florian is also a music producer and composer. Since more than 30 years he has been professionally creating, writing & producing more than 300 songs. He is also running his own record label Cyron Music & Art Productions. His artist name is Florzinho.


