Profit taking and reentry timing
Trading is not a science – it is an art form. A bold statement but if you look through history, you will find that wall-street threw some of the brightest minds towards problem solving and results were often devastating. This multidimensional chess game, for the most part counter intuitive in nature, simply has too many variables. To solve this puzzle it needs more than just a left brain approach. Some pieces are easier to place than others and we collected a few helpers for the bumpy road of market participation. Since the angle of a complexity with lots of variables can change quickly, it is advisable to keep an eye on the overall picture frequently. We did some profit taking and reentry timing last week in the Silver market and want to invite you on a quick journey through this recent history in the precious metal sector.
Daily chart of silver 6/25/2019, taking weekly profits since gold overbought and silver showing relative weakness in the precious metal sector:
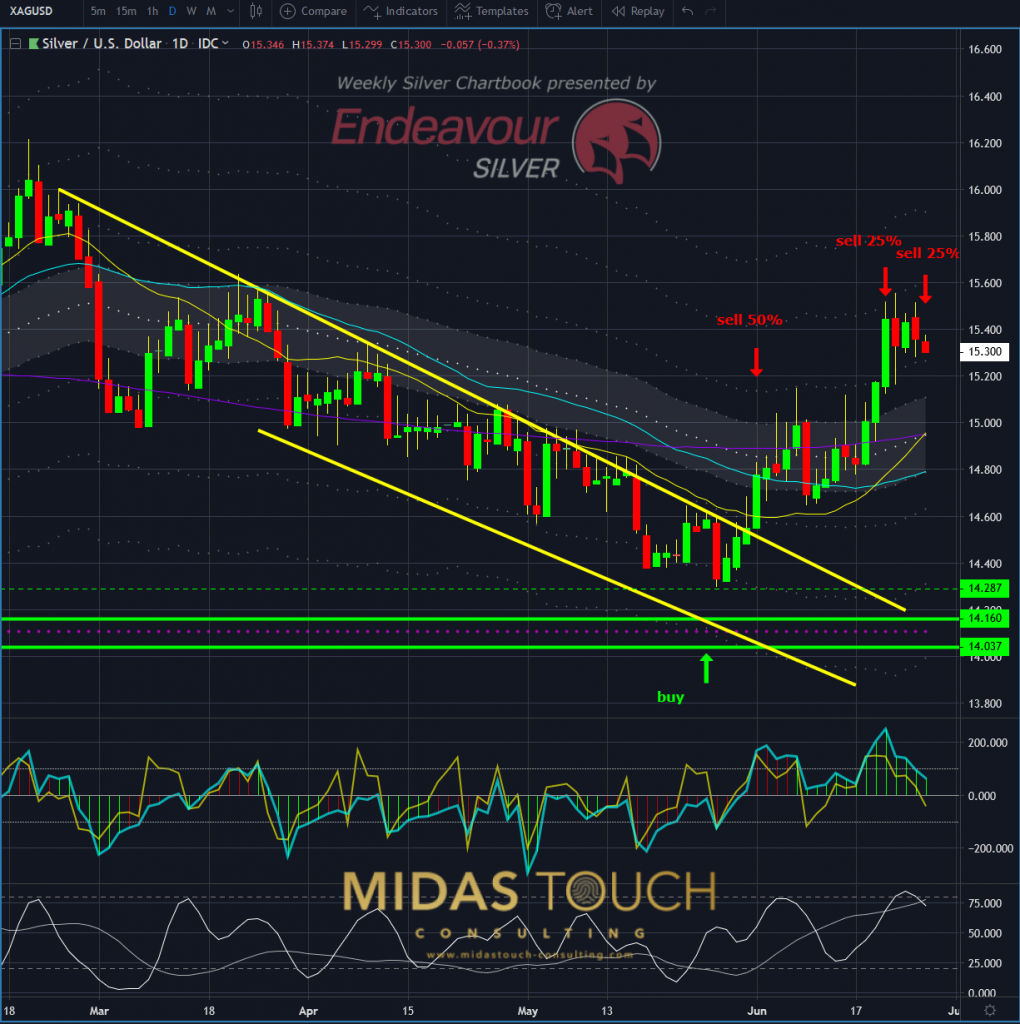
Silver in US-Dollar, daily chart as of June 25th, 2019
Daily chart as of June 25th 2019, Gold, first signs that the party might be over:
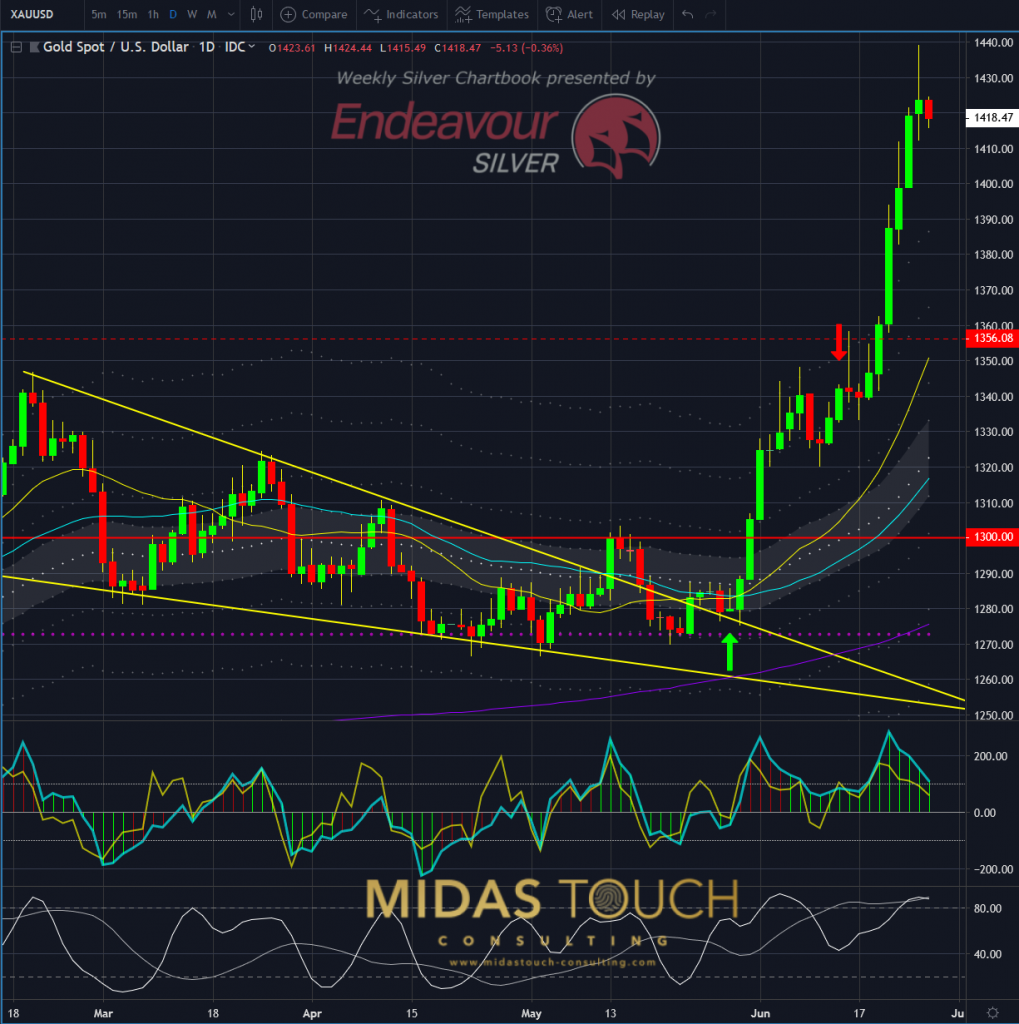
Gold in US-Dollar, daily chart as of June 25th, 2019
With a news heavy week (and following weekend), it felt prudent to take some money off the table. The question is always the same: “how much risk for how much profit”. If prices are extended, most of the time it is more profitable to leave the party at its peak and take a target exit versus cashing out with trail stop orders who are in most cases wrongly set. Stops should either be very tight or very wide. News often take out positions just at their worst uncle point, to than just quickly advance further. We prefer target exits over tightening stops and exiting markets before expected risk volatility, rather than hoping for the best.
Exposed on larger time frames, where larger swings are tolerable, it was a principle based choice to close out this weekly position to lighten up on exposure.
We advised in our live Telegram channel to re-buy at US$15.08.
June 26th 2019, Silver daily chart, observing the retracement:
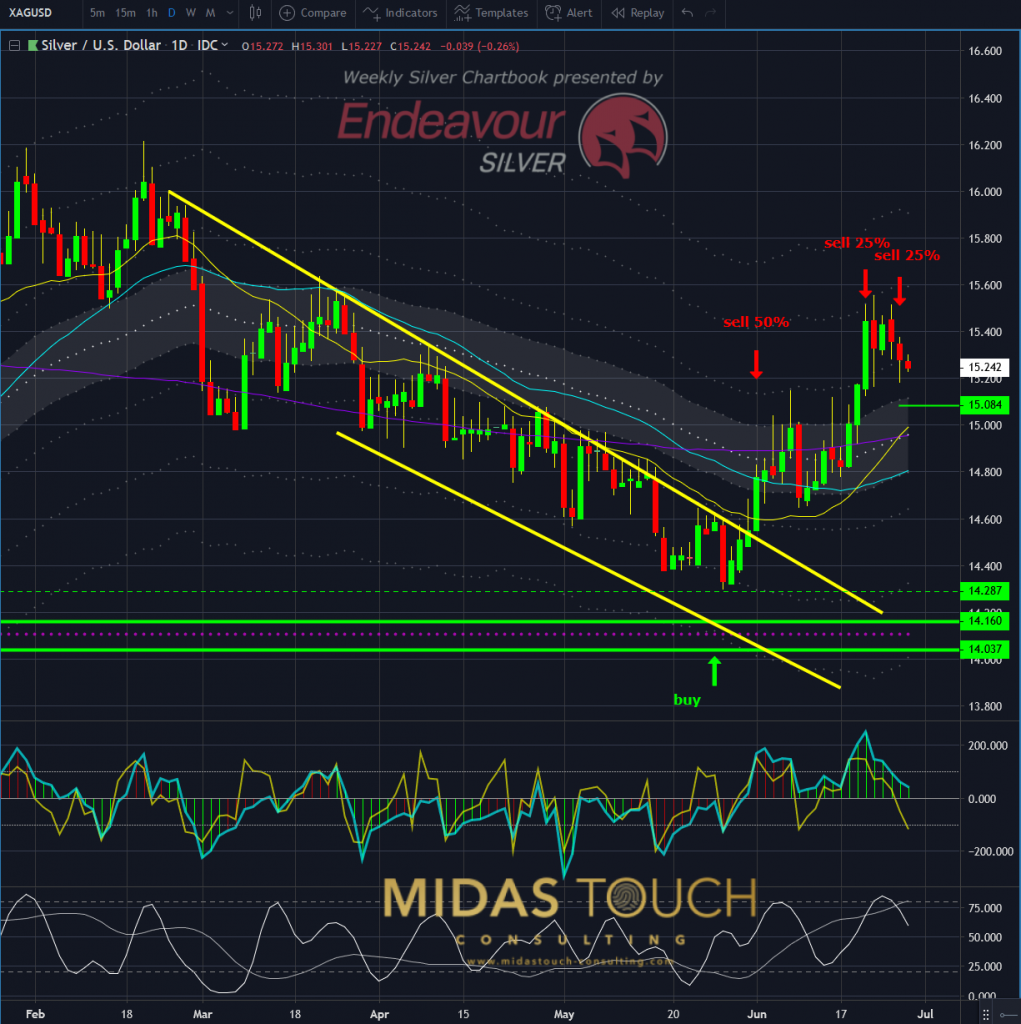
Silver in US-Dollar, daily chart as of June 26th, 2019
Daily chart June 26th 2019, Gold/US Dollar, prices pulling back towards US$1,400 level:
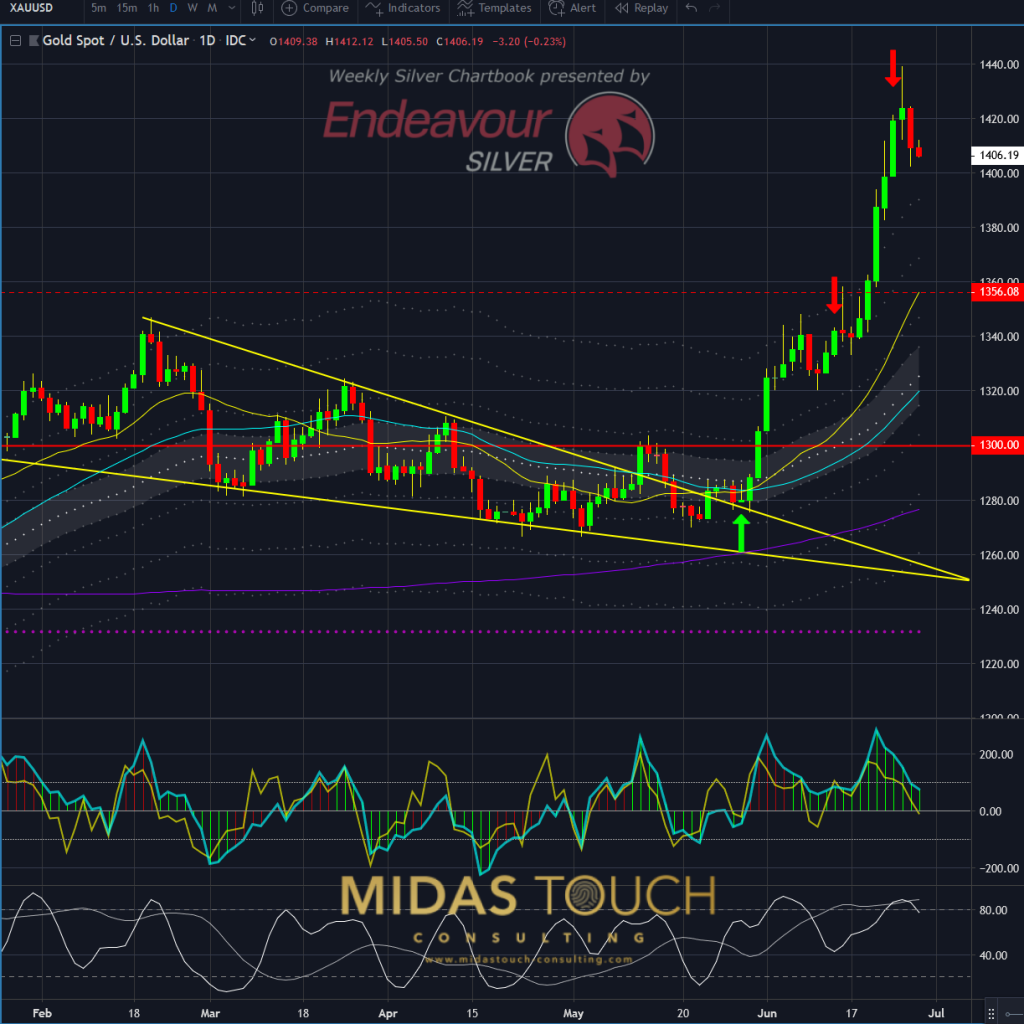
Gold in US-Dollar, daily chart as of June 26th, 2019
We expected the reversal to be a bit more aggressive. Still the plan was working so far.
June 28th 2019, Gold daily chart, the $1,400 support level bounce lost traction right after:

Gold in US-Dollar, daily chart as of June 28th, 2019
Silver/US Dollar daily chart, June 28th 2019, Silver showing some strength:

Silver in US-Dollar, daily chart as of June 28th, 2019
The cards had slightly shifted in Silver not continuing to drop as substantially as we hoped, but the overall idea of institutional risk mitigation causing a price decline was the right assumption. The beginning of next week will show how the rest of the story unfolds. We are in alignment with our scenario plotting in accordance to our low risk model.
Price range of where we see a low risk entry level Silver/US Dollar 60 minute chart, June 28th 2019:
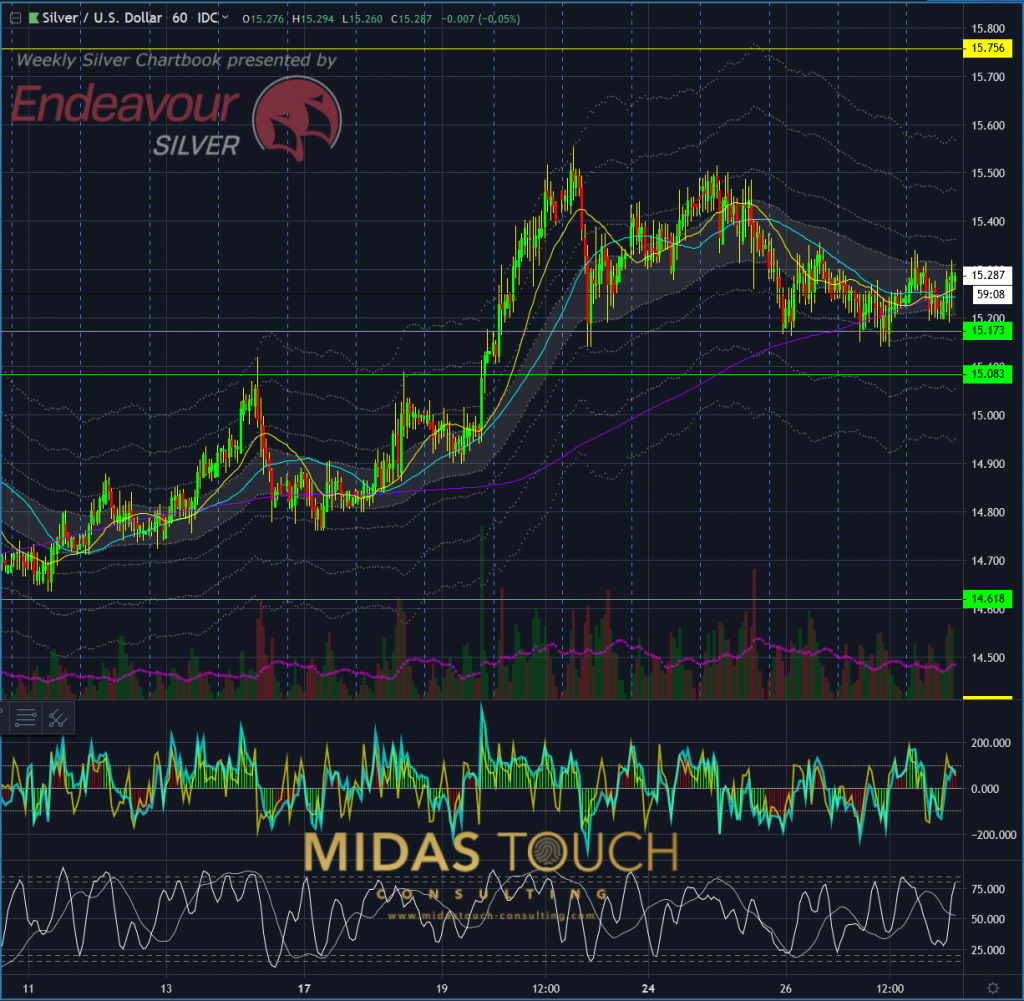
Silver in US-Dollar, sixty minute chart as of June 28th, 2019
We find entry prices in the range between US$15.08 and US$15.17 a low risk trade entry scenario. Having locked in substantial profits on the prior trade, and risk mitigation through a larger time frame silver holding, allows for a tight stop scenario play here and a possible reentry.
With this real life example of market behavior of silver prices versus gold prices, we tried to illustrate, that with plotting scenarios and defining exit and entry strategies, one gains a possible edge. Less prepared one likely falls back on intuitive behavior that “hopes for the best”, or otherwise emotional based actions.
In avoiding risks, but at the same time also planing on how to take risks, we aim to consistently take profits out of the market. We reinvest capital to the market for opportunity and do this over and over again.
Follow us in our telegram channel.
If you like to get regular updates on our gold model, precious metals and cryptocurrencies you can subscribe to our free newsletter.


