


Locked on to opportunity
Last week’s chart book title was: “It’s quiet – don’t fall asleep“. Not any more! A break of a month long sideways range to the down side has brought attention towards the crypto market again. While news paint a grim picture, for the astute market participant this smells opportunity. The timing component has changed so. While we are locked on to opportunity, this isn’t a case where one needs to be first. The range of price participation can be quite wide in percentage, like we have shared in this chartbook, it needs reminding of the potential rewards. History has shown that this specific market niche sees high percentage retracements, but in proportion sees even stronger price advancements following.
Monthly chart, BTC/USDT, October 25th 2019, “sitting on support”:
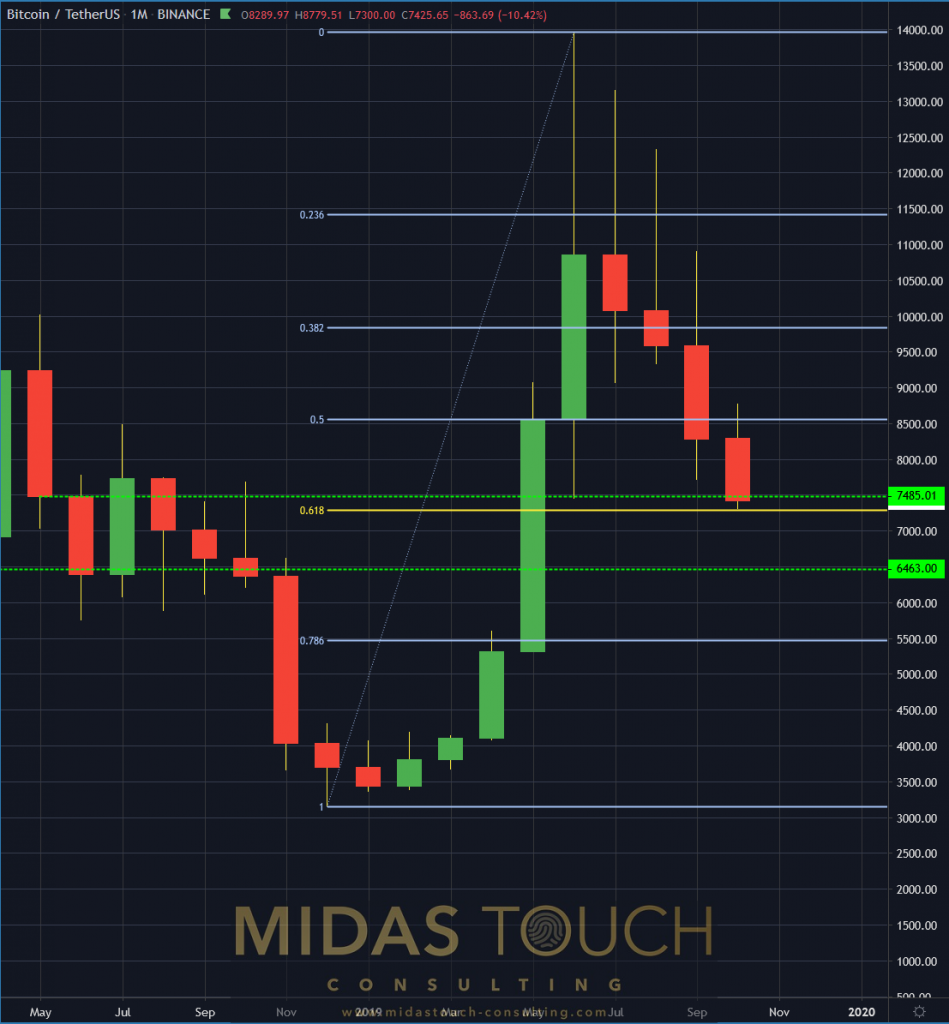
Bitcoin in TetherUS, monthly chart as of October 25th 2019
In the monthly chart above we can see that prices stopped precisely at the 0.618 Fibonacci retracement level. This comes to no surprise. As a matter of fact if you back-test all charting time frames over the last 9 years on bitcoin you will find that the fractal average of this particular percentage decline is the highest in probability occurrence. We are also near a strong horizontal supply and demand zone support price level. It is purely speculative in nature so when the specific turning point time frame will manifest.
The last, strongly bearish, monthly candle of the chart is not complete yet and as such speculation has a variant degree of two month. The closer this month comes to an end the clearer the picture will be in regards to timing. Entry timing being imperative for risk control (some of our guiding principles can be found in our glossary).
BTC/USDT, weekly chart, October 25th 2019, “locked on to opportunity, but wait for entry trigger”:
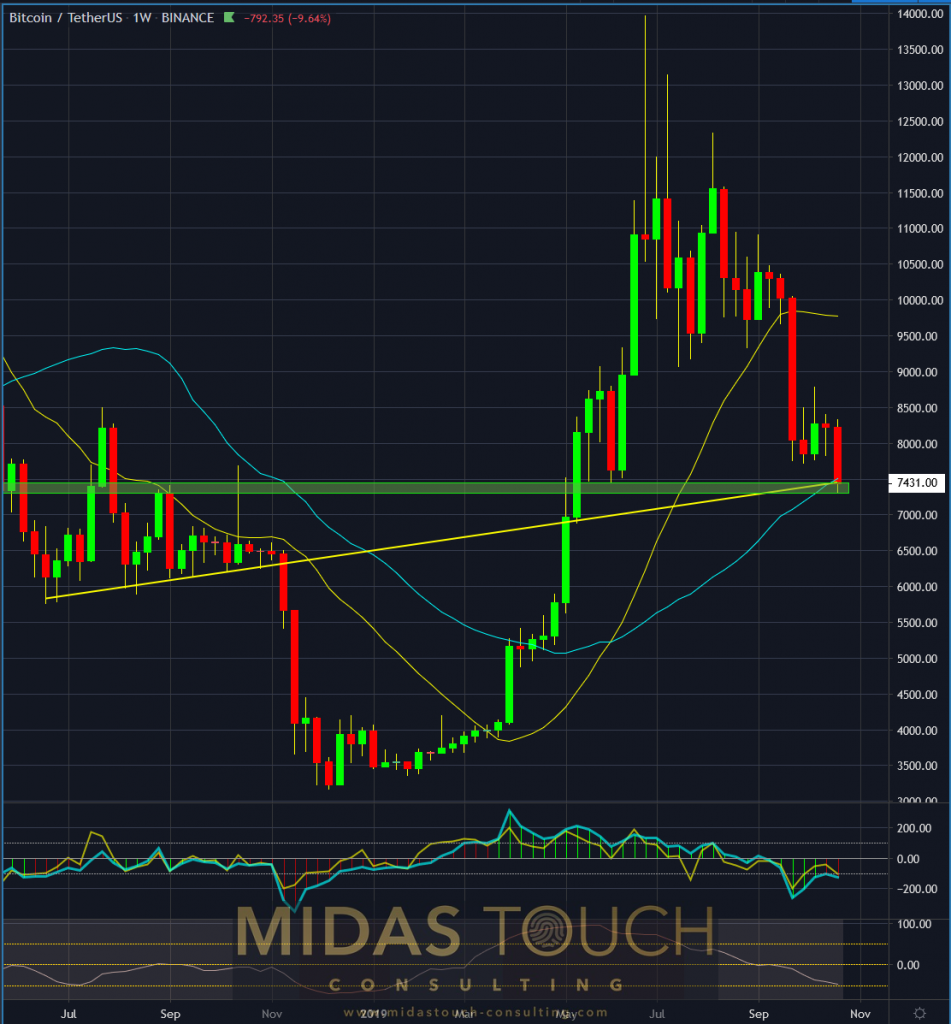
Bitcoin in TetherUS, weekly chart as of October 25th 2019
The weekly chart shows best, that we have good support here. As much as prices sit on a multiple support level of price, rotation for the turning might be to aggressive here for longer term plays. Only if a “V” formation should unfold within this week immediate participation is advised.
10/25/2019, BTC/USDT, daily chart, “what was support becomes resistance”:
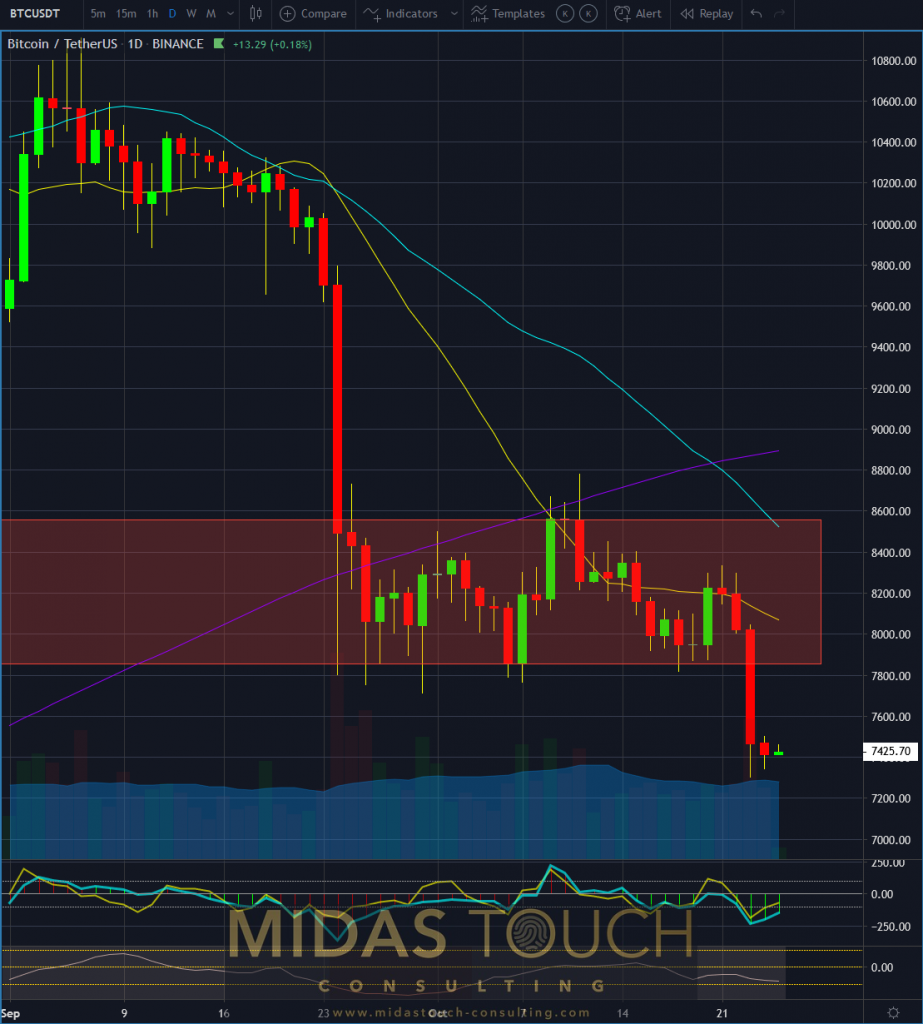
Bitcoin in TetherUS, daily chart as of October 25th 2019
A 30 day sideways range has been broken recently and as such is now a hurdle to be penetrated. Risk reward ratios are just fine for 60 minute plays and daily position plays that we post live in our telegram channel. Some runners of these plays might even transfer to higher time frame expansions. Should prices penetrate deeply within the next three days into the prior sideways range affirmative action is called for.
Locked on to opportunity
The importance in this particular segment of the market is focus and patience. While news chatter might increase in negative sentiment, the market speculators job is to be locked on to opportunity. Many traders merely focus on price levels and once reached, engage into the market. While this at times can be a productive approach, it is not all the time ideal. Good entry timing produces the lowest risk exposure for ones money. The charts above show that at this point of time, with a top down time frame approach, it is prudent to be engaged with strong focus, but not quite ready for the trigger finger. A trigger being either a daily “V” formation, confirming the turning point, or a weekly bar takeout.
All charts timely posted in our telegram channel.
If you like to get regular updates on our gold model, precious metals and cryptocurrencies you can subscribe to our free newsletter.

