


It´s been a difficult summer for bitcoin and the crypto sector. While in end of June everybody was really excited again, the multi month summer doldrums coupled with the recent sell off towards US$7,700 have killed optimism once again. However, Bitcoin and many of the beaten down altcoins are now offering a very promising risk/reward ratio. Bitcoin – Buying Opportunity!
Review
After an impressive rally in the first half of 2019 Bitcoin reached a high point on June 26th, 2019 at US$13,887. Since then there has been a correction of several months now which has resulted in the long-awaited pullback down to below US$8,000. Despite three small dips Bitcoin had managed to hold above US$9,450 during summer. However, since early September market participants became increasingly aware of the emerging descending triangle. Finally, on September 24, Bitcoin prices not only dropped below the lines of support but slid to almost US$7,700 without much opposition. Only at this lower level a stabilization can be observed for two weeks, but so far this base has not been able to initiate a little bounce at least.
Technical Analysis For Bitcoin
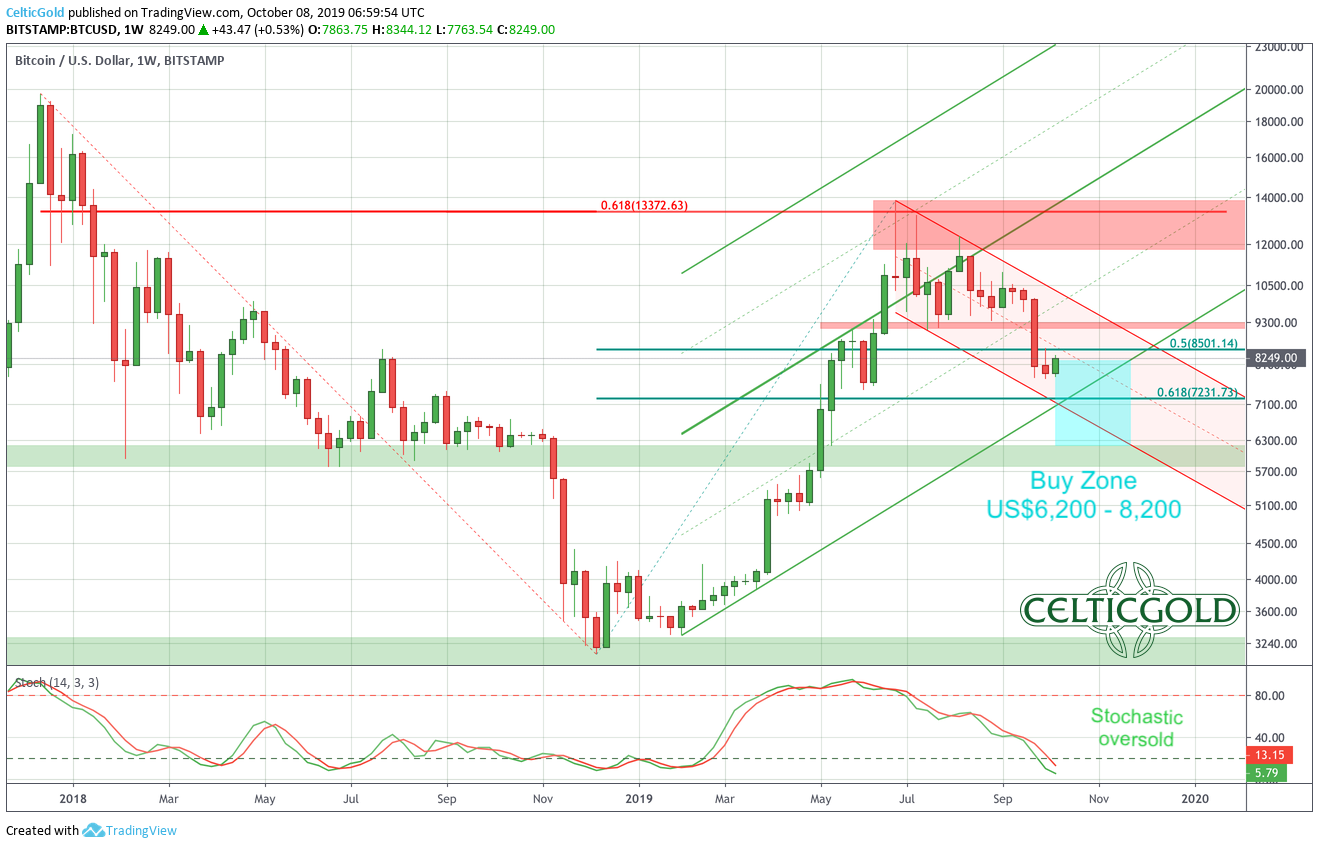
Bitcoin in US-Dollar, weekly chart as of October 8th,2019. Source: Tradingview
On the weekly chart, it is first of all important to understand that the strong rally in spring so far has “only” brought Bitcoin back to the 61.8% retracement of the crypto winter. At the same time, a move above the June high around US$13,887 probably implies an attack against the all-time high around US$20,000, which was reached on December 17th, 2017. A renewed rise to this all-time high certainly argues for the continuation of the bull market and of course for new all-time highs in the big picture.
Interestingly, the correction since the end of June has meanwhile turned the weekly chart to heavily oversold. Thus, the most important prerequisite for a new multi months up-wave has already been laid. However, there are still no clear trend reversal signals. Although the Stochastic Oscillator pulled deeply back into the oversold zone, it has not turned up yet. Basically, bitcoin prices have now plunged into the zone between their 50% retracement at US$8,500 and their 61.8% retracement at US$7,230 of the spring rally. Normally, markets will find sufficient support in this region to at least initiate a countermovement. In the worst case, however, Bitcoin will fall further back to the well-known support zone by around US$6,200.
For investors and swing traders, whose time horizons should be at least a few weeks but ideally several months or years, the US$6,200 to US$8,200 zone is now an admittedly broad but meaningful buying zone. The remaining downside risk seems manageable. Only if Bitcoin falls below US$5,800 again, we must expect the continuation of the crypto winter.
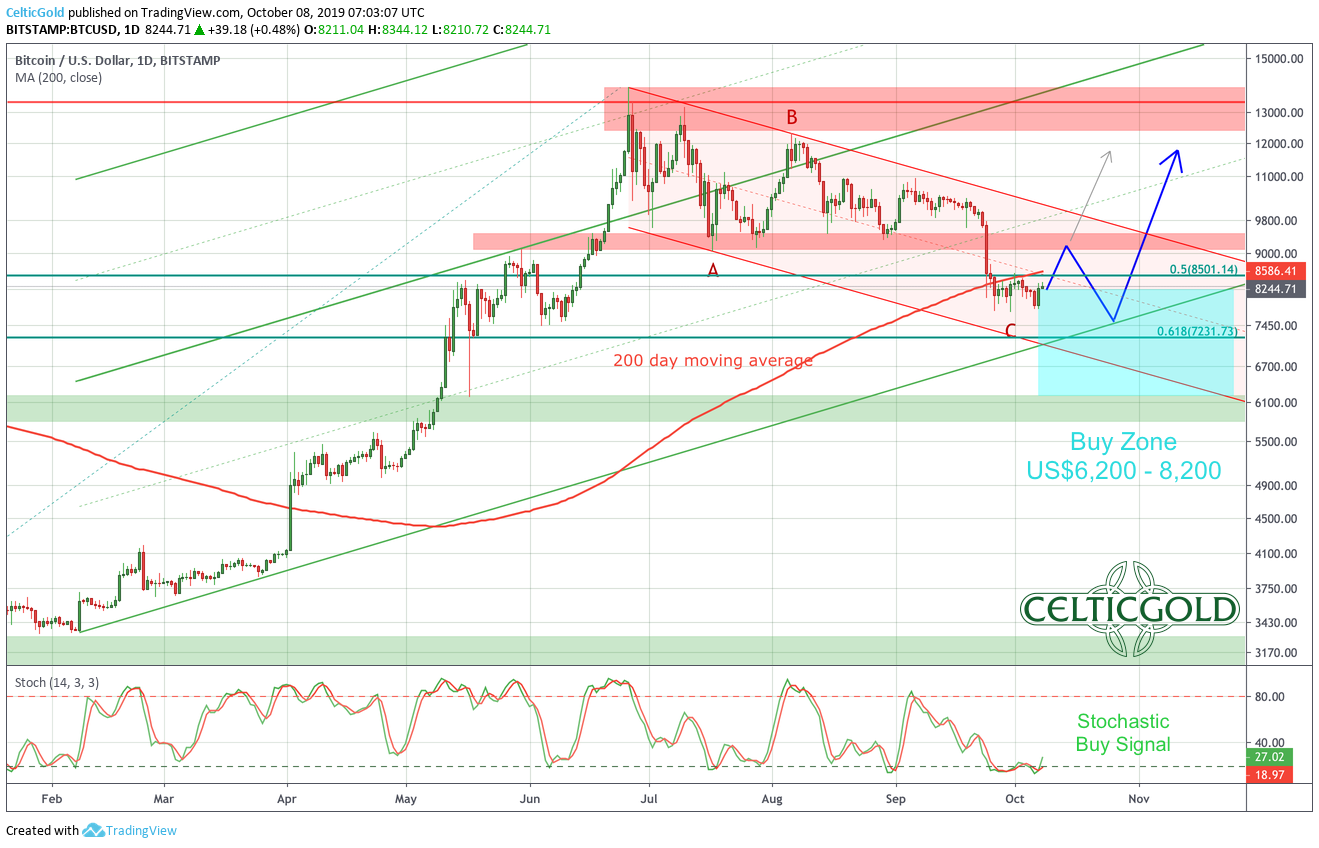
Bitcoin in US-Dollar, daily chart as of October 8th, 2019. Source: Tradingview
Meanwhile on the daily chart, the correction has led prices back to the rising 200-day moving average (US$8,536). While Bitcoin moved way too far away from this moving average in early summer, it should now somehow stop the sell off. Although the volatile nature of Bitcoin almost always provides an overshoot in one direction or another, the 200-day moving average should now be able to initiate at least one recovery. The fact that prices have fallen below this line by nearly US$800 is therefore no reason for concern. Rather, this classic moving average is likely to act like a rubber band and should push prices back to the upside. The Stochastic Oscillator is confirming the promising setup with a fresh buy signal. In contrast to the weekly chart, there is evidence of the first trend reversal signals. Especially in the short term, the remaining downside risk seems rather comprehensible. And it is justified to say Bitcoin – Buying opportunity
Overall, a recovery to US$9,100 is likely to be more or less imminent. However, if bulls fail here, Bitcoin will sell off again and might very likely fall even below US$7,700 to test the uptrend-line (currently around US$7,050). Just like on the weekly chart, incremental purchases between US$6,200 and US$8,200 make sense.
Commitments of Traders Report For Bitcoin
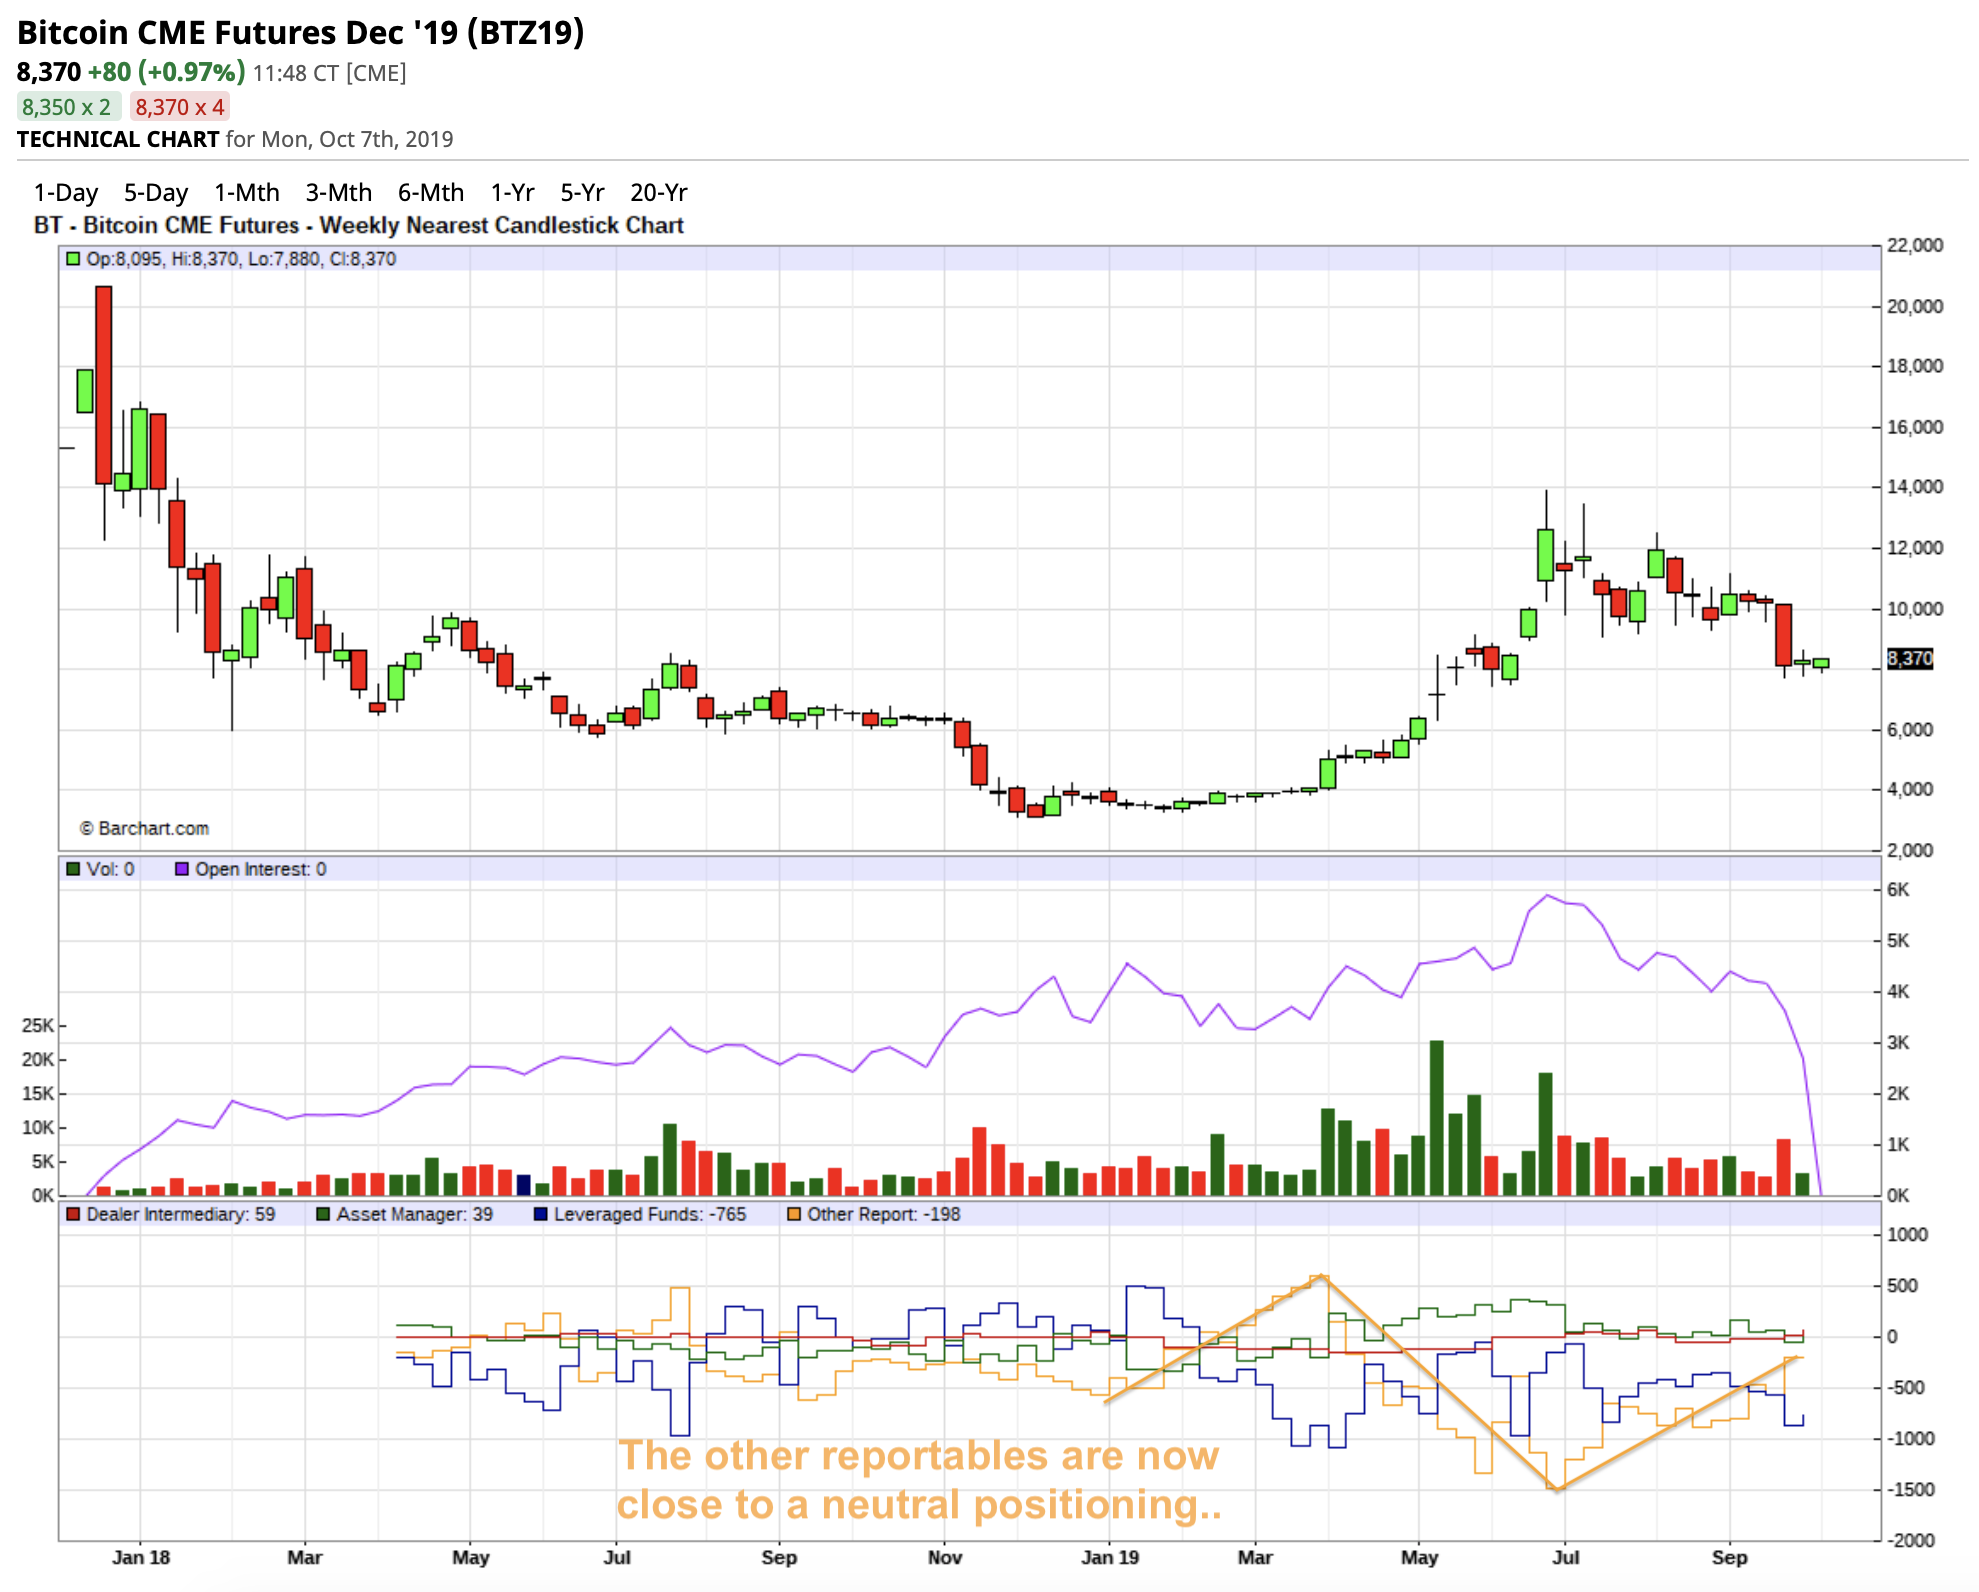
Commitment of Traders for Bitcoin as of October 2nd, 2019. Source: Barchart
The decline in price has further improved the CoT report for the Bitcoin Futures. Although there is not yet a real contrarian bottleneck, the “Other Reportables” group has almost completely covered their short positions. Among the “Other Reportables” the U.S. Commodity Futures Trading Commission (CFTC) puts together all reportable traders who cannot be attributed to any of the three groups of producers, swap dealers or money managers together.
From a contrarian point of view and in retrospect, this group has played the bitcoin rally almost perfectly this year, because at the start of the Rally in April they were heavily positioned on the long side. Until mid-June, the “Other Reportables” then moved further and further to the short side. In the last three months, they have gradually covered their shorts into falling prices again. As soon as this group starts building up long positions again, we should do the same way.
If one follows the group of the “Other Reportables” the remaining risk on the downside is very is now rather small. However, this group is not yet positioned for a new upturn in Bitcoin. So the CoT report is still suggesting more patience.
Sentiment Bitcoin – Buying opportunity
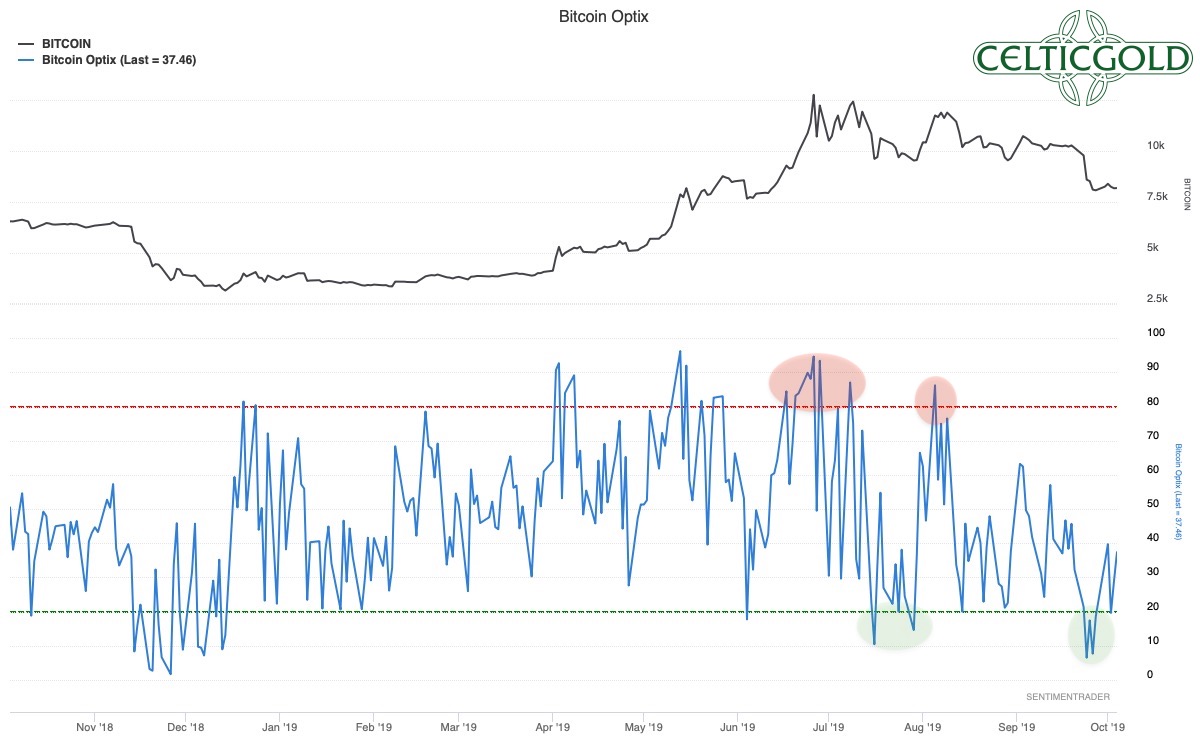
Bitcoin Optix as of October 5th, 2019. Source: Sentimentrader

Source: Crypto Fear & Greed Index

Source: Crypto Fear & Greed Index
The little crash below US$9,000 two weeks ago created a highly pessimistic sentiment. “Sentimentrader” as well as the “Fear & Greed Index” clearly show that there is too much fear among market participants. Therefore sentiment analysis provides a buy signal.
5. Seasonality Bitcoin – Buying Opportunity
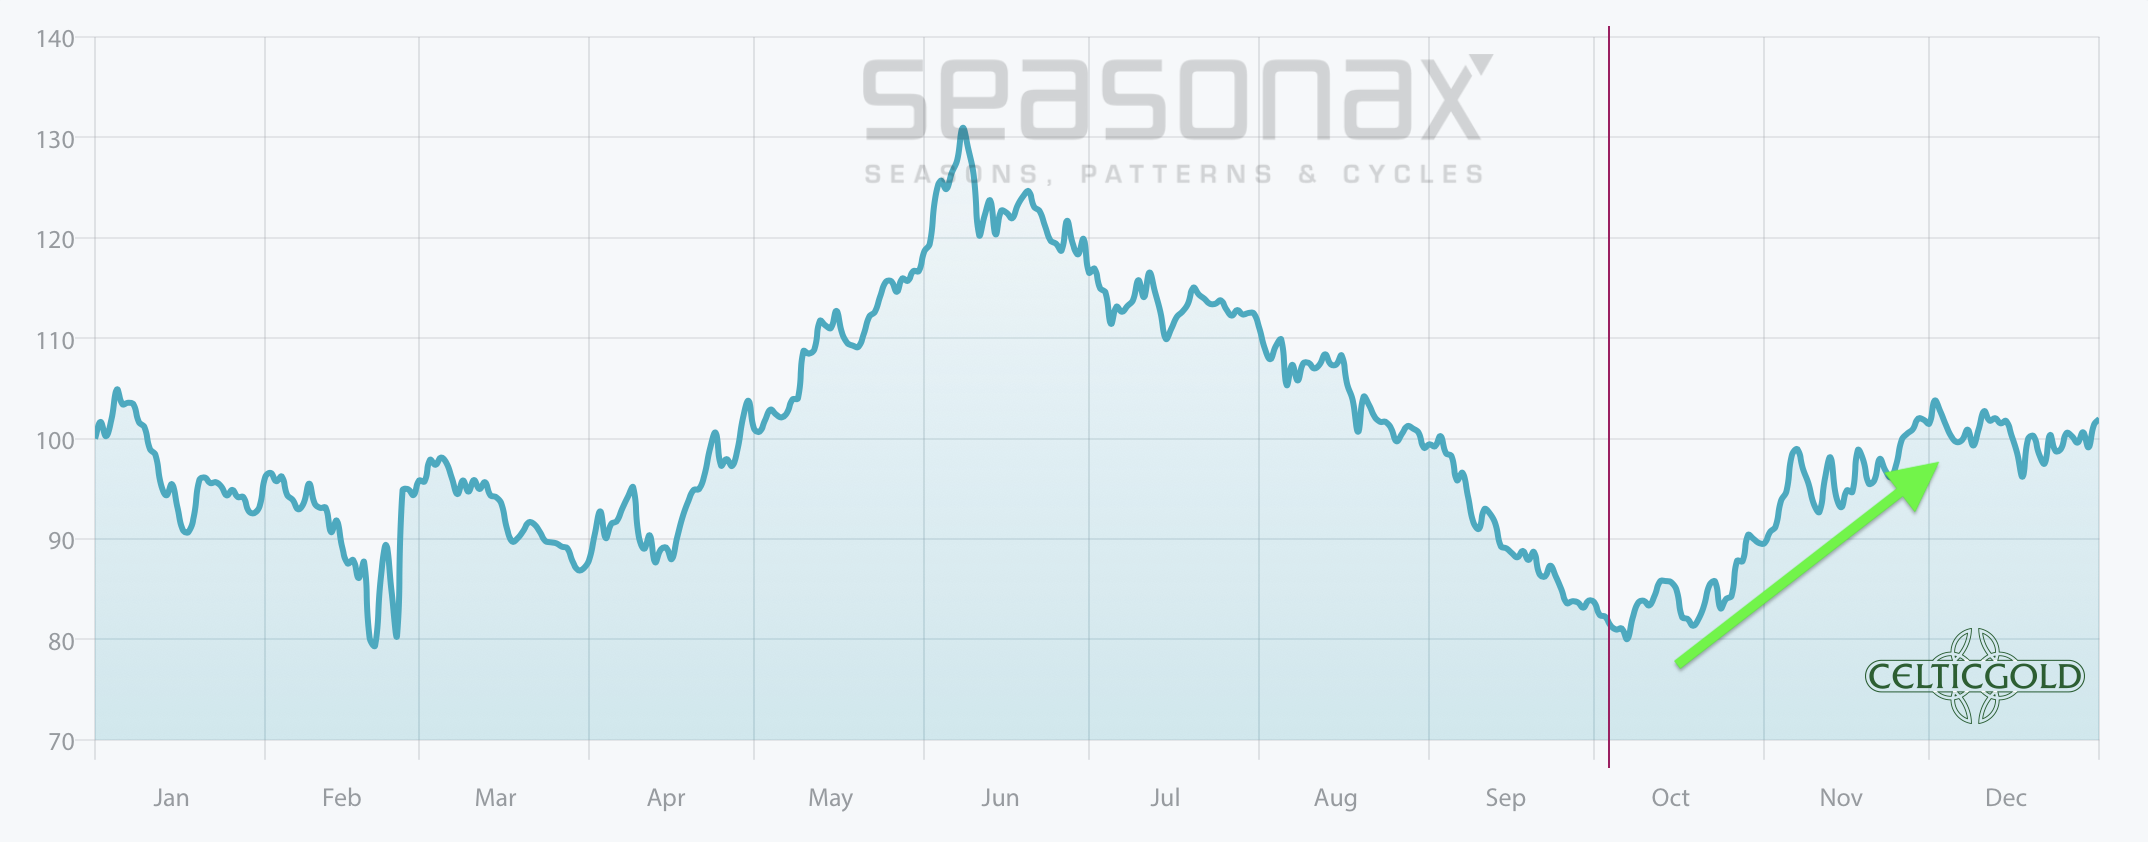
Seasonality for Bitcoin as of October 8th, 2019. Source: Seasonax
Based on the evaluation of the first 10 years of its existence, Bitcoin has developed a fairly clear seasonal pattern. Currently we would be at the beginning of a solid upward movement, which is statistically typical for the 4th quarter of the Bitcoin. In summary, seasonality provides a buy signal too. Any further setback could be the starting point for a rally over the next two to three months.
6. Bitcoin against Gold
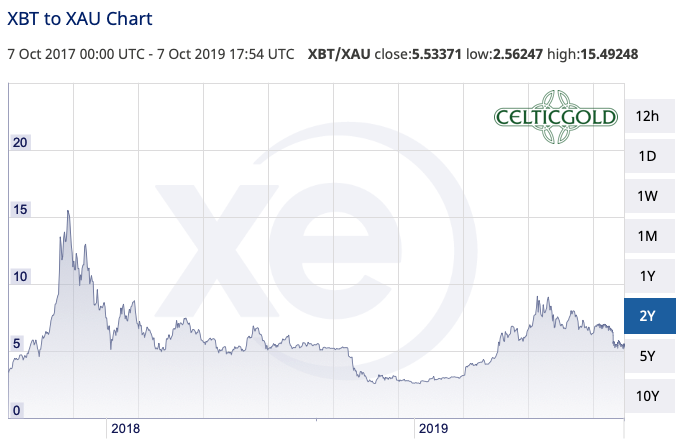
Bitcoin in Gold as of October 8th, 2019. Source: XE
Currently, a bitcoin “only” costs 5.53 ounces of gold. In other words, one ounce of gold currently costs 0.18 Bitcoin! Thus, gold has appreciated by more than 33% against Bitcoin in the last three months. Due to the current opportunity in Bitcoin determined in this analysis as well as the undeniable probability of a gold price correction, the focus or the overweighting towards Bitcoin makes gradually sense again.
Basically, one should be invested in both asset classes. The recommended allocation in precious metals (primarily physical) should be at least 10% and a maximum of 25% of one’s total assets. In cryptos and especially in Bitcoin investors should hold at least 1% and a maximum of 5%. If you are very familiar with crypto currencies and Bitcoin, you can individually allocate higher percentages in Bitcoin. For the normal investor, who of course is invested mainly in equities and real estate, holding 5% in the highly speculative and highly volatile Bitcoin is already quite a lot!
Conclusion and recommendation: Bitcoin – Buying opportunity
As expected, Bitcoin prices have corrected strongly in the last three and a half months. As well, they have now closed the open gap in the Bitcoin future around US$8,500. Basically, whenever a market rises sharply, it will and must then also correct strongly. That’s exactly what happened to Bitcoin again. Basically, a normal and healthy process. Contrarian and patient investors are now finding a sold-out market that once again offers wonderful opportunities on the upside. Although the bottom may not yet be found, the downside risk is very comprehensive. The worst-case scenario is a final selloff towards US$6,200. However, given the typically strong 4th quarter, it does not necessarily have to be such a low price anymore.
In any case, we are now in the accumulation phase. Multiple smaller purchases on weak days between 6,200 and 8,200 US dollars should lead to considerable profits within a few months. Maybe the currently depressed prices are the last chance to get into Bitcoin before the rally towards the all-time highs around US$20,000 starts. That alone would be more than a double from current price!
On top of that, the market capitalization and all the fundamental indicators such as the number and use of Bitcoin wallets, the size of each individual block, the number of transactions as well as the hash-rate and the value of the entire network have been continuously growing for 10 years.
Analysis sponsored and initially published by www.celticgold.eu.
If you like to get regular updates on our gold model, precious metals and cryptocurrencies you can subscribe to our free newsletter.

