It’s quiet – don’t fall asleep
When everybody in the gym is bragging on how they are killing it at penny stocking or how they just have purchased their fifth house on credit, one knows it is time to get out of the stock or real estate market. From a sentiment perspective there is more noise when exits are near. On the other hand, one might want to wait for mainstream publications being extremely bearish in their sentiment to become an aggressive buyer. More often than not however, it simply gets very quiet. When certain market niches fall out of favor as prices drop, it is the time to be alert. Participating in principle in a field of uncertainties, a future unknown, we find comfort in confirmations. That is precisely what these quiet times do not offer. It is than, when professional investors and traders become active. They know that it is not their job to be right, but merely try to identify times when risk is low for possible large rewards. It’s quiet – don’t fall asleep.
The following four charts are higher time frames (monthly and weekly). We would like to encourage the reader to briefly examine these studies and ask themselves the question. In a market like this, would you like to be long, short or on the sidelines? It is said that “A picture is worth a thousand words”. Let us take this advise literally in a time when the crypto market has slightly fallen out of favor and out of the major headlines. Let the charts speak for themselves.
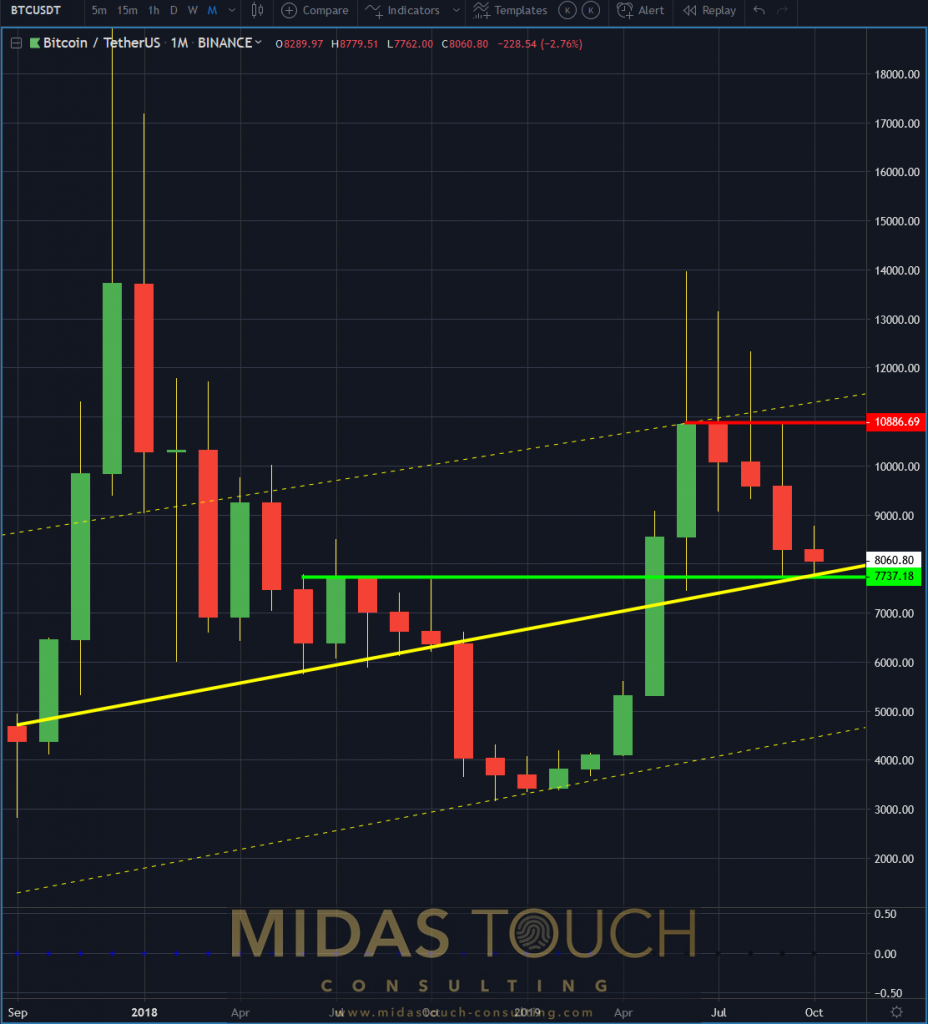
Monthly chart, BTC/USDT, October 18th 2019, “a quiet chance”:

Bitcoin in TetherUS, monthly chart as of October 18th 2019
In this monthly chart it becomes obvious that support both horizontal and directional in nature is supporting price. A professional speculator is aware that the outcome of a market play is uncertain. At the same time he knows the call to action when risk reward ratios are overwhelmingly in favor (you can find some of our strategy approaches here).
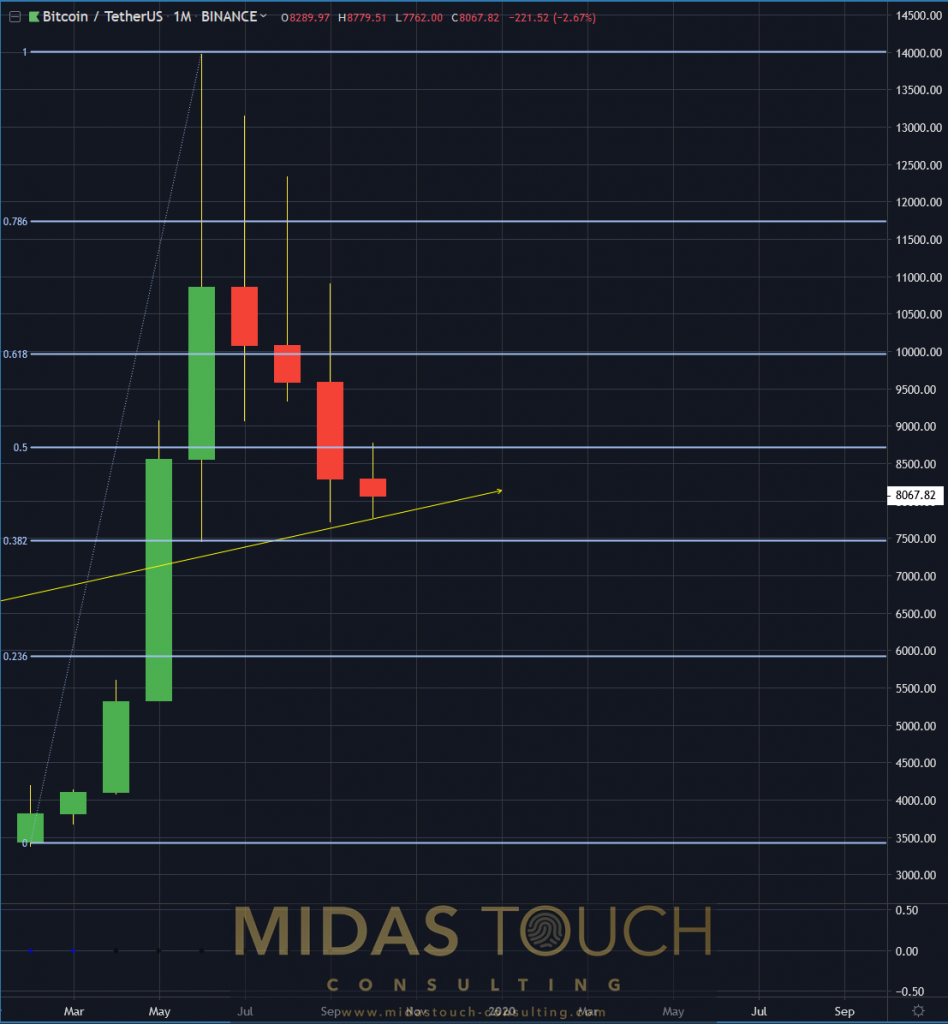
BTC/USDT, monthly chart, October 18th 2019, “breath harmony”:

Bitcoin in TetherUS, monthly chart as of October 18th 2019 b
Price behavior is like breathing. Inhaling and exhaling needs to alternate. During the first six month of this year, bitcoin prices took a deep breath with an advancement of more than 400%. It is therefore only natural, that an exhale is following since four month. The chart above shows this exhale to be quite harmonious in proportion.
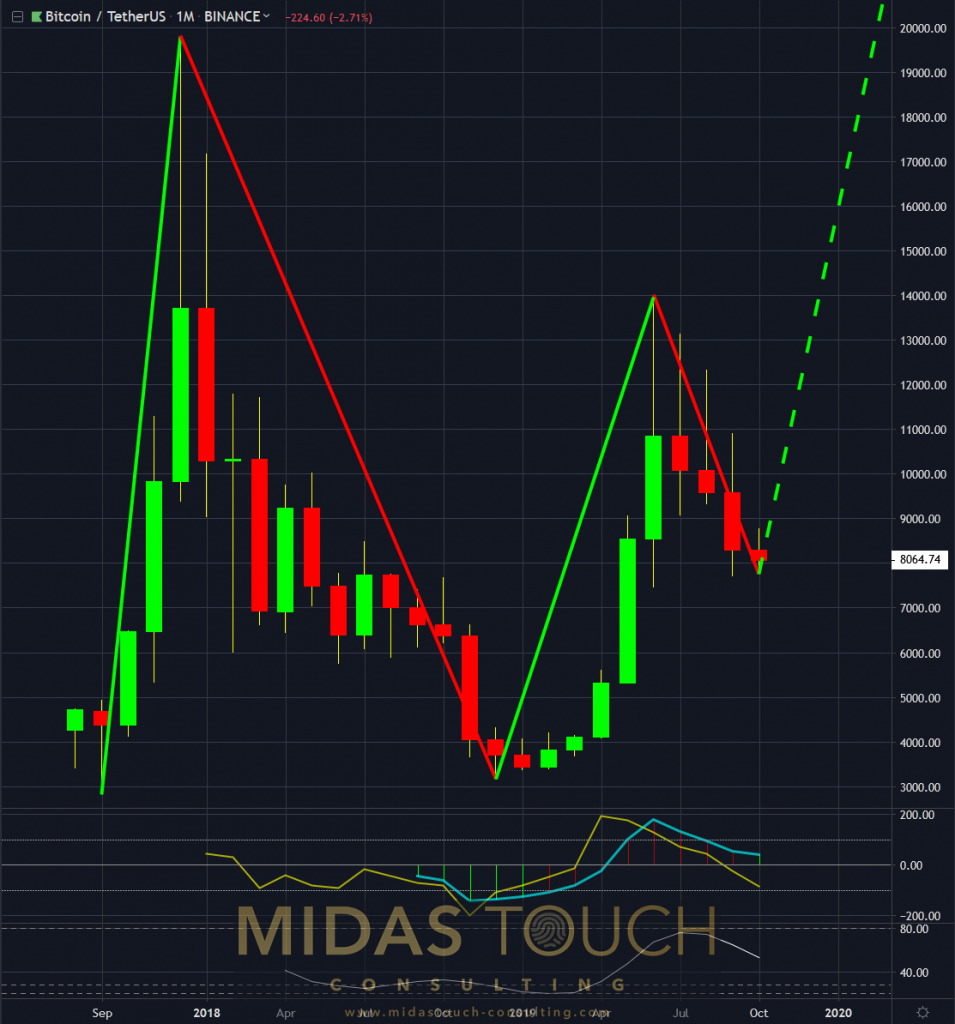
It’s quiet – don’t fall asleep, 10/18/2019, BTC/USDT, monthly chart, “a strong recovery”:

Bitcoin in TetherUS, monthly chart as of October 18th 2019 c
For this chart book we purposely have chosen large time frames only, since they are the dominate and most important sentiment play of all time frames. The fact that Bitcoin recovered from a near 100% retracement until around US$14,000, suggests a more likely scenario for a new price advancement. We have made first efforts to harness this larger time frame turning point with live long entry posts in our telegram channel.
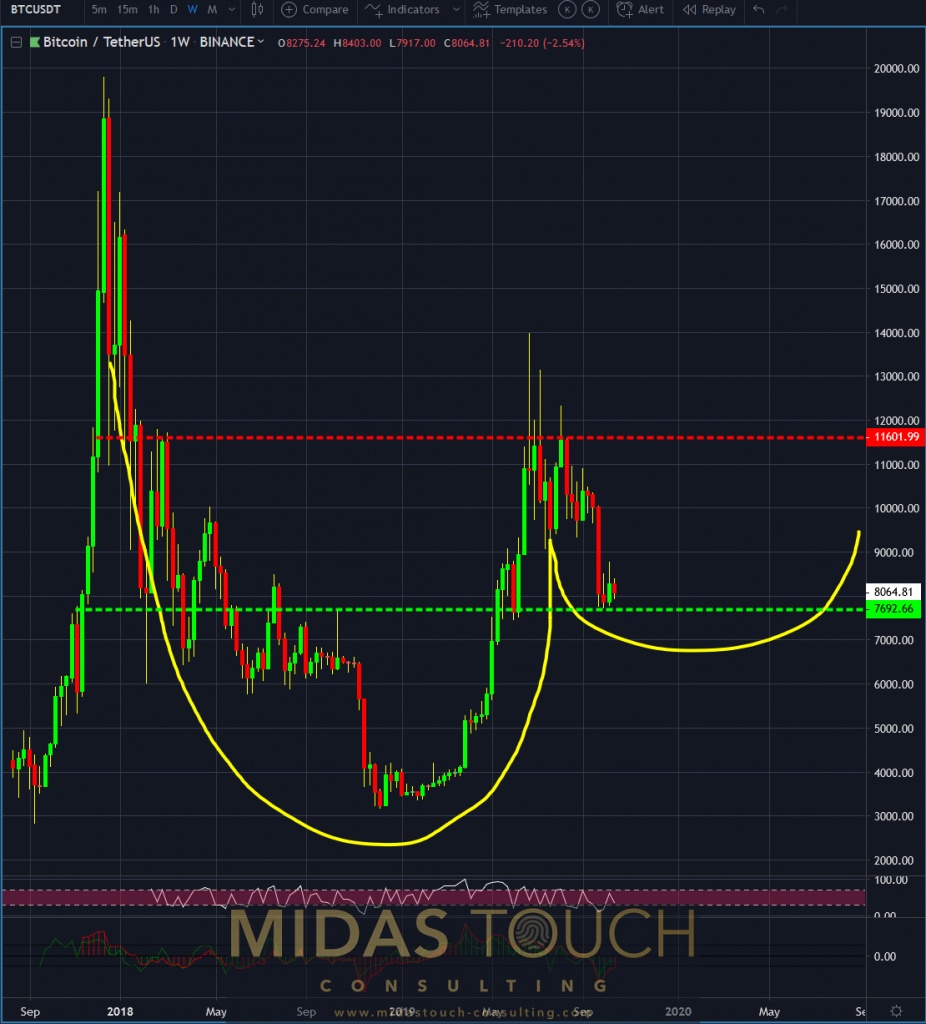
BTC/USDT, weekly chart, 10/18/2019, “one possible scenario”:

Bitcoin in TetherUS, weekly chart as of October 18th 2019
The weekly chart above hints towards one possible future outcome of bitcoin´s price behavior. While speculative in nature, this formation is widespread as a fractal occurrence throughout history and the various time frames in this specific market. As such it has statistical merit.
It’s quiet – don’t fall asleep
If you are participating in the markets as a speculator, many of the principals we share throughout our weekly chart books aren’t new. Nevertheless the markets still at times seem to elude. The well known saying that 90% of the market’s game is psychology, is hidden in the paradox that there is a vast difference between knowing and doing! You might know how to act when it is quiet. Doing so is a totally different ballpark. We naturally seek company & confirmation and acting in isolation against the grain and in the quiet, takes effort and repetitive training!
All charts timely posted in our telegram channel.
If you like to get regular updates on our gold model, precious metals and cryptocurrencies you can subscribe to our free newsletter.


