Same price – different psychology
We posted live in our telegram channel, a directional continuation long entry for silver on the 17th of this month. Three days later we published our weekly chartbook, but didn’t advise for a long entry, even though prices were almost identical. Why? One aspect was that the chart book was providing a larger view and as such a larger time frame outlook. It is imperative to not succumb to time frame relativity errors. Different time frames have a different perspective on the market. That was not entirely the case in this instance though. The same price does not mean the same trade or the same risk it rather means same price – different psychology.
An entry on the 20th of this month would have been a breakout play not a continuation pattern. Psychology, risk, position size and other factors would have been entirely different. Not only are we not big fans on breakout plays but in this case news were the driving factor. In addition, we especially do not favor breakout plays in extended markets. Different psychology results in a vastly different method of execution – an aspect that can strongly influence the outcome of a trade. Same price – different psychology.
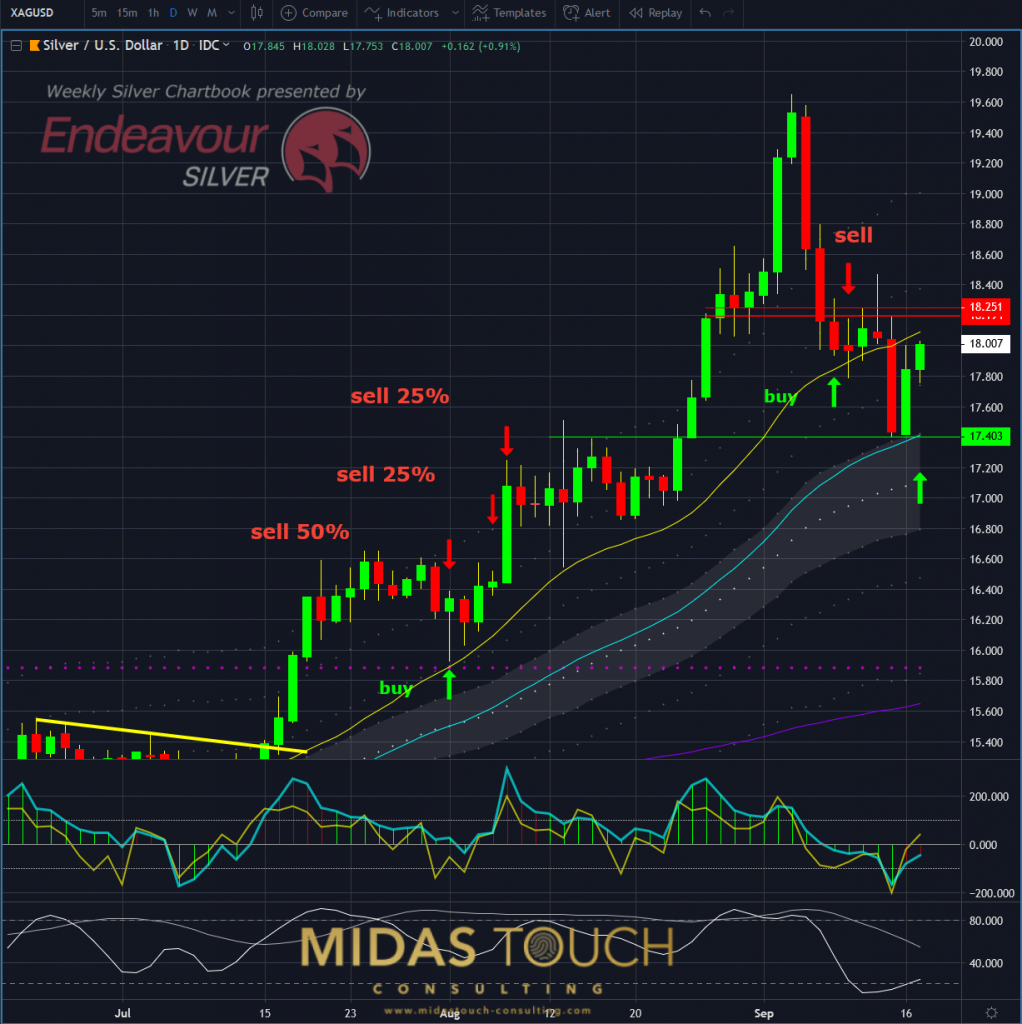
Daily chart, silver/US Dollar 9/17/2019, continuation play :

Silver in US-Dollar, daily chart as of Sep 17th, 2019
This continuation entry confirmed, on light position size and late in the overall game and trend, and showed promise. Due to the healthy retracement and an intact silver trend overall with favorable internals on the day of entry. There was also confluence with the gold market on the day of entry.
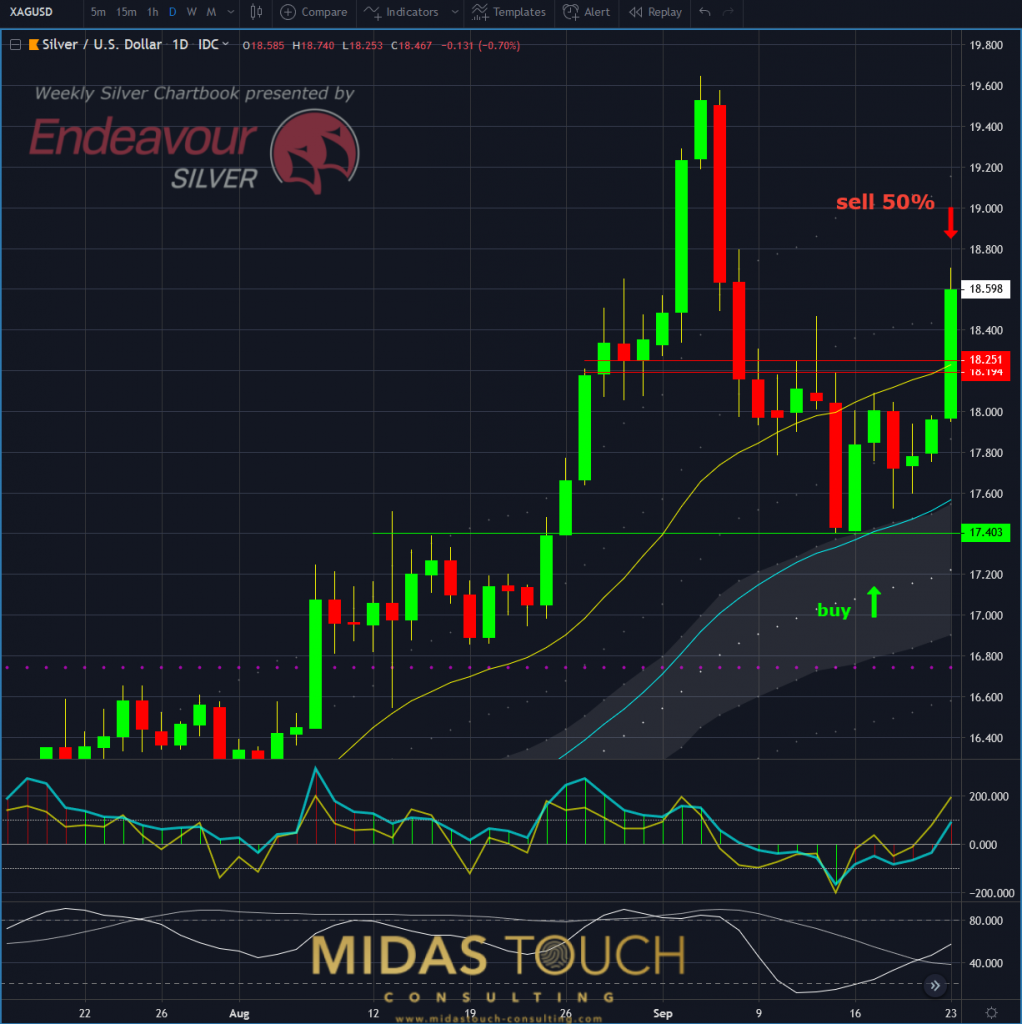
Same price – different psychology, silver, daily chart, 9/23/2019, financing target reached:

Silver in US-Dollar, daily chart as of Sep 23rd, 2019
On the 23rd of September news driven markets had silver prices breakout through resistance. Our first target to take the risk out of the trade by taking half off the table was reached. After that we adjusted stop levels to our entry point to take the risk out of the trade and lock in profits. Exit and stop adjustment were announced live in our telegram channel.
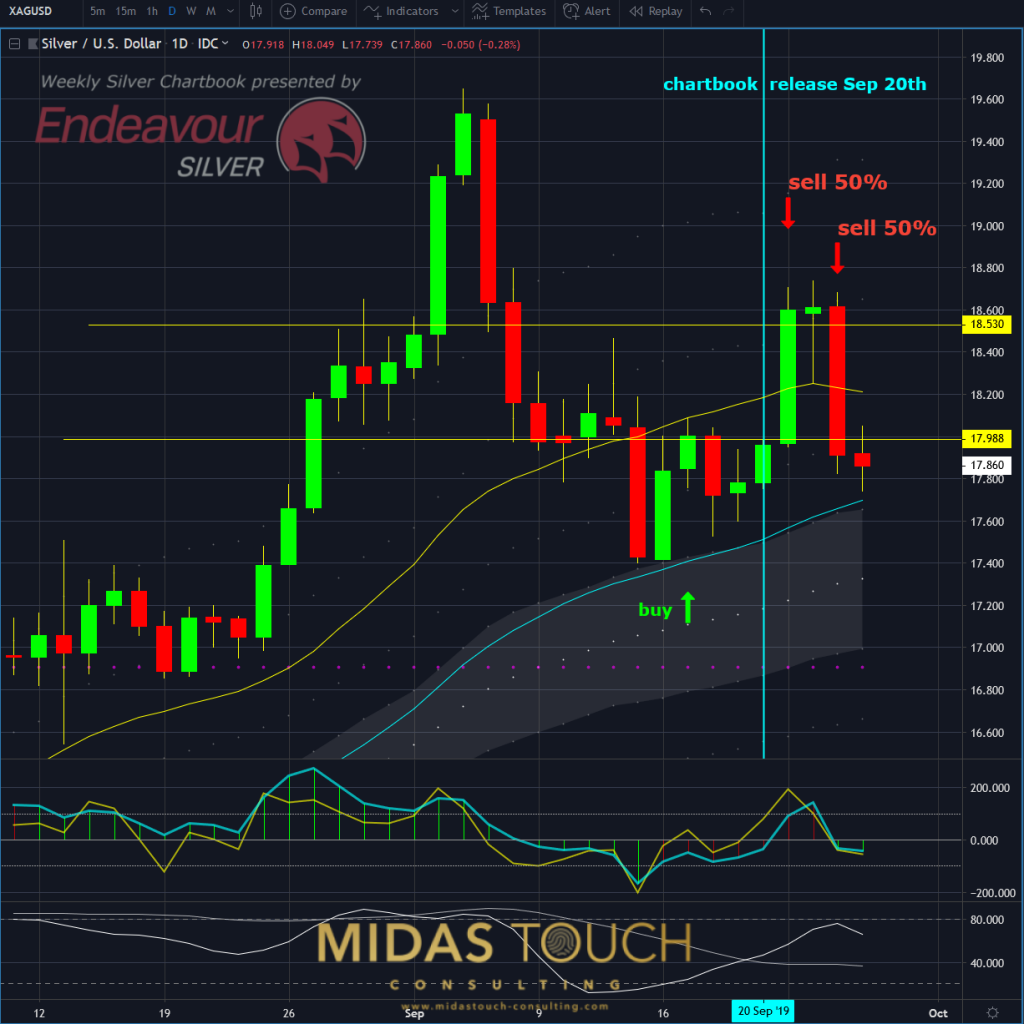
Daily chart, same price – different psychology, silver in US Dollar – September 26th 2019, stopped out with rest position:

Silver in US-Dollar, daily chart as of Sep 26th, 2019
The chart above shows how only 2 days later this quick price burst up, collapsed by a more than 100% retracement. We locked in nice profits on half of the position, but the remainder of this trade’s capital got stopped out at breakeven. The yellow lines represent entry and financing target price. The light blue vertical line illustrates the moment of time that we explained at the beginning of the article, the possible breakout trade scenario.
Our trade (entered on the 17th) at the moment of the news move already provided for a psychology of stability by having gone through a prior negative p/l right after entry. A breakout scenario entry on news would have equaled a moment of great uncertainty and emotional risk. A whole different tool box would have applied not only from a psychology perspective. That is to say, same price – different psychology.
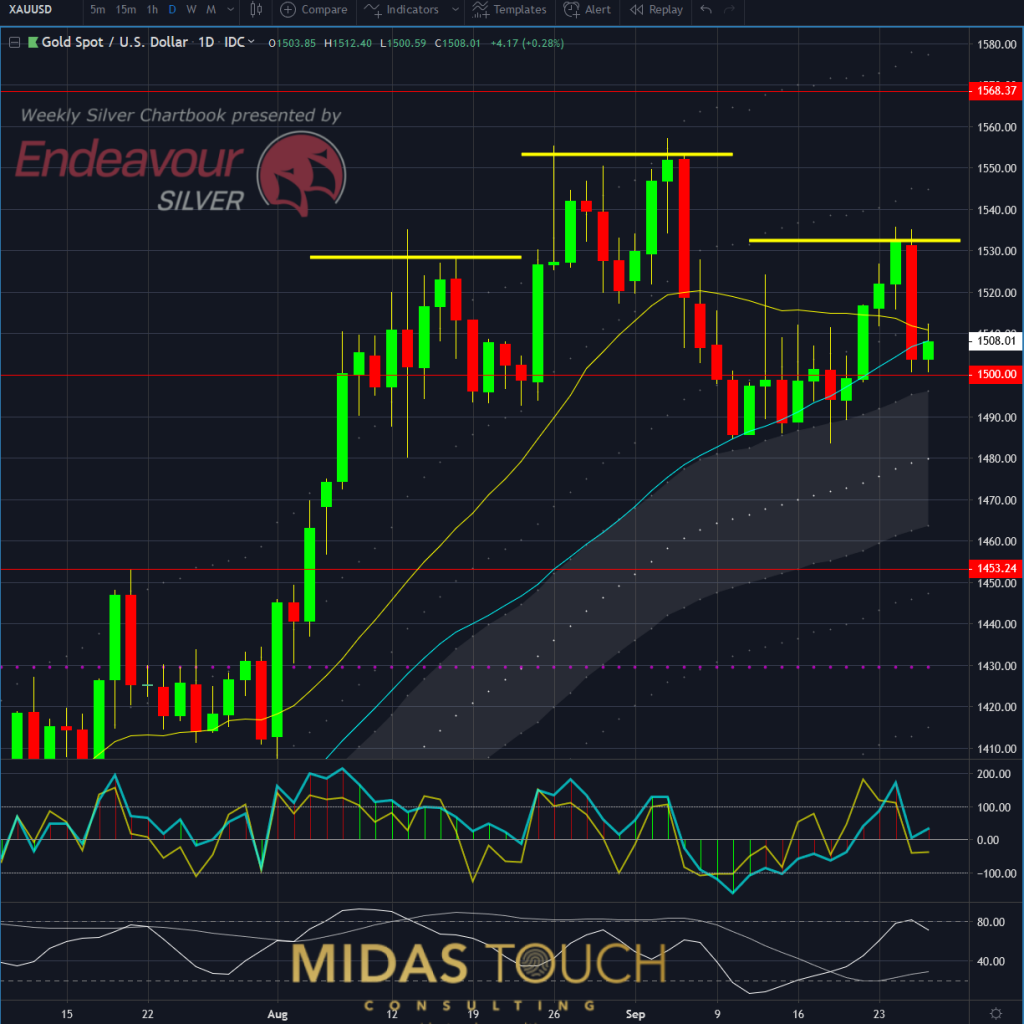
Gold, daily chart, 9/26/2019, telltale of a topping market:

Gold in US-Dollar, daily chart as of Sep 26th, 2019
Guidance for being reluctant to be too risky at these higher levels of the overall trend in the precious metal sector, was the daily gold chart. The possible reversal pattern of a head and shoulders formation was one of the warning signals to not be to aggressive in capital exposure.
It is being said that trading is 90% psychology and some set this percentage number even higher. We can nothing but agree. In a game where no one can predict the future and one has to act in a field of constant uncertainties. It is key to be in utmost control of all the parts that are controllable. Don’t let price alone lure you into a trade but simply consider every and all aspects of how to get a true consistent edge on the outcome of your trades.
Follow us in our telegram channel.
If you like to get regular updates on our gold model, precious metals and cryptocurrencies you can subscribe to our free newsletter.


