


Review
Since our last analysis from July 12, 2019, Bitcoin has continued its correction as expected. Back then, we called a potential target zone between US$7,000 and US$9,000. This zone was almost reached on July 17, with the lows at US$9,050.
After prices rebounded from the broad support zone between US$8,600 to US$9,100 with a low of US$9,111 on July 28, market participants took more courage again. Within less than two weeks of trading, prices jumped up significantly and reached US$12,325 on August 6 almost within sight of the annual high at US$13,880. However, over the past ten days, Bitcoin prices have slipped south again and are currently trading at US$10,000.
Overall, a broad-based consolidation at high levels and a flat downward trend channel have emerged in the last one and a half months. So far, there is a series of lower highs, while at the same time volatility has retreated due to the summer trading season. Considering the sharp and impressive rally from movement US$3,125 to US$13,880 (+ 344%), the current correction remains modest and healthy with the maximum pullback being 34.8% so far.
Technical Analysis For Bitcoin

Bitcoin in US-Dollar, weekly chart as of August 15th, 2019. Source: Tradingview
On the weekly chart, the overall extremely bullish setup is obvious. Bitcoin has risen from US$0.008 to nearly US$20,000 in just under 10 years, far outperforming all other asset classes. It is very likely that this unique performance will continue in the coming years.
In the next two months, however, new all-time highs are not foreseeable. Rather, Bitcoin is in a consolidation at high levels, which seems not yet completed. It is therefore more likely that prices will continue to bounce back and forth with a tough and confusing sideways movement. With Bitcoin futures having an open gap at US$8,500, a new low within the current correction cycle is also conceivable. However, prices below US$6,500, are extremely unlikely.
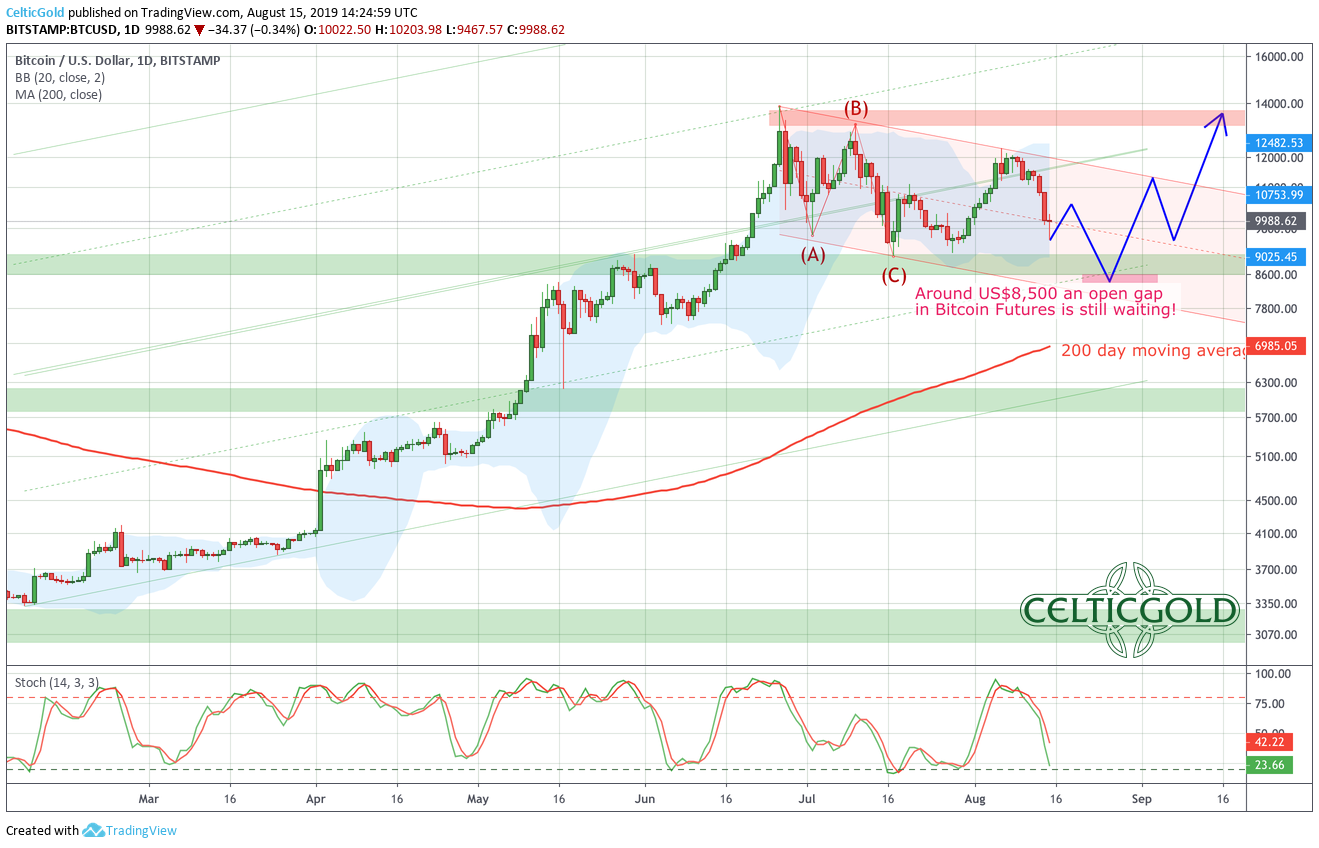
Bitcoin in US-Dollar, daily chart as of August 15th, 2019. Source: Tradingview
The daily chart captures the price movements of the last three and a half months. Since the high of US$13,887, a series of lower highs has been established, while at the bottom, the support zone between US$8,600 and US$9,100 has been tested only once.
With the recent sell-signal from the Stochastic Oscillator, Bitcoin has now fallen back within the relatively shallow downtrend channel below US$10,000. As this psychological number has not stop the sell-off, the open gap in the Bitcoin Futures is likely to attract prices at around US$8,500 US dollars. Depending on how long the consolidation process will take, the 200-day-moving-average (7,042) could rise towards this price area until end of September.
A closed gap and a successful test of the 200-day-line as well as a strongly oversold situation could then form the ideal foundation for a explosive rally in the 4th quarter 2019.
Overall, the daily chart lacks any bullish evidence and provides more warning signals than contrarian opportunities. I recommend a wait-and-see attitude.
Commitments of Traders Report For Bitcoin
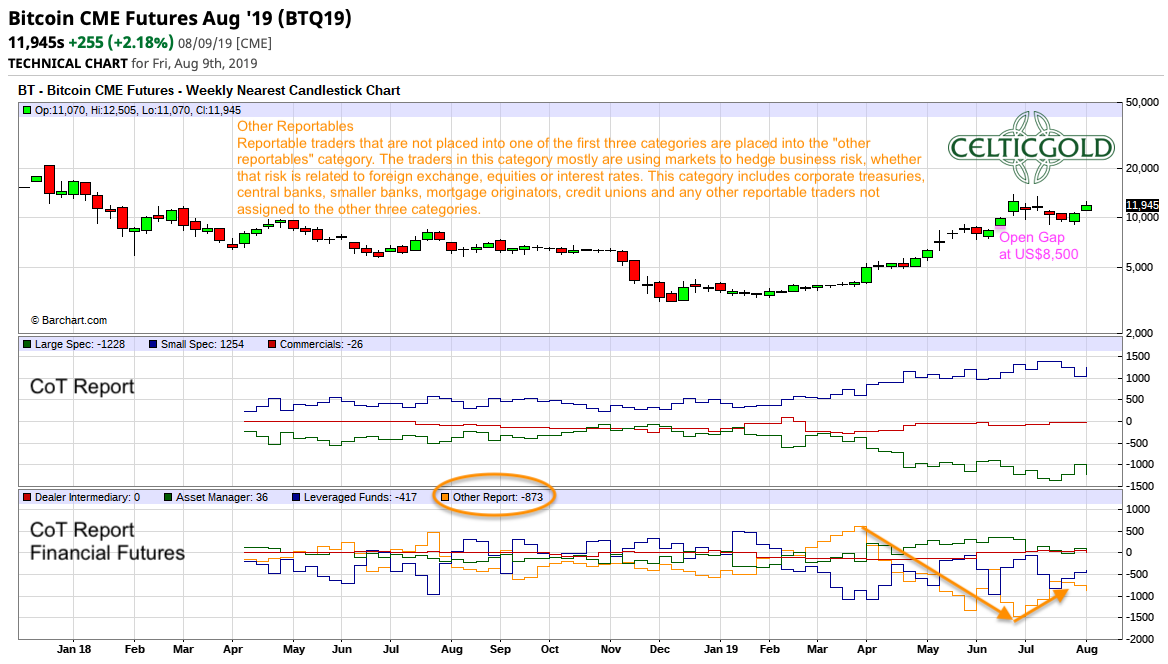
Commitment of Traders for Bitcoin as of August 9th, 2019 Source: Barchart
As mentioned before, Bitcoin has a relatively small set of data available, since bitcoin futures contracts have only been trading since December 2017. Based on the weekly COT report, a rather atypical picture emerges so far, because the commercial hedgers, which are usually known as contra-indicators and “smart money”, are not (yet) particularly active in the bitcoin futures market. This is most likely due to the fact that there are still not many products that can or need to be hedged via the derivatives markets. In addition, most “market makers” are different crypto exchanges that are spread all over the planet and can also hedge against client positions via their own platform.
However, it is remarkable that the small speculators (i.e reportable private traders or traders) have continued to expand their pro-cyclical long positions between spring to mid-July, while the large speculators (big hedge funds) have taken the other side and are clearly short on Bitcoin.
Most interesting though is the positioning of the “Other Reportables”. This group is not listed individually in the normal COT report and represents all reportable traders who can not be assigned to one of the three groups of producers, swap dealers or money managers. In retrospect and from a countercyclical point of view, this group has played the bitcoin market almost perfectly as they were heavily on the long side at the starting point of the Bitcoin Rally in April. Over the last few months however, the “Other Reportables” have moved further and further to the short side. Since the high in July, they have gradually covered their shorts. It will be interesting to see, how much of their shorts have been covered with Bitcoin now trading below US$10,000 again. Once this group has a solid long position again it is time to join the long bitcoin trade!
If one follows the group of the “Other Reportables” the correction will have to go continue in the coming weeks until Bitcoin will find a new and final low in the autumn.
Sentiment Bitcoin
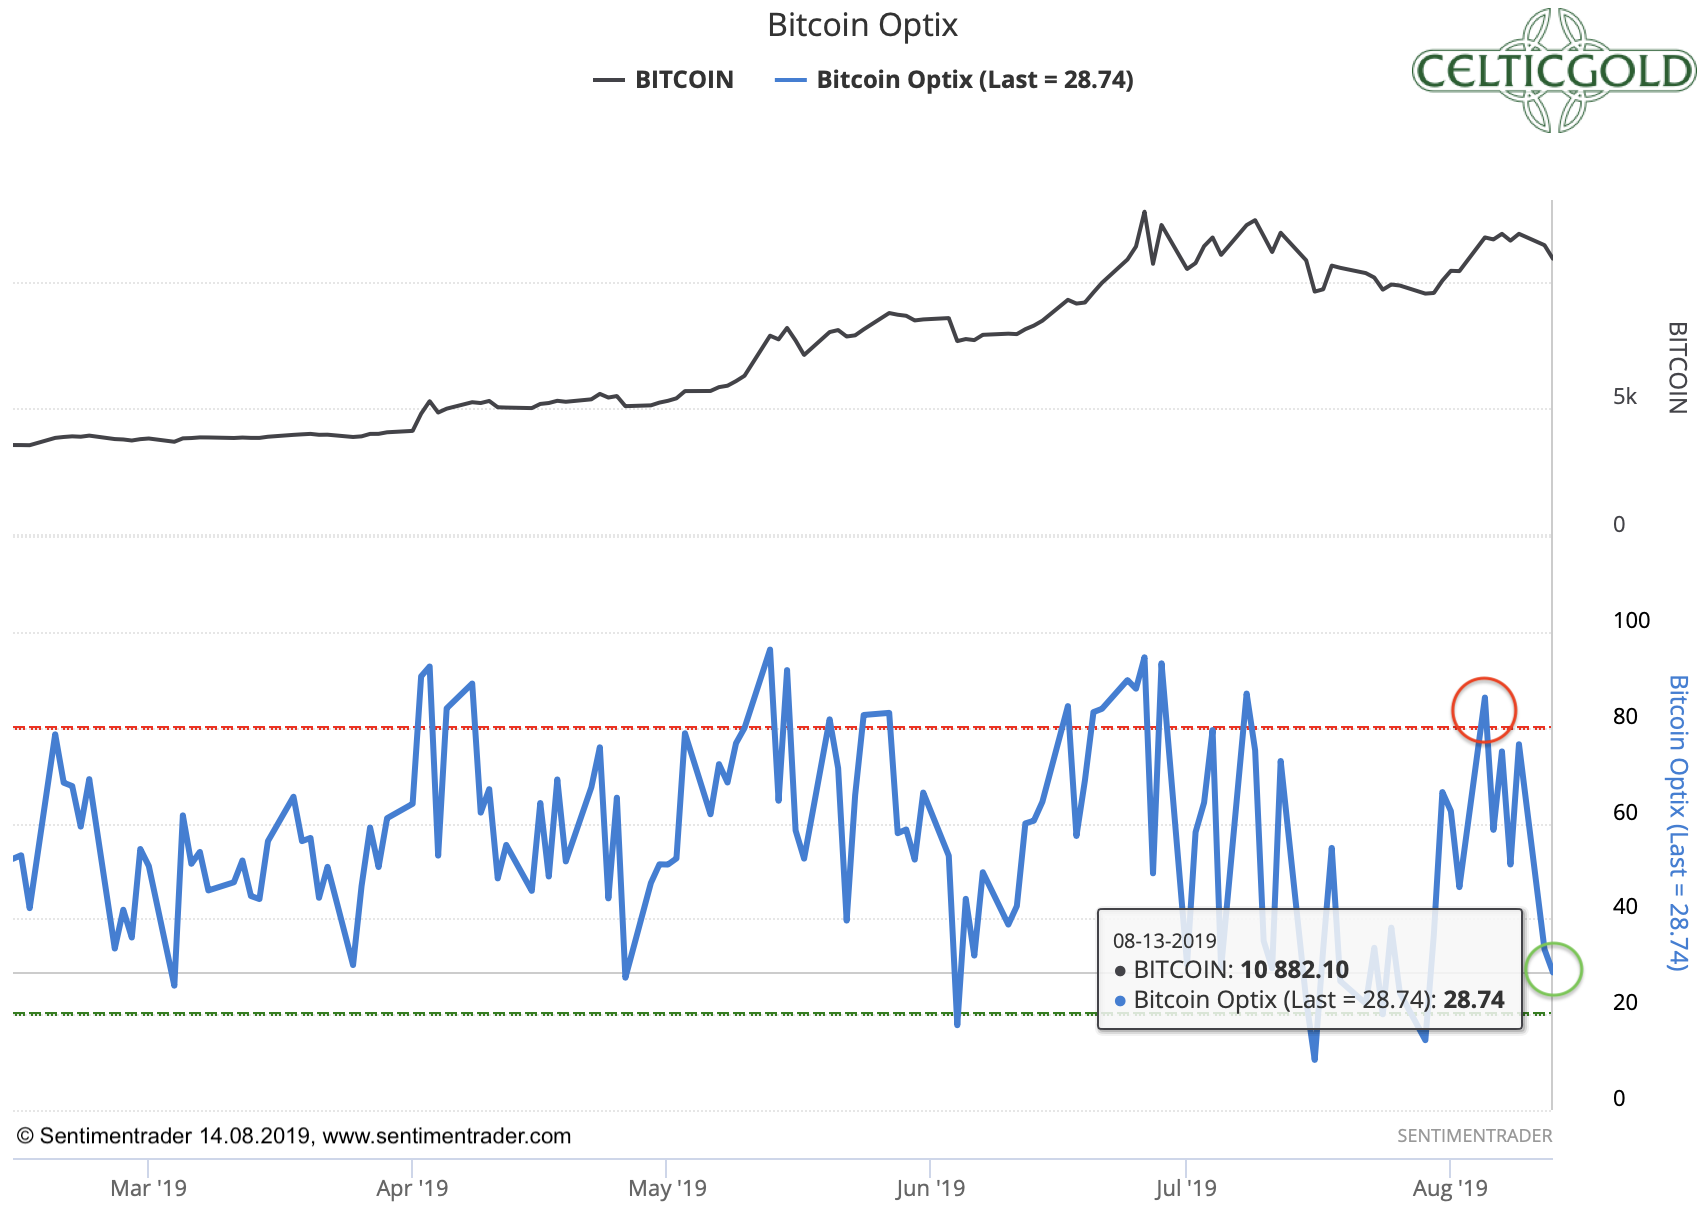
Bitcoin Optix as of August 14th, 2019. Source: Sentimentrader
According to data from Sentimentrader, the sentiment for Bitcoin peaked on August 5 at US$11,800. Since then, the correction has already pushed the mood among market participants towards growing pessimism. Overall, it doesn’t take much more beating until the Bitcoin Optix will move to a contrarian buy signal.

Source: Crypto Fear & Greed Index
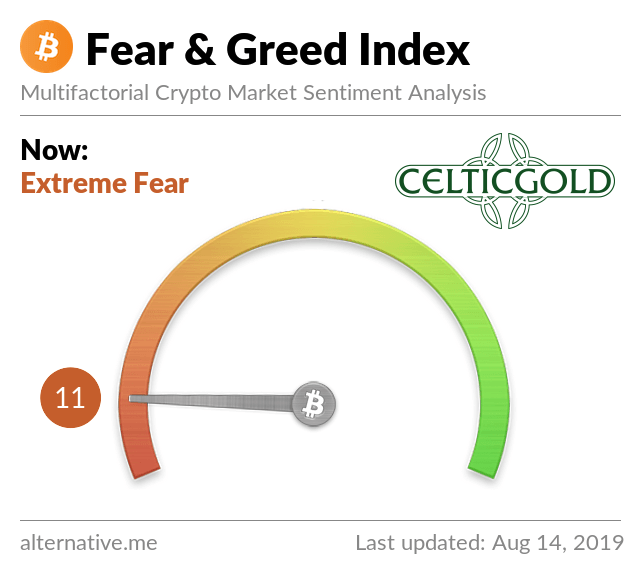
Source: Crypto Fear & Greed Index
Similar results are currently being provided by the far more in-depth “Fear & Greed Index”, although no pronounced sentiment highs have been measured by the index in early August. Rather, the last sentiment high was well below the euphoria high of late June. Interestingly enough, the “Fear & Greed Index” has now plunged nearly as deep as in last December when the crypto winter reached its final lows. The downward pressure has obviously surprised many market participants during the last few days.
In summary, the sentiment analysis does not yet provide a buy signal. Neither of course is the euphoria among the investors so extreme, that one would have to bring himself and his investments to safety, nor is there a blind panic and blood in the street, which one should use to buy with both hands. However, in the short term, due to the price decline of the last few days the mood has fallen surprisingly deep into pessimistic levels.
Seasonality Bitcoin
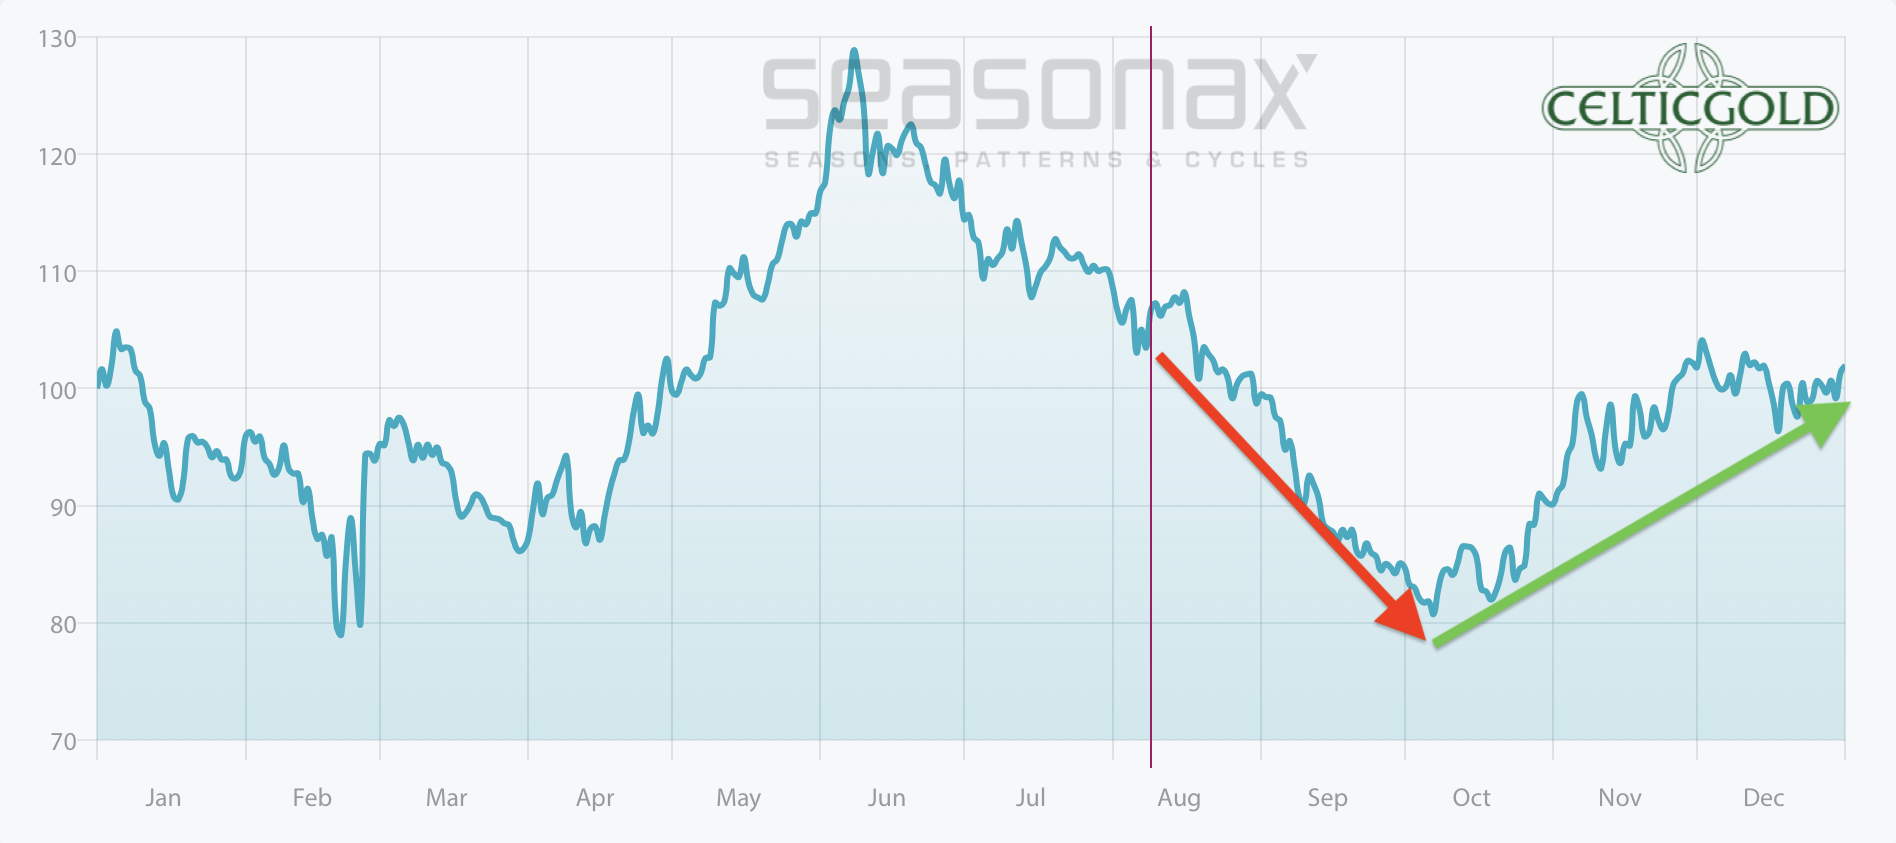
Seasonality for Bitcoin as of August 11th, 2019. Source: Seasonax
Even though an evaluation period of only 10 years for Bitcoin is rather short, there is a certainly a clear picture regarding the typical seasonal price pattern. Due to the exorbitantly large price swings, however, this pattern can change significantly within just one year!
In the current year, Bitcoin has so far followed its seasonal cycle quite well. Accordingly, the correction could continue until the end of September or mid-October, while the fourth quarter should bring significantly rising prices!
Generally, we are in the middle of summer doldrums. Many traders are on vacation and like to take a break after the massive rally in the second quarter. Lower volume and falling volatility did confirm this. In summary, the seasonality currently provides no reason to be fully invested in the crypto market.
Bitcoin against gold
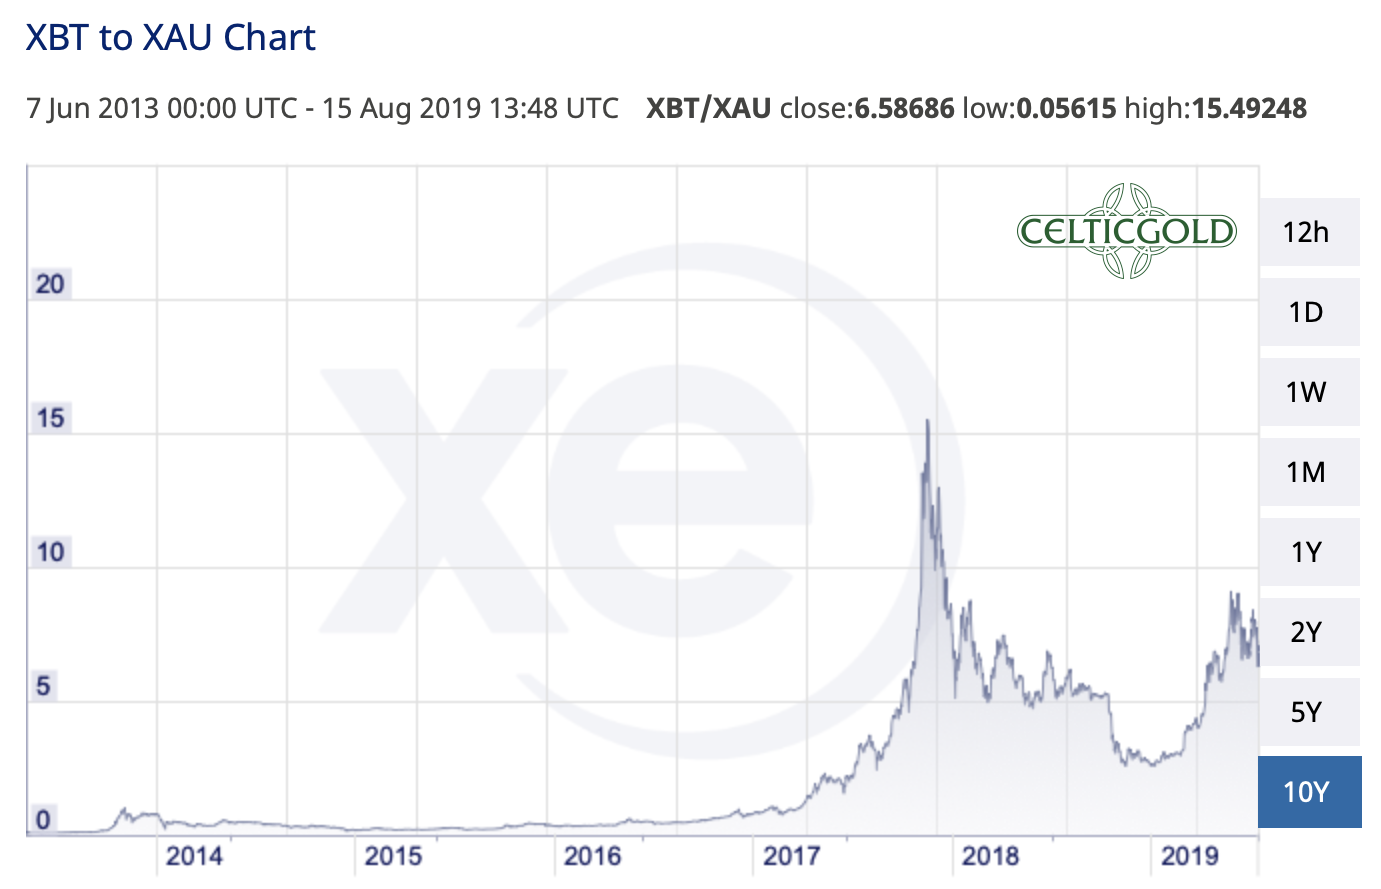
Bitcoin in Gold as of August 11th, 2019. Source: XE
Currently, a Bitcoin costs just under 6.5 ounces of gold. In other words, for one ounce of gold, you currently have to pay 0.152 Bitcoin! As a result, gold has become about 26% more expensive against Bitcoin in the last four weeks. Although the gold price is currently heavily overbought, for the immediate future the trend could continue in favor of gold. An exchange of bitcoin into gold is not advised at current levels anymore.
Basically, one should be invested in both asset classes. The recommended allocation in precious metals (primarily physical) should be at least 10% and a maximum of 25% of one’s total assets. In cryptos and especially in Bitcoin investors should hold at least 1% and a maximum of 5%. If you are very familiar with crypto currencies and Bitcoin, you can individually allocate higher percentages in Bitcoin. For the normal investor, who of course is invested mainly in equities and real estate, holding 5% in the highly speculative and highly volatile Bitcoin is already quite a lot!
Conclusion and recommendation
The situation in Bitcoin has obviously reversed over the last one and a half months. The correction brought an end to the euphoria with a healthy but still manageable pullback.
However, these sideways and consolidation phases are anything but easy to handle. On top of that, the low summer trading season is causing nerve-racking moves in Bitcoin, as the crypto currency jumps up and down with $500 price swings without a sustainable prevailing trend. Only in the last days the bears were able to achieve significant progress.
In the larger picture, lower prices seem still likely in the weeks ahead. Should Bitcoin close its open gap at US$8,500, aggressive long positions are recommended. On the other hand, if the last two highs at US$12,300 and US$13,200 can be taken out, a new wave up with a first target at US$20,000 should already have started.
For the time being, a wait-and-see attitude at the sidelines is recommended.
Source: www.celticgold.eu
If you like to get regular updates on our gold model, precious metals and cryptocurrencies you can subscribe to our free newsletter.

