


Bitcoin – rotation and beta
Beta is a measure of a trading instrument in relation to its market. A beta below 1.0 describes the instrument moving percentage wise less than the market. A beta above 1.0 means the underlying instrument outperforming the market percentage wise. Influencing factors are the underlying volatility of an instrument, rotation and relative strength/relative weakness among others. We talked recently about volatility in this chartbook in our precious metal section. Rotation can display in many forms, one of them being hedges done by larger players. A typical rotation chain would be after a bitcoin rally money flowing from BTC to large caps (ETH), and after a trend establishment flowing further to mid caps and low caps. For example, a similar cycle of roll over would be the real-estate market selling first, than low and mid caps, to finally large cap stocks and market indices. Relative strength/weakness simply implies underlying strength in certain sectors or groups and results in under or outperforming instruments. Bitcoin – rotation and beta!
These three aspects of volatility, rotation and relative strength/weakness can all influence risk. You need to factor in this chance of increased risk towards your money management calculations.
Our last weeks trading instrument selection was predominately influenced by these principles.
BTC/USDT, weekly chart, October 25th 2019, “possible rotation”:
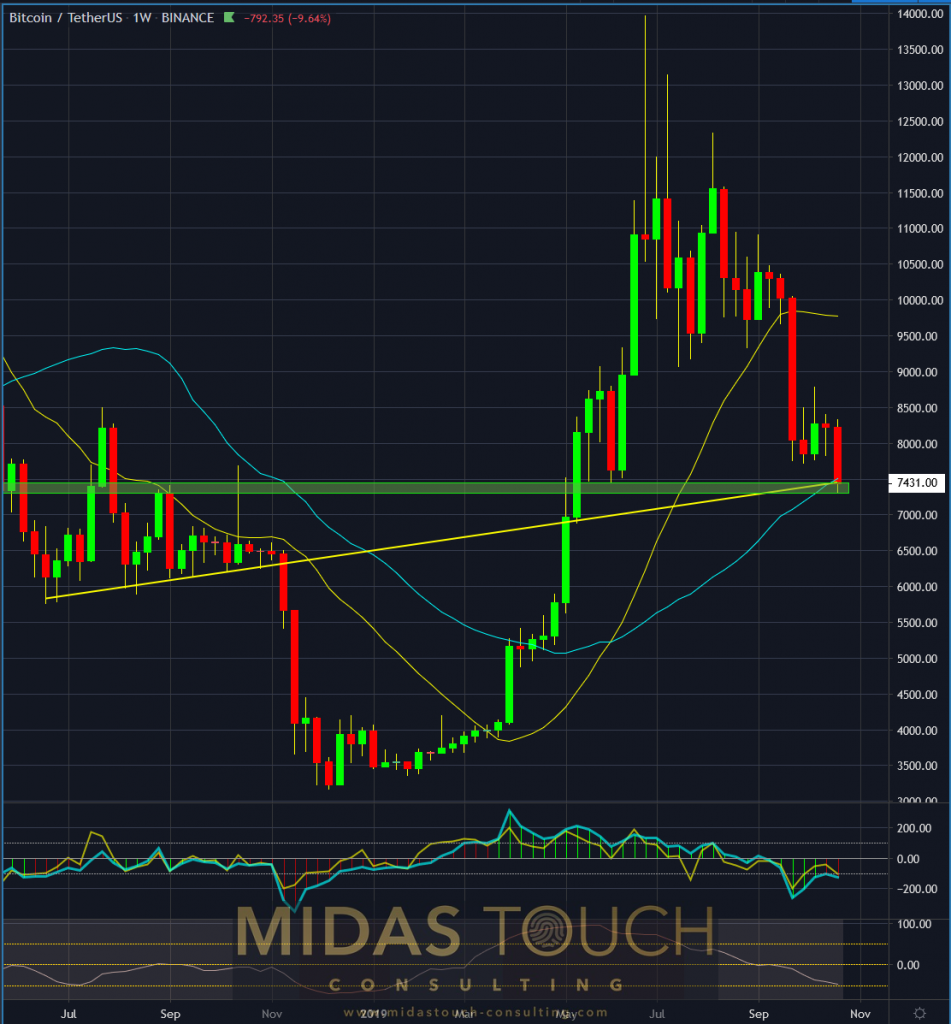
Bitcoin in TetherUS, weekly chart as of October 25th 2019
We identified the high probability of a larger time frame tuning point (see weekly chart above strong support, posted in our previous chartbook). This prepared us for money exposure choices rather towards beta candidates, a more aggressive choice, versus the market itself.
10/29/2019, BTC/USDT, daily chart, “buying aggressively into beta instruments”:
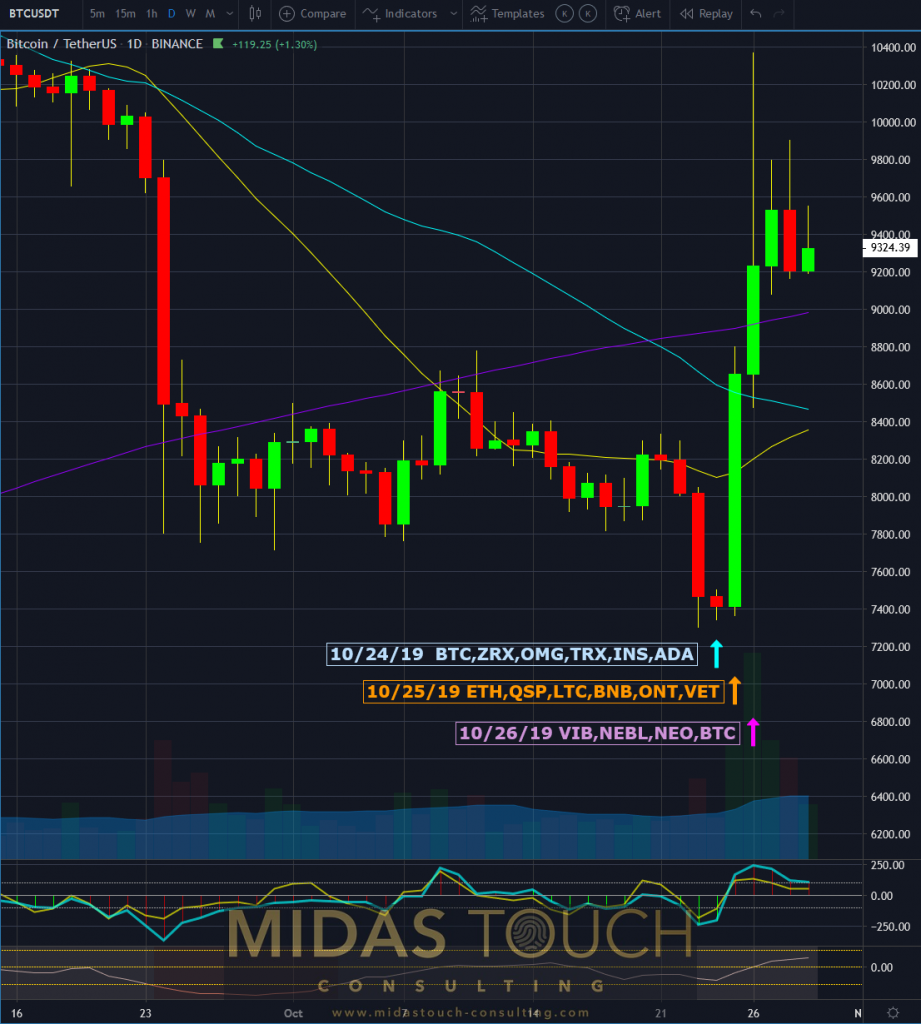
Bitcoin in TetherUS, daily chart as of October 29th 2019
Right the day after the bitcoin market broke its range on the 23rd of this month through the US$7,800 support level, we started accumulating the following coins:
10/24/19 BTC, ZRX, OMG, TRX, INS, ADA
10/25/19 ETH, QSP, LTC, BNB, ONT, VET
10/26/19 VIB, NEBL, NEO, BTC
(posted live in our telegram channel)
The following chart illustrates how a market participant can take advantage of beta and rotation:
Daily chart, 10/27/2019, BTC/USDT, “beta, bang for the buck”:

Bitcoin in TetherUS, daily chart as of October 27th 2019
The beta of ONT at the time of our partial profit taking on 10/27/19 had a value of 9. Meaning it moved nine times more by percentage than BTC on that day at this particular moment in time. It had a true beta on that day of more than twice that much. But we wanted to give an accurate picture of our real time posted actual profit taking in our telegram channel.
For some traders it might also be an aspect, that bitcoin was trading near US$9,500, while for example ONT was trading below a dollar.
Bitcoin – rotation and beta
There are many ways to skin a cat. First you need to catch it though! The larger the time frame support is for a possible turning point, the grander the rewards can be. There is also a higher likelihood for the turning point to actually work out. Trading the turning point (catching the cat) might be more difficult. This is due to more players of various time frames being involved. One additional tool in a market speculator´s tool kit is beta and rotation. These ways of approaching such a turning point allow for early and late entries and profit maximization. For instance on the 27th of October, we took nine times as much profits with Ontology (ONT) versus bitcoin itself.
All charts timely posted in our telegram channel.
If you like to get regular updates on our gold model, precious metals and cryptocurrencies you can subscribe to our free newsletter.

