


Indicator divergence
With a vast following of market speculators, we receive a consistent inflow of questions and comments about the market. Traders ask in our our telegram channel, in which we post our trades live, and via e mail as well as in our public appearances, about all kinds of market related issues. One phenomenon seems striking. The fact that most find taking the “easy” trades hardest and simply skip them. We strongly discourage such behavior. There is no evidence that trades that “look too good to be true” have a diminished statistical edge. Quite the opposite, altering a systematical approach in skipping easy to identify (“beautiful” trades) signals, will have a negative effect on ones overall performance. Indicator divergence is one such stack-able edge that at times is unmistakably present to ones observation.
As with any other edge it should not be traded isolated. And, in principle, the outcome of the trade is still random from an individual trade perspective. Leaving clear signals out is negative curve fitting and should be avoided. So the next time you see an indicator divergence like the following, just trade them alike the lesser pronounced ones.
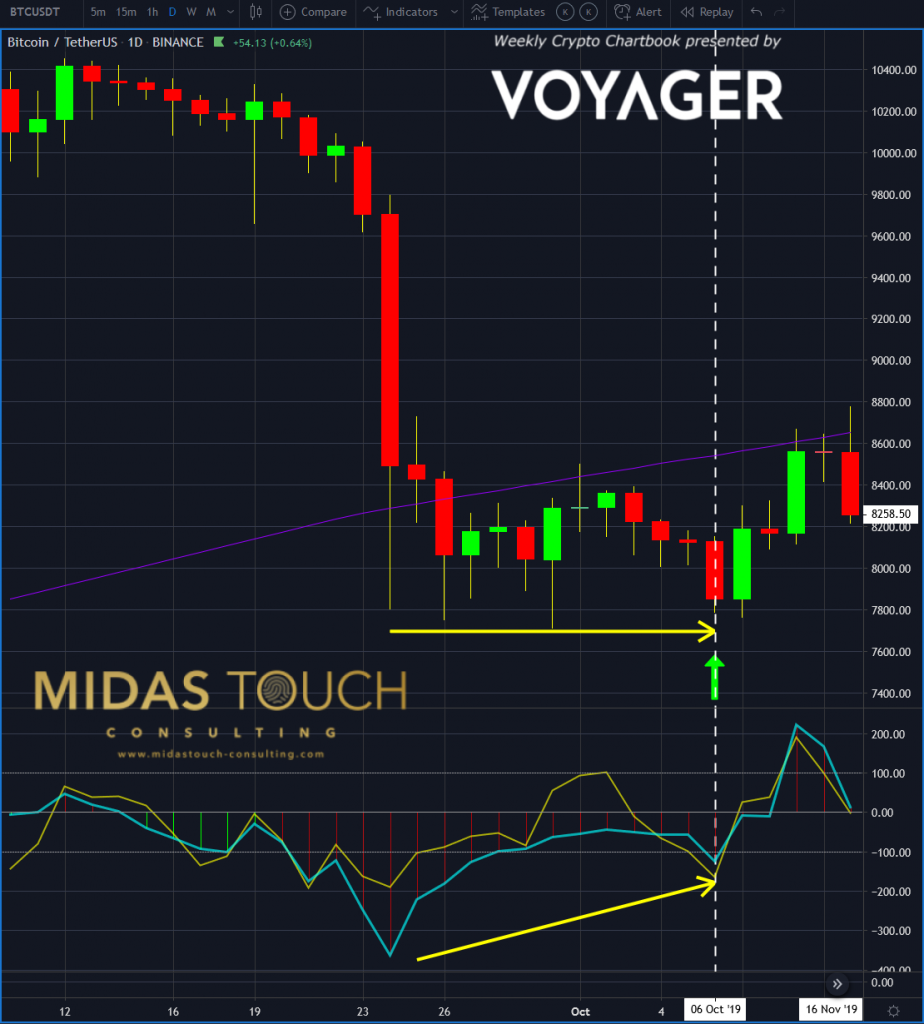
Daily chart, BTC/USDT, October 6th 2019, “price in sideways range”:
Bitcoin in TetherUS, daily chart as of October 6th 2019 a
In the chart above, one can identify a two weeks sideways price trading range. The US$7,800 price zone in Bitcoin is representing support. While prices go sideways the Commodity Channel index indicator shows a clear divergence with higher readings. We placed a long entry at the time live in our telegram channel.
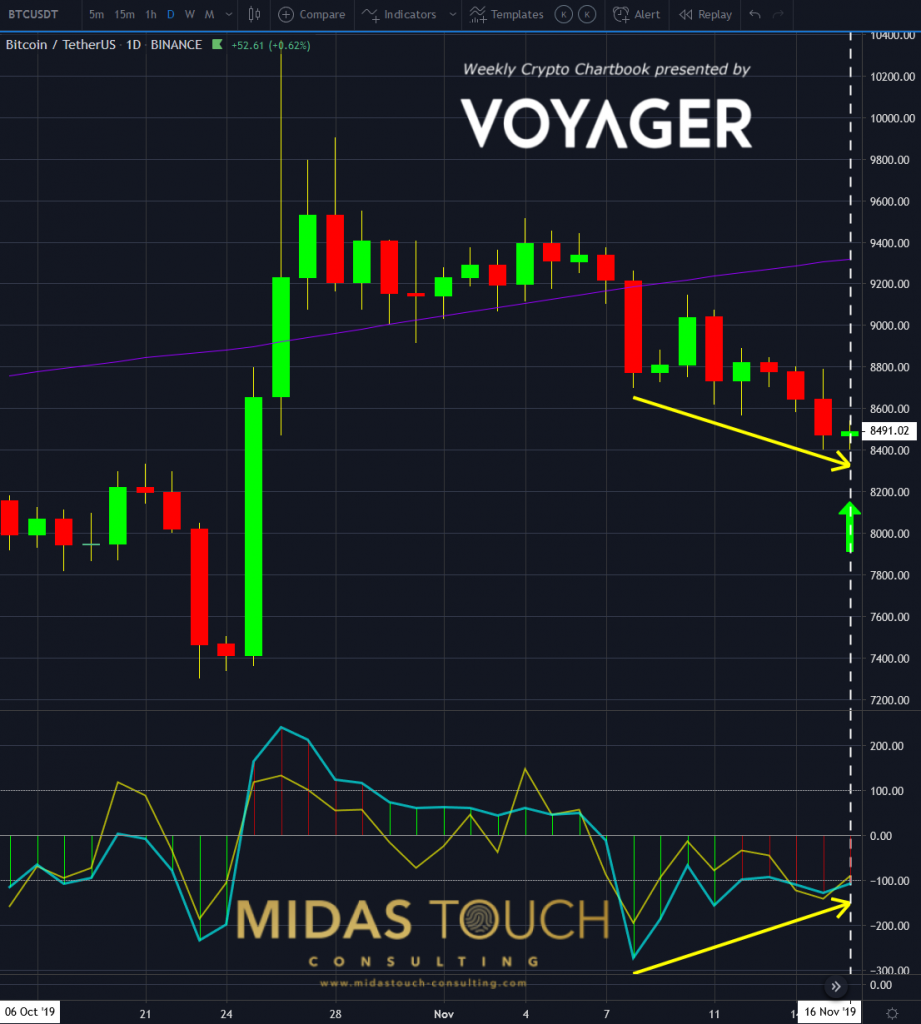
Indicator divergence, BTC/USDT, daily chart, October 11th 2019, “positive indicator divergence”:
Bitcoin in TetherUS, daily chart as of October 11th 2019 b
Five days later the bitcoin market had advanced by 1,000 points.
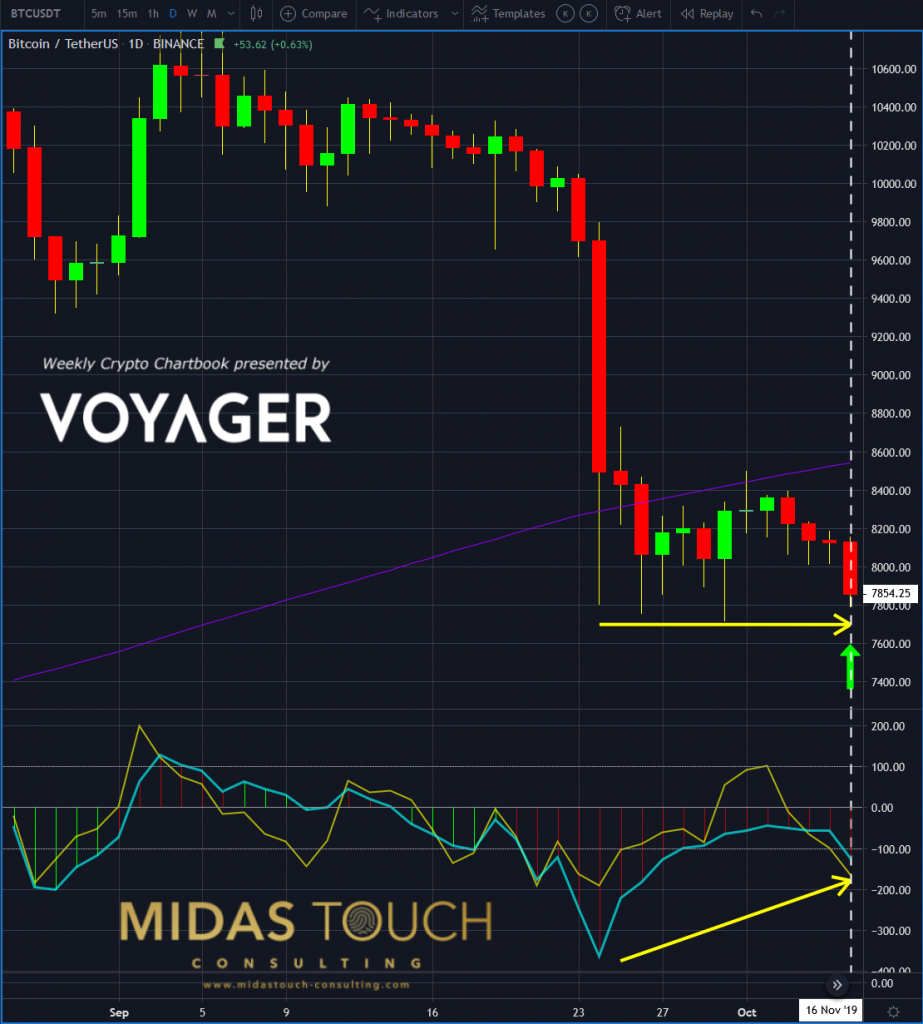
11/16/2019, BTC/USDT, daily chart, “price trending down”:
Bitcoin in TetherUS, daily chart as of November 16th 2019 c
This daily chart shows a price decline over the last nine trading days. Upon other reasons, we went long due to a clear indicator divergence present in the Commodity channel index indicator, which was moving in the opposite direction.

BTC/USDT, daily chart, November 17th 2019, “indicator sloping upwards”:
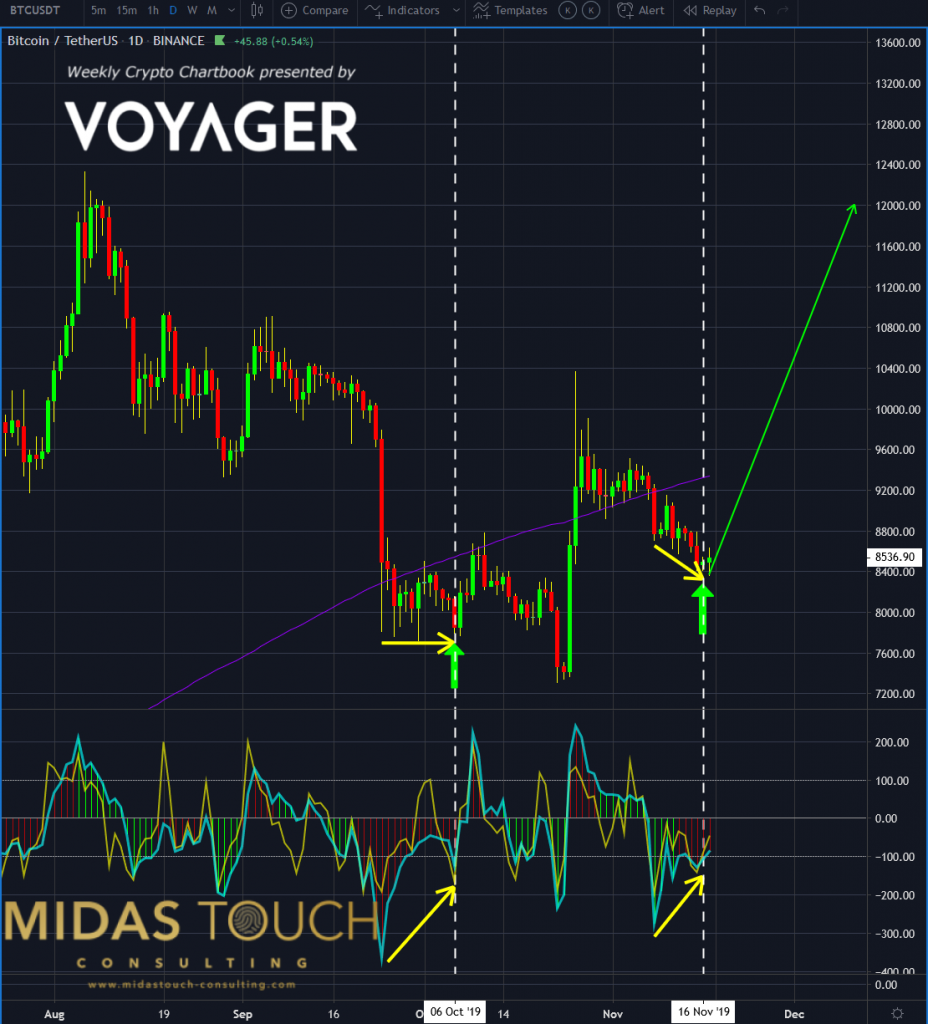
Bitcoin in TetherUS, daily chart as of November 17th 2019 d
The following day immediate price advances allowed for taking the risk out of the trade (see our quad strategy). What is left is potential (green up arrow) without risk. A traders ideal scenario to play with the markets money.
Indicator divergence
If you have to squint to see an edge on an indicator, you might skip over taking a trade. An edge should be clearly identifiable.
On the other hand, skipping a trade, just because it looks “too good to be true” has no merit. By defining ones edges as clearly as possible and than executing a trade upon its appearance without hesitancy, one assures a consistent outcome.
All charts timely posted in our telegram channel.
If you like to get regular updates on our gold model, precious metals and cryptocurrencies you can subscribe to our free newsletter.

