Strength
The strength of a market needs to be measured consistently. It is important to look for clues that help to support an elimination protocol. This will lead to the proper next action to be taken. It isn’t enough to just identify trend. Looking at how movement of price has evolved and how various time frame action is manifesting is key. Aspects of strength are as plentiful as the stack able odds for entry selection. We recommend a top down approach in time frame to measure a directional markets strength in time.
Looking at Bitcoins behavior in recent months under the aspect of strength, it will show a probability of whats most likely to be expected in the future.
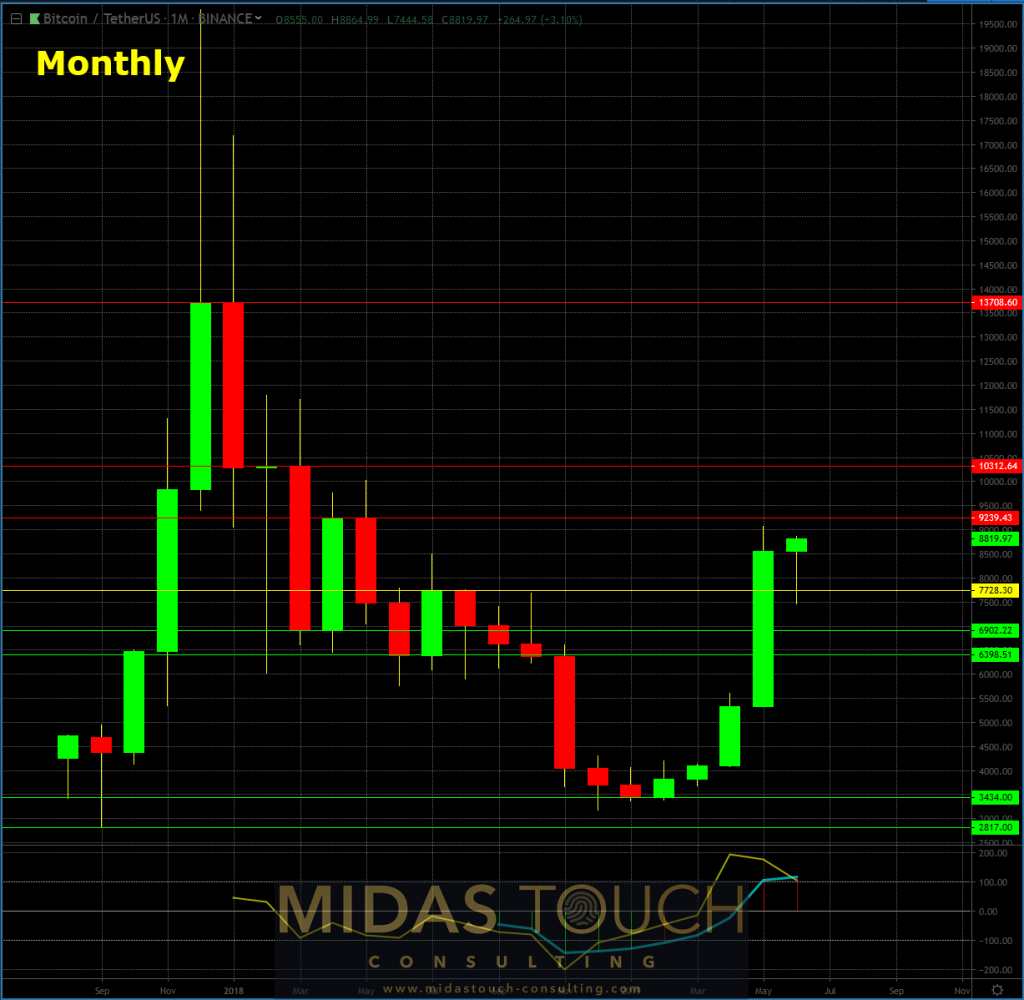
Monthly charts of BTC/USDT, 15th of June 2019, rapid acceleration:

Bitcoin in Tether US, monthly chart as of June 15th 2019
The monthly chart shows the rapid acceleration of price advancements over the last four and a half months (= candle sticks increase in length). Strong resistance has been penetrated fairly easy and has now become support (e.g. two green horizontal lines at price levels US$6,902 and US$6,398). In the first half of June we had the first significant retracement (towards the yellow line), but are already trading above May’s closing price!
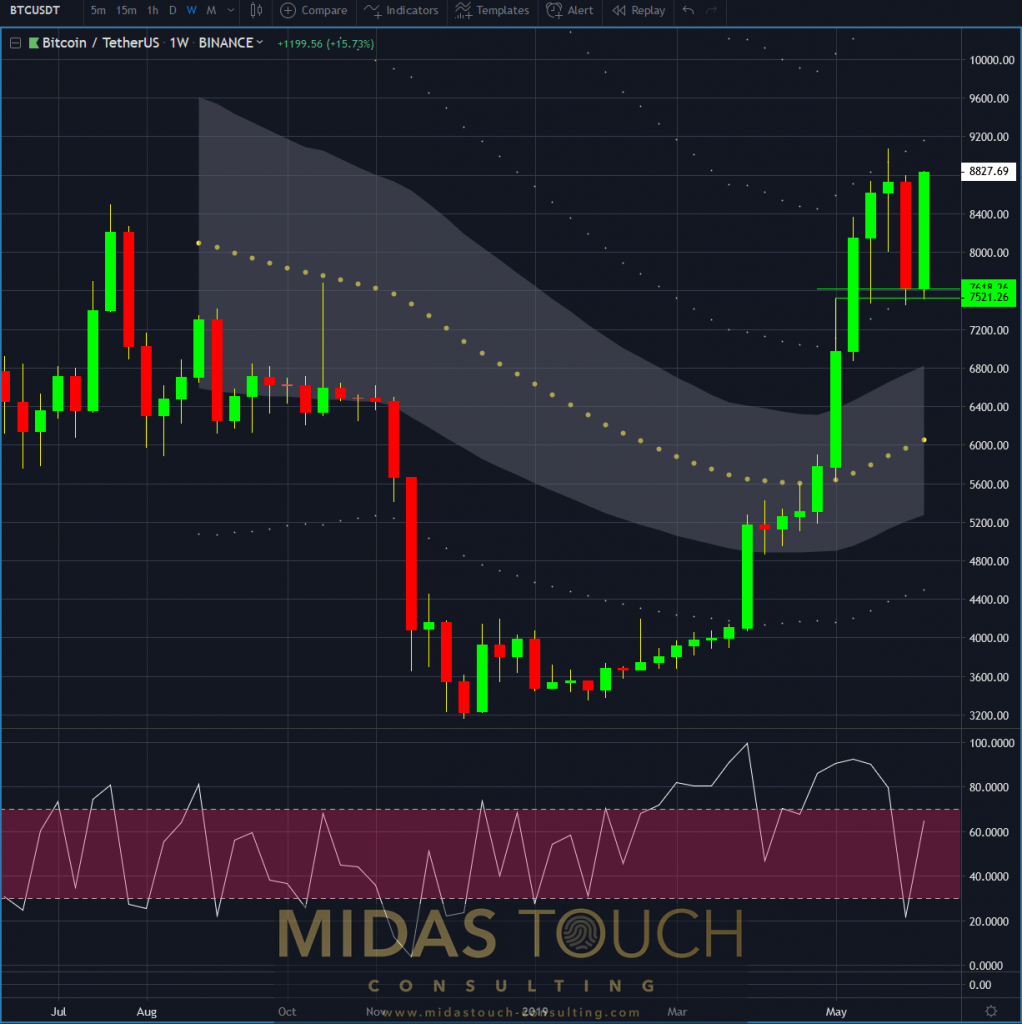
Weekly chart of BTC/USDT – 06/15/2019, long reversal:

Bitcoin in Tether US, weekly chart as of June 15th 2019
The weekly chart shows most significantly of how strong the recent move in the bitcoin market has been. Even with a clear reversal signal in the prior two weeks, last weeks decline was not only in proportion to the prior move small in size but has been overcome within a week.
Chartists call this candle stick pattern a ‘bullish engulfing pattern”. One doesn’t have to be a Japanese candlestick expert to realize that everybody who shorted BTC last week is now under water or already stopped out. Prices are already trading higher than previous weeks closing price.
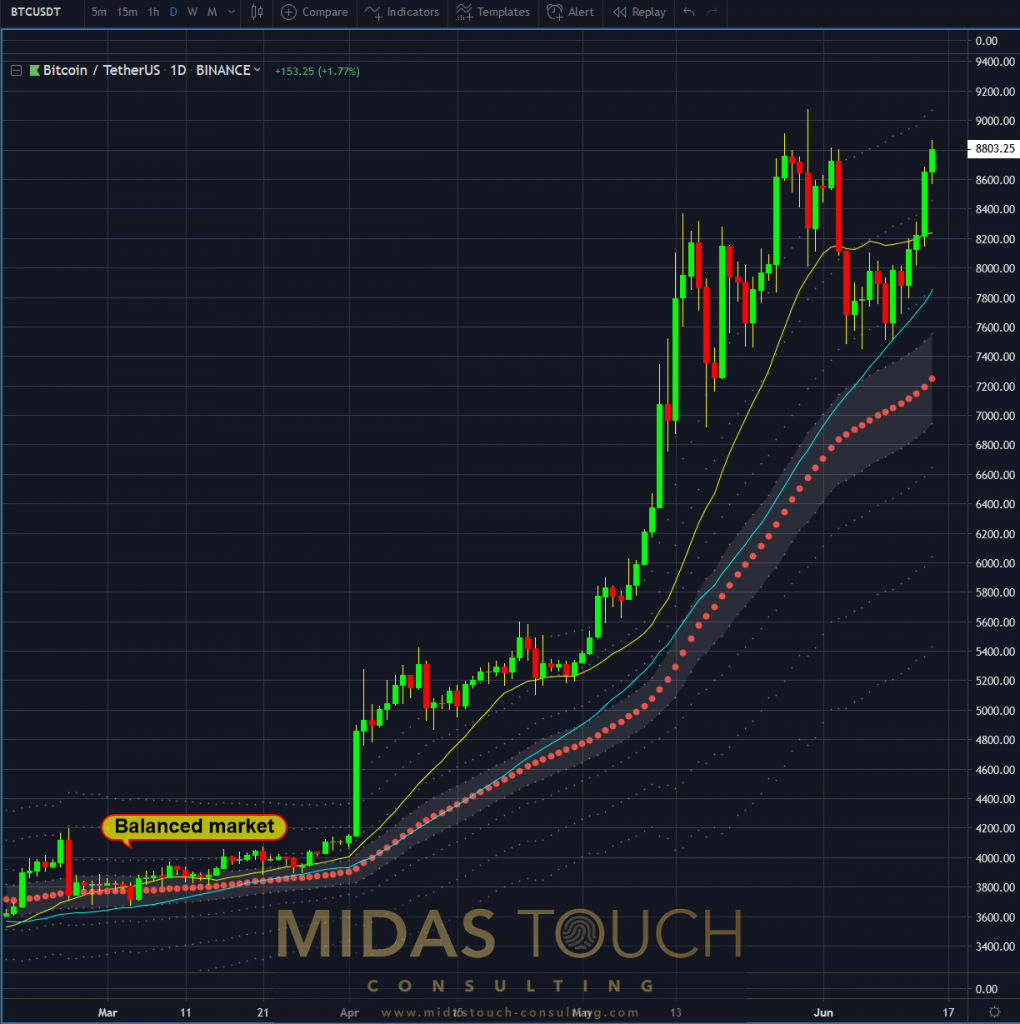
Daily chart of BTC/USDT – June 15th 2019, small retracements indicating strength:

Bitcoin in Tether US, daily chart as of June 15th 2019
Examining the daily chart shows, that we have to go all the way back to the mid of March to find a balanced market. Since then, prices have pushed higher and have for the most part stayed above the simple 20 day moving average (yellow line). The deepest retracement happened a week ago where prices touched the simple 40 day moving average (blue line). But above all, prices have never returned back to the mean (red dotted line) during the last three months!
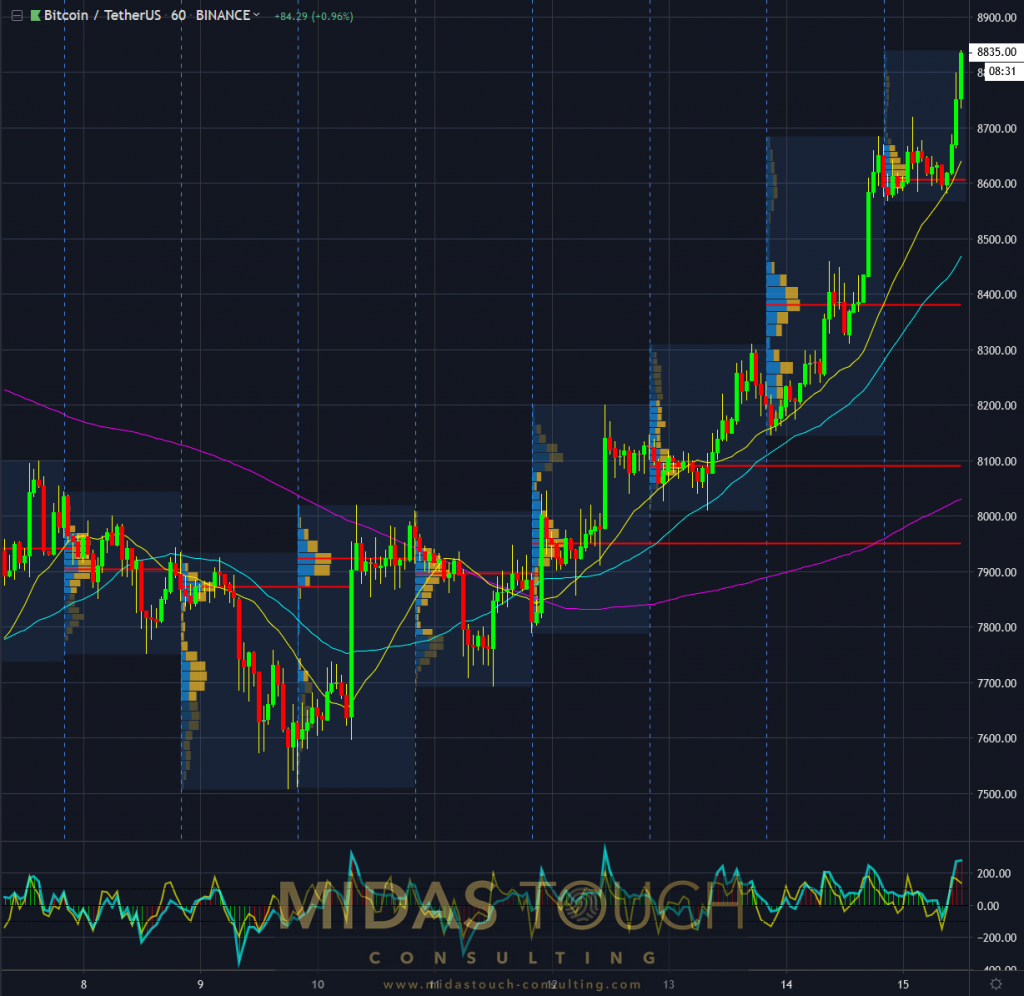
Hourly chart of BTC/USDT – 06/15/2019, strength all around:

Bitcoin in Tether US, 60 minute chart as of June 15th 2019
We do a top down approach, however not rarely a lot of information can be found in smaller time frames as well. Looking at the hourly chart above, one can extract that within last weeks price action, prior day POC levels never got revisited. POC = Point of Control, which means the price level for the time period with the highest traded volume. This is a function of the ‘market profile’ advanced charting study. What this means in laymen terms is that the most significant prior days support resistance level never even got retested. It reflects the emotion of greed within the majority of market participants.
All factors in conclusion indicate health and strength.
That is not to say that a potential double top here, viewed form a daily time frame perspective and approached with this kind of speed (action/reaction principle) couldn’t result into a turning point. The odds though slightly favor the ’10k magnet’. Of course, a move closer to the US$10,000 mark would offer a favorable distribution zone. Here short entries could then find good support for their stops.
The strong breath of last week after the previous decline gives away the strength of this market. Make a note by comparing with last week´s chartbook release of how quickly sentiment can change.
It is important to “never assume” (a principle we follow religiously), but rather to regularly & unambiguously do a top down market analysis!
All charts timely posted in our telegram channel.
If you like to get regular updates on our gold model, precious metals and cryptocurrencies you can subscribe to our free newsletter.


